
Market Overview
| Study Period | 2021 - 2031 |
|---|---|
| Forecast Data Period | 2026 - 2031 |
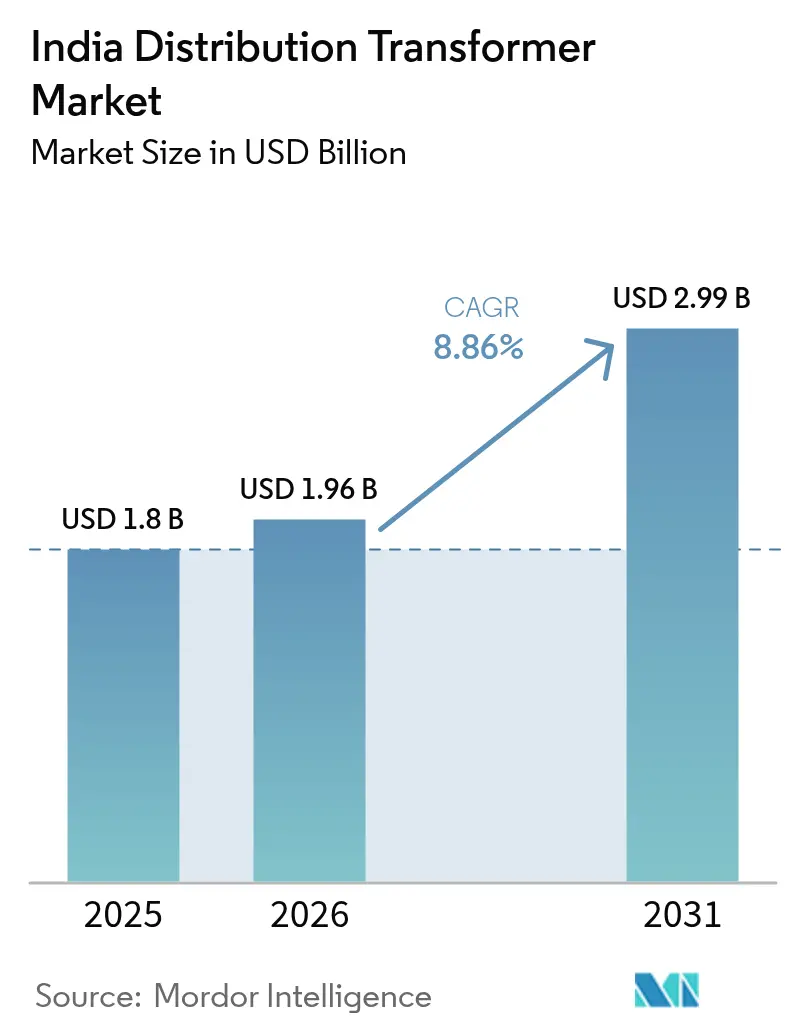
| Base Year Market Size (2025) | USD 1.8 Billion |
| Market Size (2026) | USD 1.96 Billion |
| Market Size (2031) | USD 2.99 Billion |
| Growth Rate (2026 - 2031) | 8.86 % |
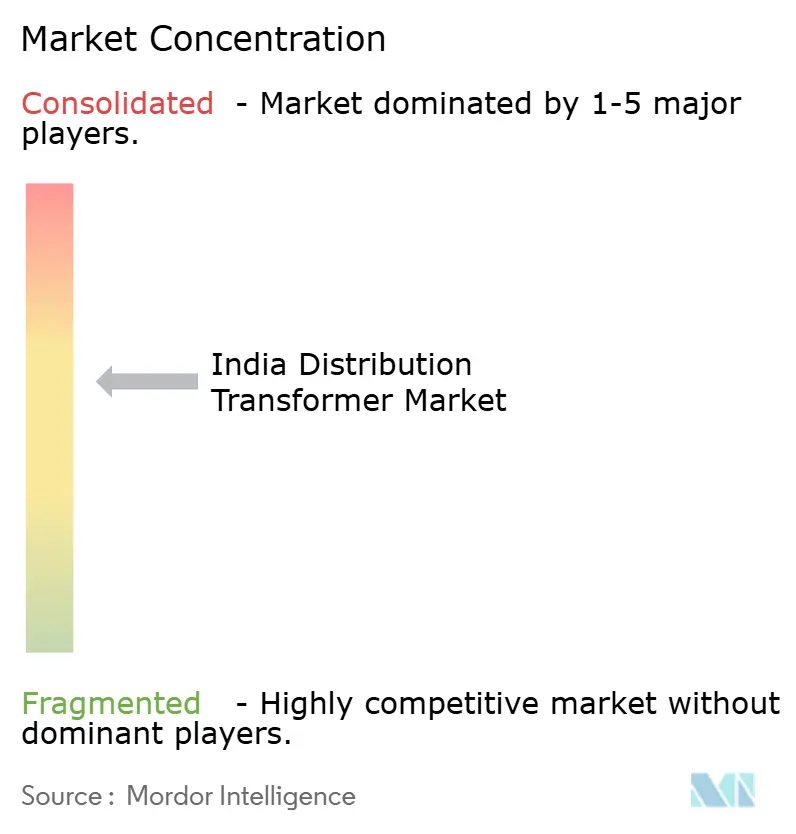
| Market Concentration | Medium |
Major Players *Disclaimer: Major Players sorted in no particular order Image © Mordor Intelligence. Reuse requires attribution under CC BY 4.0. | |
India Distribution Transformer Market Analysis by Mordor Intelligence
The India Distribution Transformer Market size is expected to grow from USD 1.8 billion in 2025 to USD 1.96 billion in 2026 and is forecast to reach USD 2.99 billion by 2031 at 8.86% CAGR over 2026-2031.
Robust investment under the Revamped Distribution Sector Scheme (RDSS) and a USD 9.1 trillion transmission and distribution (T&D) capital expenditure pipeline through 2032 form the structural base for sustained demand. Disbursements tied to loss-reduction metrics are accelerating transformer replacement cycles, while rooftop solar, electric vehicle (EV) charging, and green hydrogen pilots create premium niches for digitally enabled units. Medium transformers geared for utility-scale solar farms, air-cooled designs for urban nodes, and three-phase configurations for industrial corridors dominate order books, reflecting a shift toward higher-capacity, data-ready assets. Competitive dynamics favor suppliers that can localize core-loss materials, integrate digital monitoring into standard offerings, and meet the Bureau of Energy Efficiency (BEE) star-label rules taking effect in 2025.
Key Report Takeaways
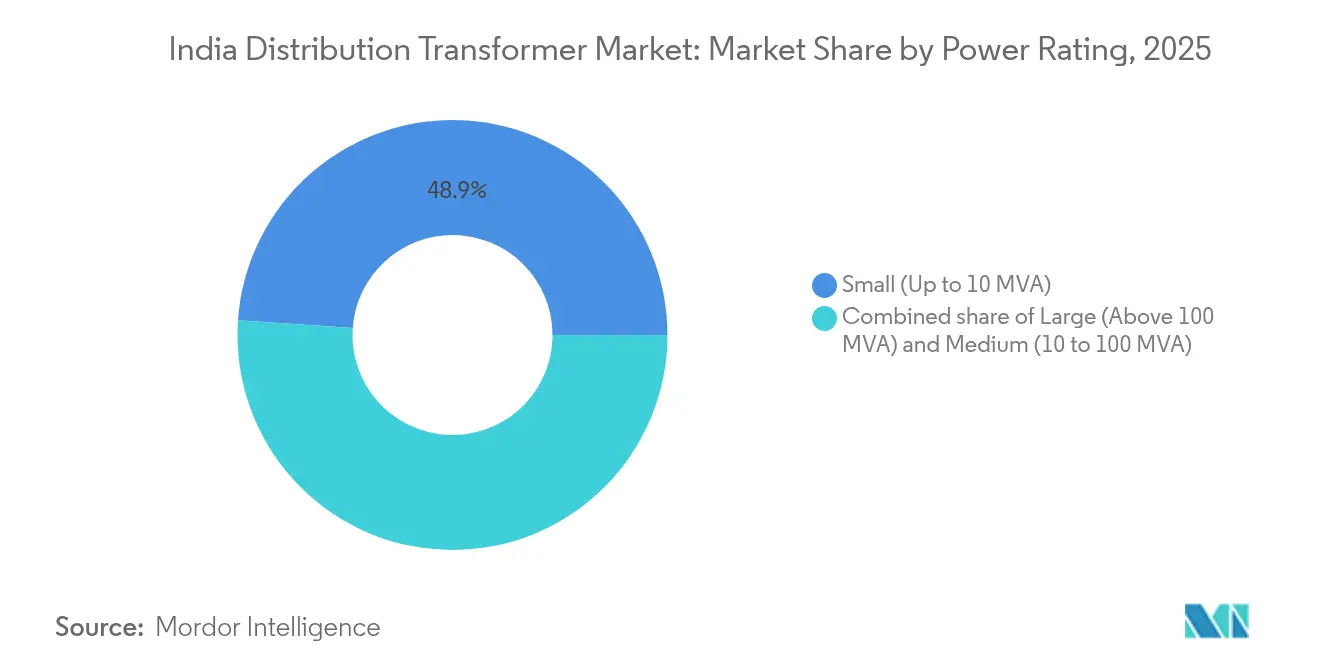
- By power rating, small transformers accounted for 48.90% of India's distribution transformer market share in 2025, while medium units are projected to grow at a 9.55% CAGR through 2031.
- By cooling type, oil-cooled equipment accounted for a 69.20% share of the India distribution transformers market size in 2025, and air-cooled variants are expected to register a 9.95% CAGR from 2025 to 2031.
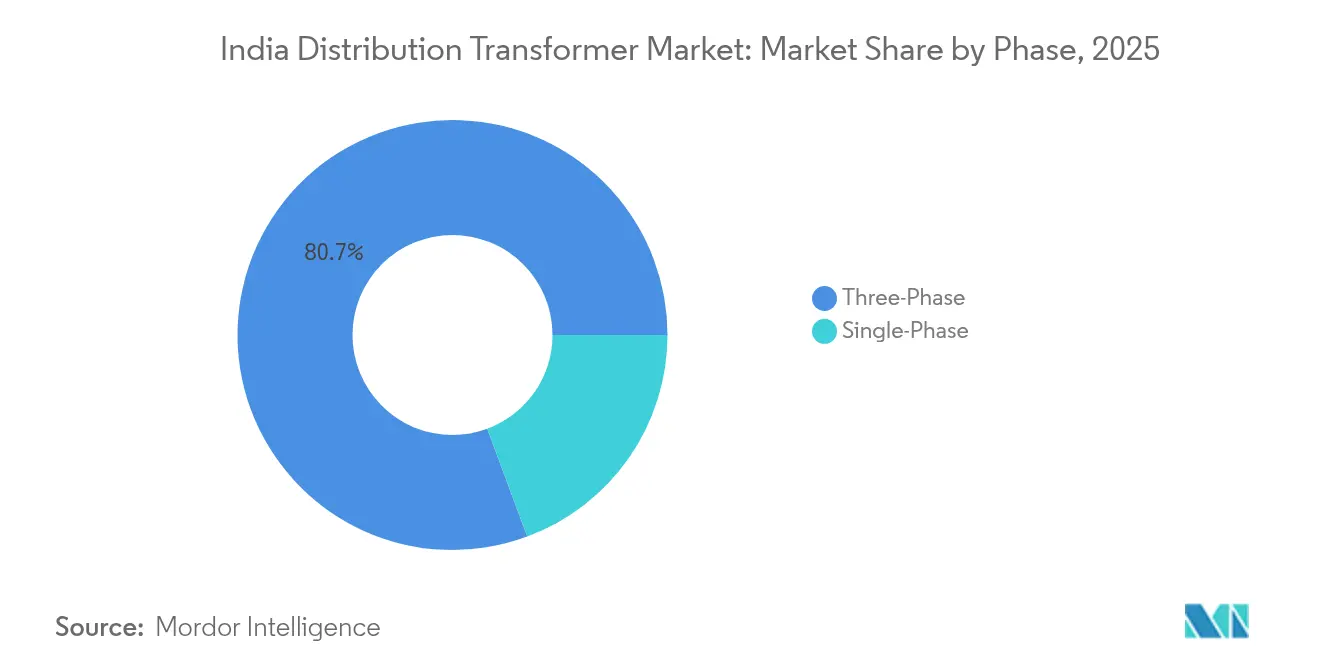
- By phase, three-phase equipment led the India distribution transformers market with an 80.65% share in 2025 and is forecasted to grow at a 9.05% CAGR.
- By end-user, the power utilities segmented led the market with 41.10% share in 2025, while industrial installations are expected to advance at a 10.15% CAGR between 2026 and 2031.
Note: Market size and forecast figures in this report are generated using Mordor Intelligence’s proprietary estimation framework, updated with the latest available data and insights as of 2026.
India Distribution Transformer Market Trends and Insights
Drivers Impact Analysis*
| Driver | (~) % Impact on CAGR Forecast | Geographic Relevance | Impact Timeline |
|---|---|---|---|
| RDSS grid-modernization grants | +2.10% | Uttar Pradesh, Bihar, Rajasthan, Madhya Pradesh | Medium term (2-4 years) |
| Rooftop-solar net-metering surge | +1.80% | Gujarat, Maharashtra, Karnataka, Tamil Nadu | Short term (≤2 years) |
| EV-charging corridor roll-outs | +1.50% | National highways and tier-1 metros | Medium term (2-4 years) |
| DISCOM loss-reduction capex | +1.90% | High-loss states such as Rajasthan and Uttar Pradesh | Long term (≥4 years) |
| Smart-meter deployment | +1.20% | Assam, Andhra Pradesh, Haryana pilots | Medium term (2-4 years) |
| Green-hydrogen micro-grid pilots | +0.80% | Rajasthan, Gujarat, Maharashtra | Long term (≥4 years) |
| Source: Mordor Intelligence | |||
Government RDSS Grid-Modernization Grants Drive Infrastructure Overhaul
The ₹3.03 lakh-crore RDSS program is India’s largest grid-upgrade plan and represents a direct catalyst for the India distribution transformers market.[1]Ministry of Power, “RDSS Progress Report 2024,” powermin.gov.in Utilities must replace aging units with higher-efficiency, smart transformers capable of supporting prepaid metering and real-time monitoring. Only 0.44 million of the 5 million sanctioned transformers had been installed by 2024, leaving a visible backlog that will sustain orders through at least 2027. The push to cut aggregate technical and commercial (AT&C) losses to 12-15% also forces utilities to accelerate replacements beyond normal asset life. Updated Central Electricity Authority (CEA) standards embed stricter short-circuit and overload criteria, effectively pulling demand forward and reinforcing the India distribution transformers market trajectory.
Rooftop-Solar Net-Metering Surge Strains Grid Capacity
Rooftop solar penetration passed 30% of feeder load in several urban clusters, prompting states such as Bihar to impose 80% capacity caps per distribution transformer.[2]Solar Power Portal, “Bihar Sets Rooftop Cap at 80% of DT Capacity,” solarpowerportal.co.uk Bidirectional power flows and voltage-rise issues necessitate upgrades to smart transformers with automatic tap-changer and reverse-power-flow protection. Utilities are therefore front-loading replacements in high-solar neighborhoods, establishing a premium segment within the India distribution transformers market. Suppliers winning these tenders integrate IoT sensors and advanced cooling to handle cyclical thermal stresses, demonstrating that net-metering growth is reshaping specification baselines.
EV-Charging Corridor Expansion Demands High-Capacity Infrastructure
The PM E-Drive goal of 72,000 public chargers by FY26 is driving specifications toward 150-350 kW compatible pad-mounted units that withstand frequent load peaks. Pilot corridors along the Delhi–Mumbai Expressway already require compact transformers with enhanced forced-air cooling and harmonic filtration. Transformer makers like BHEL and ABB India are bundling low-voltage switchgear and software, signaling that EV charging is creating an adjacent-systems pull that further deepens the India distribution transformers market revenue pool.
DISCOM Capex Push for Loss Reduction Accelerates Asset Replacement
Between FY25-32, state utilities plan USD 9.1 trillion in T&D investment, with transformer efficiency at the top of procurement scorecards. The Bureau of Energy Efficiency’s star-rating upgrade mandates tier-1 CRGO cores, which push higher raw-material costs but deliver lower lifecycle losses. High-loss states, such as Rajasthan, Uttar Pradesh, and Bihar, receive extra central allocations, resulting in faster turnover in the India distribution transformers market in these areas. Industrial corridors also benefit since higher grid reliability unlocks feeder-level capacity for manufacturing users.
Restraints Impact Analysis*
| Restraint | (~) % Impact on CAGR Forecast | Geographic Relevance | Impact Timeline |
|---|---|---|---|
| Copper & CRGO steel volatility | -1.40% | Nationwide import dependency | Short term (≤2 years) |
| DISCOM working-capital stress | -1.10% | Tamil Nadu, Rajasthan, Uttar Pradesh, Telangana | Medium term (2-4 years) |
| Urban land-use curbs | -0.60% | Delhi, Mumbai, Bangalore, Chennai | Short term (≤2 years) |
| Power-electronics skill shortage | -0.50% | Tier-2 manufacturing hubs | Long term (≥4 years) |
| Source: Mordor Intelligence | |||
Raw-Material Price Volatility Constrains Manufacturing Economics
India produces only 50,000 tonnes of CRGO steel, against an annual demand of 400,000 tonnes, leaving the supply chain vulnerable to import cycles and price fluctuations. CRGO prices doubled from 2020 to 2024, while copper rose by 40% during the same period.[3]Saur Energy, “India’s CRGO Steel Deficit Widens,” saurenergy.com Smaller suppliers in the India distribution transformers market face margin compression because they cannot hedge or bulk-import. BEE’s 2025 star-label raise intensifies grade requirements, limits substitute materials, and reinforces cost headwinds.
DISCOM Financial Stress Delays Procurement Cycles
State utilities accumulated INR 6.92 lakh crore in losses by FY24, while overdue payments to generators topped ₹529 billion in 2025. Cash-strapped boards delay tenders, stretch vendor payment cycles to beyond 180 days, and often split purchase orders to lower the upfront commitment. Vendors counter by demanding letters of credit, but that slows award-to-delivery timelines, diluting near-term revenue realization for the India distribution transformers market.
*Our forecasts treat driver/restraint impacts as directional, not additive. The impact forecasts reflect baseline growth, mix effects, and variable interactions.
Segment Analysis
By Power Rating: Medium Units Anchor Future Growth
Medium transformers captured a 9.55% CAGR momentum, outpacing small-rating replacements, even though the latter held 48.90% of India's distribution transformer market share in 2025. Utility-scale solar farms deploy 33-66 kV step-up units squarely in the medium band, and the Central Electricity Authority's connectivity code standardizes many projects around the 40 MVA class. Suppliers are integrating ester fluids and anti-corona windings to maximize reliability in desert heat, especially for Rajasthan's 13 GW solar tranche. The India distribution transformers market size for medium units is projected to expand to USD 0.49 billion between 2026 and 2031, as corporate power-purchase agreements accelerate the project pipeline. Small transformers remain the backbone of rural electrification, handling the growth in last-mile connections under Saubhagya's tail-end beneficiaries. Yet pricing pressure persists here, and manufacturers differentiate mainly via BEE star ratings.
The large-rating band, although niche, commands premium margins. Steel plants and urban mega-substations require bespoke 160-250 MVA units with forced oil-water cooling. Only six domestic suppliers currently hold 400 kV class approvals, making the segment concentrated. Growth is lumpy, tied to state transmission projects, but each tender's ticket size materially shifts quarterly revenue mix across the India distribution transformers market.



By Cooling Type: Air-Cooled Adoption Gains Traction
Oil-cooled units accounted for 69.20% of revenue in 2025, as they remain cost-efficient and mechanically robust. Nonetheless, air-cooled variants advanced at a 9.95% CAGR, propelled by fire-safety rules that discourage the use of mineral oil installations in high-rise clusters. Natural ester-fluid hybrids are bridging the gap by cutting fire point to over 300 °C, and CEA is considering separate loading curves for ester units. In Mumbai’s Coastal Road and Bengaluru’s Namma Metro projects, utilities mandated air-cooled transformers inside utility vaults with forced-air chimneys, crystallizing urban-infrastructure demand lanes.
Pad-mounted aluminum-wound air-cooled designs now dominate EV charging hubs; they simplify installation and meet the 45 dB noise cap enforced by city zoning boards. Suppliers are fast-tracking localized enclosures to meet India Steel Standards requirements, thereby raising domestic value addition and shielding against currency swings. The India distribution transformers market size for air-cooled units is forecast to increase by USD 0.41 billion by 2031, underscoring the growing urban preference.
By Phase: Three-Phase Dominance Continues
Three-phase equipment held an 80.65% share in 2025 and remains the default for industrial corridors, given balanced load and superior efficiency. The India distribution transformers market size for three-phase units is projected to exceed USD 2.41 billion by 2031, reflecting capacity expansions in the automotive, semiconductor, and data center verticals. Harmonic-filtering windings and split-core current transformers are becoming standard add-ons as sensitive manufacturing lines require stringent power quality.
Single-phase units sustain rural micro-grid growth. Yet their CAGR trails due to slower household connection increments and a rising preference for compact three-phase cluster transformers that serve multiple homes from a single pole. Vendors leverage this transition by promoting plug-and-play three-phase products with sealed oil tanks, which lower maintenance costs.
By End User: Industrial Uptick Leads Demand
Industrial users delivered the fastest adoption at 10.15% CAGR, fueled by production-linked incentive (PLI) programs in electronics and automotive. Every gigawatt-hour of battery manufacturing capacity requires roughly 12 MVA of clean, steady power, locking in transformer requirements well before plant commissioning. The India distribution transformers market sees cross-selling of harmonic suppressors and surge-arresters in these orders, lifting ancillary revenue.
Utilities remain the largest customer cohort, with a 41.10% share, but their procurement cycles are contingent on the release of central funds and state-level financial health. Commercial real-estate-driven loads, notably in Grade-A offices and shopping malls, are reviving post-pandemic, specifying compact, low-loss transformers, which creates a steady stream of mid-size orders. Residential demand persists but offers slimmer margins and slower spec-upgrade velocity.
Geography Analysis
Northern states lead volume growth because RDSS earmarks incremental funds for grids posting AT&C losses above 20%. Uttar Pradesh alone aims to install 400,000 new distribution transformers by FY30 to align its loss metrics with the national 15% target. Bihar and Rajasthan tag along, driven by rooftop solar caps forcing early transformer turnover. Western clusters in Gujarat and Maharashtra deliver premium, technology-rich orders; Gujarat’s rooftop solar share exceeds 37% of feeder load in key districts, compelling 11 kV feeders to adopt smart, voltage-regulating transformers. Southern states, such as Karnataka and Tamil Nadu, are integrating industrial corridors and EV manufacturing hubs that require three-phase, high-capacity pad-mounted units. Karnataka’s 2025 EV roadmap stipulates 350 kW public chargers every 25 km along highways, embedding transformer demand into transport-sector budgets. Eastern pockets, including West Bengal and Odisha, remain replacement-driven but are scaling up as coal-to-renewable transitions accelerate grid-code upgrades. Across all regions, CEA’s 2023 safety regulations harmonize technical standards, ensuring that the India distribution transformers market enjoys uniform baseline requirements even as funding mechanisms differ.
Regulatory Landscape
India’s distribution transformer market operates under a standards-and-compliance framework led by the Ministry of Power (MoP), Bureau of Indian Standards (BIS), Central Electricity Authority (CEA), and Bureau of Energy Efficiency (BEE). The Electrical Transformers (Quality Control) Order, 2015 restricts the manufacture and sale of non-BIS-marked transformers, anchoring market access to BIS certification, while BIS requirements such as IS 1180 (Part 1):2014 for oil-immersed distribution transformers (up to 2,500 kVA and 33 kV) set baseline design and testing expectations for most utility tenders.
Recent policy and standardization steps have tightened procurement and performance requirements further. In December 2025, the MoP issued an amendment mandating BIS certification and conformance to specified type-test parameters aligned to IS 2026 (Part 1):2011, reinforcing test rigor around electrical and loss characteristics. On May 14, 2026, the CEA, together with the All India Discoms Association (AIDA), released Standard Technical Specifications for CRGO core distribution transformers (Part I), supporting tender harmonization across DISCOMs and reducing variance in technical clauses that previously differed by state and utility.
Competitive Landscape
The India distribution transformers market remains moderately fragmented. Five suppliers combined hold roughly a 46% share, signaling room for consolidation. Global majors, such as Siemens Energy India and Schneider Electric, compete on digital platforms and turnkey packages, while domestic stalwarts like CG Power, BHEL, and Voltamp leverage their cost leadership and familiarity with state tenders. Order books stretch 12-18 months, revealing a seller’s market, yet raw-material exposure and DISCOM cash-flow uncertainties weigh on smaller vendors.
Strategic moves cluster around capacity scale-up and localization. CG Power’s ₹712 crore greenfield plant will add 45,000 MVA by FY28, bringing CRGO slitting and resin-casting in-house. Bharat Bijlee has committed ₹235 crore to lift Airoli output to 35,000 MVA and expand ester-fluid line deployment. Schneider Electric’s Vadodara factory added an IoT lab to embed EcoStruxure gateways into 11-33 kV units, tapping premium margins from smart-grid tenders. Supply-chain protection is achieved through long-term CRGO contracts with Japanese mills and by testing amorphous-core substitutes to offset price fluctuations. Talent acquisition programs in power electronics and cybersecurity signal a pivot to product-service hybrids.
White-space opportunities revolve around green-hydrogen sites, micro-substations using prefabricated vacuum-insulated switchgear, and export markets in Africa. Late entrants can carve share by offering financing partnerships to cash-strapped DISCOMs, bundling transformers with smart meters under energy-saving contracts.
India Distribution Transformer Industry Leaders
Mitsubishi Electric Corporation
CG Power and Industrial Solutions Ltd.
Hitachi Energy Ltd
Siemens Energy AG
Hyosung Heavy Industries
- *Disclaimer: Major Players sorted in no particular order

Market Opportunities and Future Outlook
Procurement harmonization and loss-reduction-linked funding are creating whitespace for suppliers that can standardize designs while still offering differentiated, data-ready features. The May 2026 CEA standard technical specifications for CRGO core distribution transformers, developed with industry bodies, support a more uniform national tendering environment and create room for scale manufacturing of compliant platforms. At the same time, the December 2025 MoP amendment reinforcing BIS marking and type-test parameters raises the premium on accredited testing, consistent quality, and traceable compliance.
Grid digitalization and distribution-capex programs are also pulling demand into adjacent transformer-focused offerings, including smart-grid integration, compact installations, and turnkey packages for utilities. Large modernization projects, including TSECL’s Agartala underground power distribution and the smart grid contract awarded to IRCON International in June 2026 (₹763.10 crore), point to more undergrounding, automation, and SCADA-linked assets, which typically increase demand for vault or pad-mounted distribution transformers with monitoring capabilities. Financing and private-sector participation expand the buyer set as well: IFC’s June 2026 announcement of up to USD 200 million to support Gemstar Infra’s 13.6 million smart meters in Rajasthan under RDSS supports metering-and-loss-reduction activity that often triggers DT replacement and feeder upgrades, and Eleven Power’s July 2026 proposal for a renewable-led parallel distribution network in Gurugram and Nuh (subject to HERC licensing) adds another buyer class that can specify higher-efficiency, digitally integrated DT fleets from the outset.
Recent Industry Developments
- July 2026: Eleven Power proposed a renewable-led parallel electricity distribution network investment of about Rs 4,700 crore for Gurugram and Nuh districts, subject to Haryana Electricity Regulatory Commission licensing. A new distribution licensee model expands the pool of potential DT buyers beyond incumbent DISCOMs and can accelerate adoption of higher-efficiency, monitoring-enabled units as part of new-build network architecture.
- June 2026: IRCON International received a Rs 763.10 crore contract from Tripura State Electricity Corporation Limited for an underground power distribution and smart grid project in Agartala. Undergrounding and smart-grid scope typically increase demand for compact, vault/pad-mounted distribution transformers and push specifications toward higher reliability and integration with control and protection systems.
- October 2024: CG Power expanded distribution transformer capacity to 9,900 MVA and announced a Rs 712 crore greenfield plant targeted to add 45,000 MVA by FY28. The capacity build-out supports shorter lead times for utility tenders and positions the company to address RDSS-driven replacement volumes that increasingly require tighter loss and quality compliance.


Research Methodology Framework and Report Scope
Market Definition and Coverage
For this methodology, the India distribution transformer market is defined as the revenue earned from distribution transformers supplied for Indian power distribution networks, across utility and end-customer installations, and counted at the equipment sale value.
Scope exclusions: We exclude transmission-grade power transformers, instrument transformers, and services such as installation, EPC, and long-term maintenance contracts.
Segmentation Overview
- By Power Rating
- Large (Above 100 MVA)
- Medium (10 to 100 MVA)
- Small (Up to 10 MVA)
- By Cooling Type
- Air-cooled
- Oil-cooled
- By Phase
- Single-Phase
- Three-Phase
- By End-User
- Power Utilities (includes, Renewables, Non-renewables, and T&D)
- Industrial
- Commercial
- Residential
Data Sources, Market Sizing, and Validation
Desk Research
Desk research was used to set the market boundary, build the demand drivers, and anchor assumptions that can be checked year over year. We relied on public sources that describe India grid additions and electrification progress, such as Ministry of Power publications, Central Electricity Authority statistics, and tenders and award notices published by utilities and government procurement portals.
To cross-check volumes and pricing direction, we also reviewed technical and policy references such as Bureau of Indian Standards notifications, Bureau of Energy Efficiency efficiency programs that influence transformer specs, and trade data releases from the Directorate General of Commercial Intelligence and Statistics where relevant. Company annual reports, investor presentations, and credible trade press were used to understand order pipelines, capacity additions, and raw material pass-through behavior. Where a clean split was not available in public filings, we used a paid subscription for company financials and a separate paid shipment-level trade database to validate import intensity and timing. The desk sources listed here are illustrative and not exhaustive, and many other public documents and filings were also reviewed for data collection, validation, and research clarification.
Primary Interviews and Surveys
Primary work focused on checking what the desk inputs miss, especially utility buying behavior, mix shifts by rating and phase, and realistic pricing movement. We spoke with stakeholders across utilities, industrial buyers, channel partners, and manufacturers, and we covered demand signals across major Indian regions so the model is not driven by one state or one procurement cycle.
Distribution of primary research fieldwork respondents
| Company type | Respondent position |
|---|---|
| Top tier: 34% | CXOs: 20% |
| Mid tier: 46% | Functional/Unit leaders: 34% |
| Smaller Players: 20% | Managers: 46% |
Market-Sizing & Forecasting
The market was sized using a top-down approach where India distribution network additions and replacement needs were reconstructed through utility capex signals, procurement activity, and grid expansion indicators, which were then converted into transformer demand. Once the demand pool was built, it was translated into value using mix-weighted pricing by typical rating bands and technology choices.
For sense checks, selective bottom-up approximations were run using supplier revenue splits, sampled tender pricing, and a volume times ASP build for a limited set of commonly procured specifications. Key inputs used in the model included: awarded and announced utility tenders for distribution transformers, replacement intensity linked to losses and aging network assets, shift between single-phase and three-phase demand, the mix between oil-cooled and air-cooled units, and raw material driven price movement that affects realized selling prices.
Forecasts were developed using scenario analysis because orders are strongly influenced by policy funding cycles and utility procurement timing. The forward view was then refined using interview feedback on tender cadence, delivery lead times, and expected efficiency-driven product upgrades. When data gaps appeared (for example, where smaller utilities do not publish consistent procurement detail), assumptions were filled using analog states and then adjusted back after expert validation.
Data Validation & Update Cycle
Model outputs were validated through multiple checks so totals stayed tied to real demand signals. We compared the implied volumes and prices against tender benchmarks, utility investment patterns, and observed shifts in transformer specifications, and then variances were investigated before sign-off.
Anomaly checks were run at the year level and across major rating and phase mixes to ensure the results did not jump without a clear driver. If a large variance was found versus recent tenders or interview feedback, respondents were re-contacted and assumptions were revisited, followed by an internal analyst review. Reports are refreshed annually, and interim updates are made when material events occur, such as policy funding changes, major tender waves, or sharp input-cost swings. Before delivery, a final pass is completed so clients receive the most current view available at that time.
Mordor Intelligence's India Distribution Transformer Market Sizing Compared With Other Published Estimates
Published market values for India transformers can look far apart because the scope is not always the same, and the year chosen for quoting can also differ. Some estimates blend nearby equipment categories, while others include services or count the value at a different point in the supply chain, which changes the final number.
The benchmark table shows a narrower value for distribution transformers because, in Mordor Intelligence's model, only distribution transformer equipment revenue in India is counted, and power transformers plus installation and maintenance services are excluded even when they sit in the same utility program.
Benchmark comparison
| Source | Market Size | Gaps in Research Methodology |
|---|---|---|
| Mordor Intelligence | USD 1.80 B (2025) | |
| Trade Journal A | USD 5.10 B (2024) | Uses a broader India transformer definition that includes instrument and specialty transformers along with distribution transformers, which increases the total even without changing country coverage. |
| Newswire Brief B | USD 4.50 B (2025) | Combines power transformers and distribution transformers into one line item, so the value reflects a blended mix and higher average pricing than a distribution-only equipment scope. |
Overall, the spread is mainly explained by category overlap and by whether services are bundled into the value reported. By tying demand to distribution-network procurement signals and then applying a mix-weighted price build by rating, phase, and cooling choice, our number remains traceable to practical inputs and is easier to refresh consistently.


Key Questions Answered in the Report
What is the current size of the India distribution transformers market and its 2026-2031 growth outlook?
The value stood at USD 1.96 billion in 2026 and is projected to reach USD 2.99 billion by 2031, reflecting an 8.86% CAGR.
Which power-rating segment shows the fastest expansion in India?
Medium transformers in the 10-100 MVA band are advancing at a 9.55% CAGR through 2031, outpacing other ratings.
How does the Revamped Distribution Sector Scheme affect transformer demand?
RDSS funds tied to AT&C loss reduction are accelerating replacement of aging units, with 5 million transformers sanctioned for metering upgrades.
Why are air-cooled designs gaining traction despite oil-cooled dominance?
Urban fire-safety rules and space limits are pushing air-cooled variants to a 9.95% CAGR, although oil-based units still account for 69.20% share.
In what way is EV charging infrastructure shaping transformer specifications?
Public fast-charging corridors require pad-mounted units that handle 150-350 kW peaks, driving demand for compact, high-capacity models.
What is the biggest raw-material challenge for Indian manufacturers?
Domestic output covers only 50,000 tonnes of CRGO steel against 400,000 tonnes demand, exposing suppliers to import-driven price swings.
Page last updated on:


 Your data is secure and never sold or shared.


