
Market Overview
| Study Period | 2021 - 2031 |
|---|---|
| Forecast Data Period | 2026 - 2031 |
| Historical Data Period | 2021 - 2024 |
| Growth Rate | 4.35 % |
| Market Concentration | Medium |
Major Players *Disclaimer: Major Players sorted in no particular order Image © Mordor Intelligence. Reuse requires attribution under CC BY 4.0. | |
Asia-Pacific Electrical Bushing Market Analysis by Mordor Intelligence
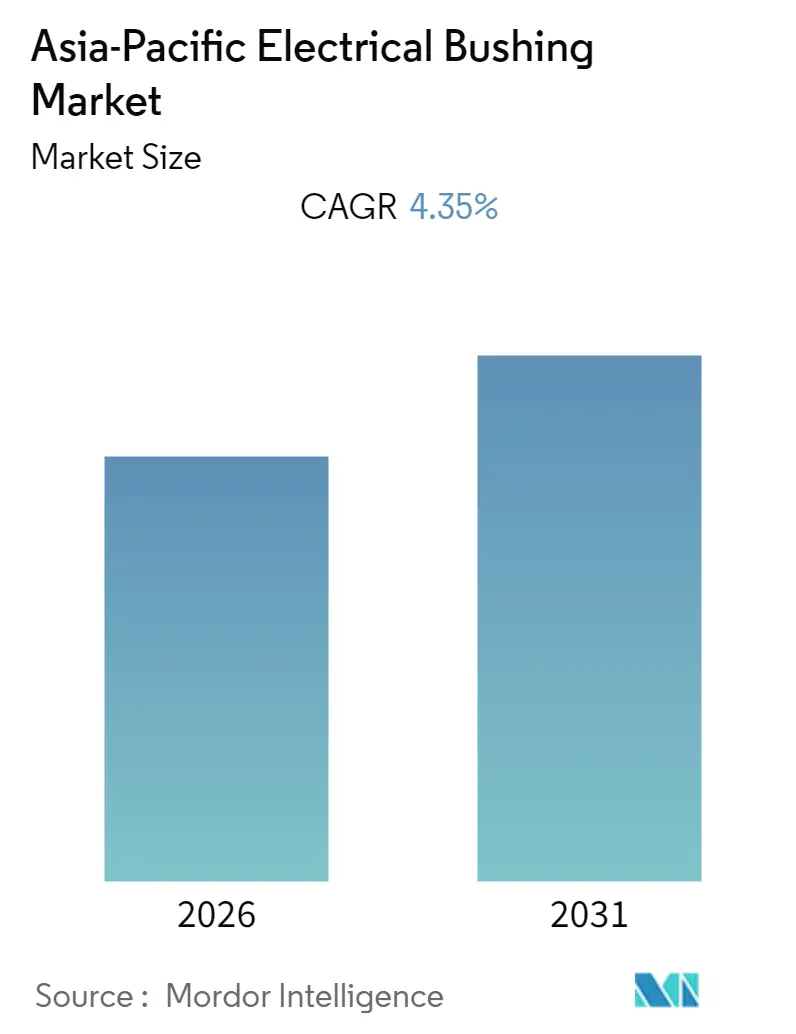
The Asia-Pacific Electrical Bushing Market size is expected to register a CAGR of greater than 4.35% during the forecast period.
The market was negatively impacted by COVID-19 in 2020. Presently, the market has reached pre-pandemic levels.
- Over the medium term, factors such as growing power demand and the expansion and upgradation of grid structure are expected to drive the electrical bushings market in the forecast period. Applications like railways and smart grids are anticipated to create a need for electrical bushings and drive the market further.
- On the flip side, electrical bushings are subjected to failure and can result in the loss of costly assets/equipment with long replacement times and cause issues related to personnel safety. Thus, untimely bushing failure can act as a restraint for the electrical bushing market.
- The world, especially Asia-Pacific, is moving towards renewable energy, which requires new transmission and distribution networks. With this, ample opportunities would be generated in the future for electrical bushing market players.
- India is expected to witness significant demand in the Asia-Pacific electrical bushing market during the forecast period.
Note: Market size and forecast figures in this report are generated using Mordor Intelligence’s proprietary estimation framework, updated with the latest available data and insights as of 2026.
Asia-Pacific Electrical Bushing Market Trends and Insights
Transformer Application to Witness Significant Growth
- Electrical bushings in transformers carry current at high voltage through equipment enclosures and provide an insulating barrier between the live conductor and the electrical apparatus's metallic (conducting) body.
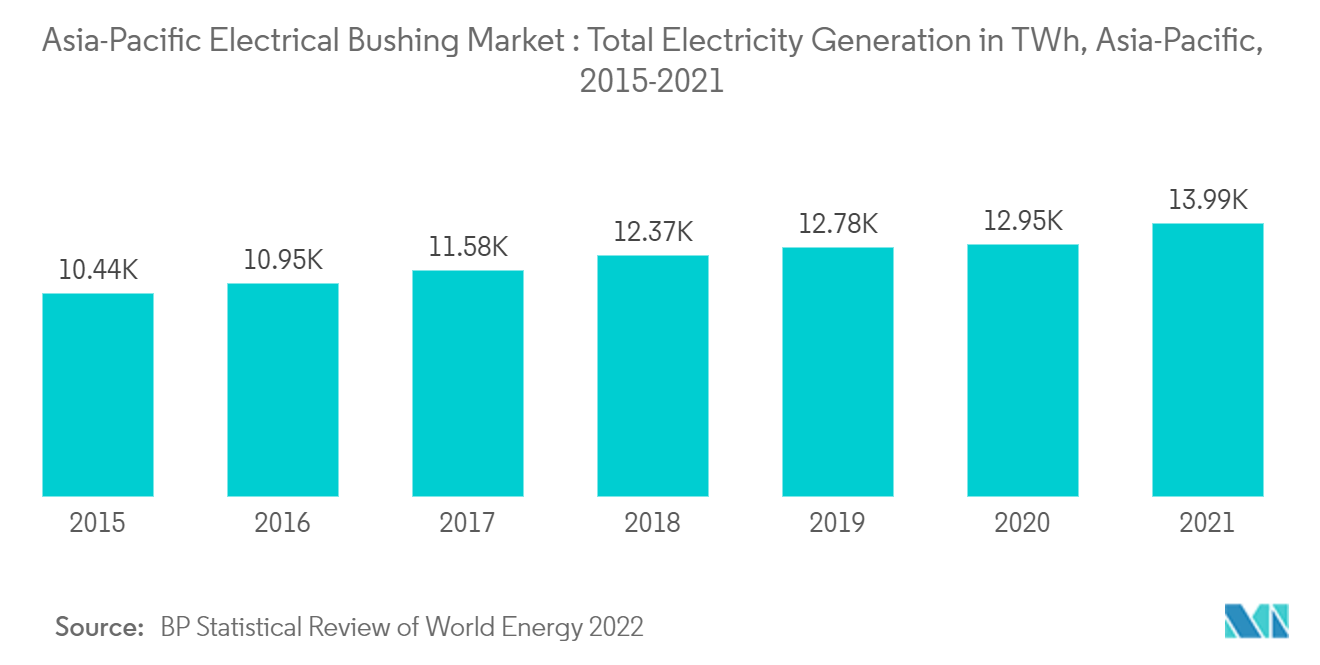
- According to BP Statistical Review of World Energy 2022, Asia-Pacific's electricity generation capacity in 2021 was 13,994.4 TWh (Terawatt hours), up from 12,949.3 TWh (an increase of about 8.4%) in 2020. In line with electricity generation capacity, the demand for transformers and electrical bushings has grown significantly.
- Additionally, increasing power infrastructure development in the region, especially in India, is expected to drive the segment's growth during the forecast period. For instance, in October 2022, Hitachi Energy India was awarded a contract by NTPC Renewable Energy to supply power transformers for its 4.75 GW renewable energy plant in Gujarat.
- Furthermore, in October 2021, Toshiba Energy Systems & Solutions Corporation announced that it had received an order for transformers and associated equipment for the urban-type underground substation owned by Eastern Green Power Pte Ltd, one of Singapore's EPC companies. Toshiba ESS will supply three 200 MVA transformers and four 75MVA transformers for the first 230-kV class urban-type underground substation in Southeast Asia, which will start operations after 2025.
- Therefore, with increasing power demand and projects to upgrade the grid structure, the Asia-Pacific's electrical bushings market is expected to witness significant growth in the transformers segment.
India to Witness Significant Growth
- India has significantly developed its power industry by expanding power transmission and distribution networks and including renewable technologies in its electricity generation mix.
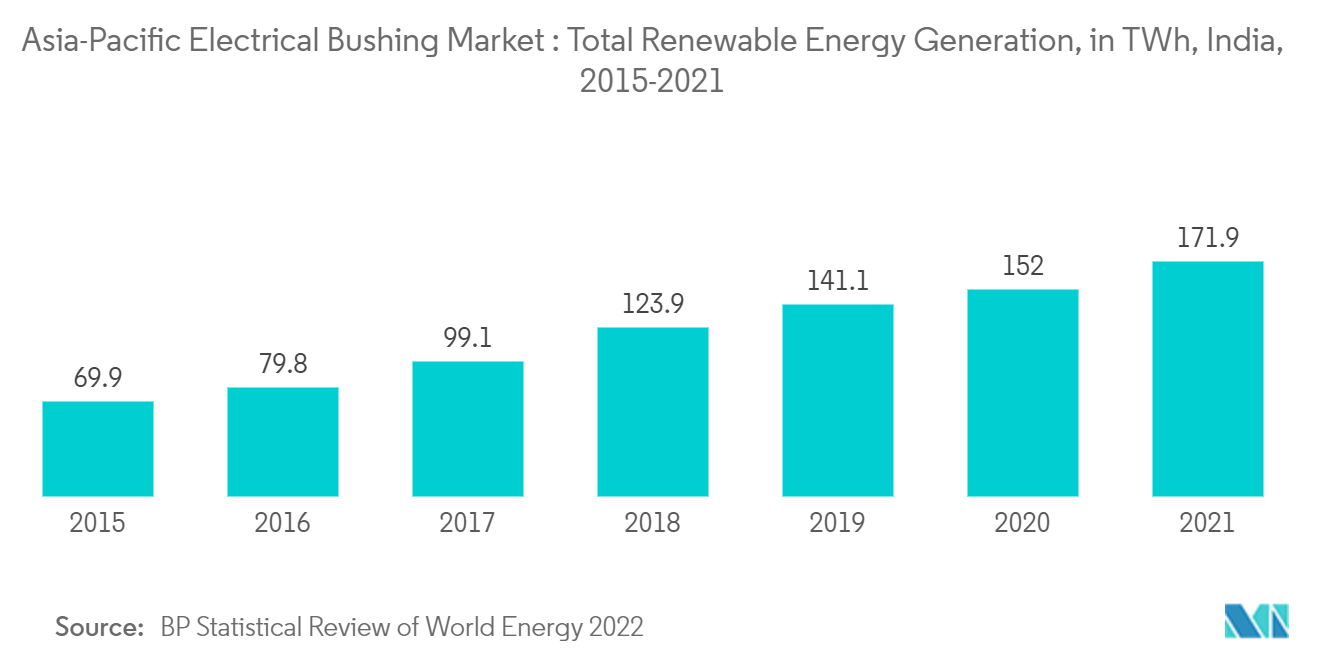
- According to BP Statistical Review of World Energy 2022, India, in 2021, reached 171.9 TWh (an increase of about 13.3% compared to the previous year's value) of renewable power generation capacity, creating demand for grid development, including transformers, switch gears, and others. This growth is expected to continue and will drive the need for electrical bushings.
- The transformer capacity growth in India has been continuous. As of 2021, India's total alternating current (AC) transformer capacity (at 220 kV and above) stood at 1,006,360 MVA (Mega Volt Ampere), and the high voltage direct current (HVDC) transformer capacity stood at 30,500 MW. The growth in transformer capacity is expected to drive the electrical bushings market in India, which, in turn, drives the market in the Asia-Pacific region.
- Furthermore, Hitachi Energy India Ltd., in May 2022, inaugurated its new transformer components factory in Vadodara, Gujarat. Located in its largest manufacturing location in India, this factory will produce dry bushings with the most reliable technology called 'Resin Impregnated Paper. This will be the first manufacturing facility in India to produce Resin Impregnated Paper bushings up to 400 kV voltage level. This dry technology improves transformer bushings' thermal, electrical, and mechanical performance, making them more resilient and reliable - critical in transformers deployed in the power grid. Such developments will likely positively impact India's electrical bushing market during the forecast period.
- Therefore, based on the above-mentioned factors, India is expected to witness significant growth in the Asia-Pacific's electrical bushing market during the forecast period.
Regulatory Landscape
Electrical bushings in Asia-Pacific are governed by a mix of national grid codes and product standards covering qualification testing, insulation performance, and documentation requirements for utility and industrial installations. In China, GB/T 4109-2022 sets requirements for insulated bushings for alternating voltages above 1,000 V, including material and dielectric testing, which shape supplier qualification and tender compliance.
Regulatory updates also track grid modernization as renewables and HVDC projects expand. Vietnam's Ministry of Industry and Trade issued Consolidated Document No. 15/VBHN-BCT in March 2026, establishing national technical standards for power grid systems effective June 1, 2026. In India, the Central Electricity Authority released the draft 2026 Grid Connectivity Regulations covering 33 kV and above grid-connected entities, including HVDC and energy storage, reinforcing specification-driven procurement.
Value Chain Analysis
The Asia-Pacific electrical bushing value chain runs from upstream inputs, such as copper or aluminum conductors, porcelain or composite housings, insulation systems including oil-impregnated and resin-impregnated papers, and epoxy resins, to manufacturing steps like core build-up, curing and impregnation, machining, sealing, and assembly. It then moves to type testing and certification aligned to country standards and utility specifications.
Midstream channels are shaped by transformer and switchgear OEM integration, along with direct supply routes for replacements and project spares where testing and documentation are critical due to the safety-critical nature of bushings. Downstream demand comes from transmission and distribution utilities, HVDC project developers, renewable-evacuation initiatives, and industrial electrification programs. India-localization efforts are visible through engineering and manufacturing footprints supporting high-voltage programs; GE Vernova handles local engineering and manufacturing for HVDC projects, and ABB expands electrification supply capabilities in India to support integrated packages for industrial projects. ABB India also operates a major facility in Nelamangala, Karnataka.
Competitive Landscape
The Asia-Pacific electrical bushing market is moderately fragmented in nature. Some of the major players in the market (in no particular order) include ABB Ltd., Siemens AG, Bharat Heavy Electricals Limited, Eaton Corporation PLC, and General Electric Company.
Asia-Pacific Electrical Bushing Industry Leaders
-
General Electric Company
-
ABB Ltd
-
Siemens AG
-
Eaton Corporation PLC
-
Bharat Heavy Electricals Limited
- *Disclaimer: Major Players sorted in no particular order

Market Opportunities and Future Outlook
Grid interconnection and large corridor transmission programs create opportunities for higher-voltage bushings, qualification testing services, and localized insulation systems. The Pan-Asia Power Grid Initiative launched by the Asian Development Bank in May 2026 targets USD 50 billion in investment by 2035 to connect regional power grids and integrate renewables, which increases demand for new substations, transformers, and switchgear where bushings are key components.
Manufacturing localization and product innovation are also extending opportunities for resin-impregnated and dry-type bushing technologies used for higher reliability and reduced fire-risk profiles in modern substations. Key 2026 anchors include GE Vernova's USD 93 million investment to expand manufacturing capacity for power transformers, reactors, and bushings in India, and ABB's USD 75 million investment in India during 2026 to expand manufacturing for critical segments and add testing capability, including a new high-power laboratory planned in Hyderabad. GE Vernova also secured an HVDC contract for Adani Energy Solutions' 2.5 GW Khavda-South Olpad corridor, and the Central Electricity Authority released the draft 2026 Grid Connectivity Regulations with a public comment deadline in August 2026, aligning procurement standards with stricter technical requirements.
Recent Industry Developments
- June 2026: Yash Highvoltage approved a preferential issue of equity shares and warrants worth approximately ₹1.51 billion to expand RIP bushing manufacturing capacity from 245 kV to 550 kV. The expansion improves domestic capacity and reduces import reliance, enabling higher HV bushing production in India.
- May 2026: Hitachi Energy launched two bushing innovations at CWIEME 2026 Berlin: AirRIP Flex Cable Termination Bushing CTB and AirRIP Flex AF 800 kV dry-type transformer bushing. The introduction of HV dry-type bushing innovations strengthens grid modernization and bushing product portfolio for APAC markets.
- May 2026: Yash Highvoltage announced expectations to begin trial production at its new greenfield transformer bushings factory in Vadodara, Gujarat, in the first half of FY27 (by September 2026). Trial production supports near-term capacity ramp for RIP bushings in India to meet domestic demand.
Research Methodology Framework and Report Scope
Market Definition and Coverage
This market covers revenue earned from electrical bushings sold across Asia-Pacific for use in power equipment, where the bushing provides insulated passage for a conductor through a grounded barrier. We count products used across common voltage classes and installation settings at the point of sale into the region.
Scope exclusions: We exclude unrelated insulation hardware and general connectors that do not function as an electrical bushing for transformer or switchgear interfaces.
Segmentation Overview
- Type
- Oil Impregnated Paper
- Resin Impregnated Paper
- Other Types
- Application
- Transformers
- Switchgears
- Other Applications
- Geography
- China
- India
- Japan
- Rest of Asia-Pacific
Data Sources, Market Sizing, and Validation
Desk Research
Desk work started with mapping how bushing demand is created in the region, which is mainly linked to transformer and switchgear builds, replacements, and grid additions. We relied on public power statistics and project pipelines from sources such as the International Energy Agency, national energy ministries and regulators, and utility planning documents, and then cross-checked trade movement using customs and UN Comtrade style series where applicable.
To keep the model grounded, we also reviewed standards and technical references that influence product selection, using sources such as IEC publications and publicly available engineering journals, followed by manufacturer catalogs, annual reports, and investor presentations for product mix cues. Where company-level numbers were needed but not fully disclosed, we used paid database subscriptions that cover company financials and intelligence, patents, and import export shipment-level information to fill gaps and sanity-check volumes and pricing. The desk sources listed here are illustrative only, and many other public documents and clarifications were used for data collection and cross-verification.
Primary Interviews and Surveys
Primary inputs were gathered through expert interviews and structured surveys with manufacturers, utilities, EPC voices, transformer and switchgear ecosystem participants, and service contacts across the region. We used these discussions to confirm demand drivers by country, understand typical replacement cycles, and align our price and mix assumptions with what is actually purchased in different voltage and application settings.
Distribution of primary research fieldwork respondents
| Company type | Respondent position |
|---|---|
| Top tier: 35% | CXOs: 15% |
| Mid tier: 49% | Functional/Unit leaders: 39% |
| Smaller Players: 16% | Managers: 46% |
Market-Sizing & Forecasting
We built the market using a top-down approach where power equipment demand signals were reconstructed into a bushing demand pool, and then converted into revenue using application-level mix and price points. Key inputs included transformer and switchgear installation activity, grid and substation expansion indicators, replacement and refurbishment cadence, country-level industrial power additions, and typical bushing counts per equipment set (validated through interviews and technical references).
Those totals were then corroborated with selective bottom-up approximations, such as rolling up a sample of supplier revenues tied to the region, and checking sampled ASP times estimated units for major application buckets. When a direct volume signal was missing for a smaller country, we used proxy indicators like electricity network capex direction and import patterns, which were then adjusted after follow-up calls. For forecasting, we used scenario analysis that links demand to power infrastructure spend, replacement cycles, and lead-time dynamics, and then stress-tested the outlook against expert expectations for 2026 to 2031.
Data Validation & Update Cycle
Validation was handled through stepwise checks, where we compared outputs against independent signals like power equipment build trends, utility procurement direction, and trade movement patterns, and then reviewed any variances that looked too large by country or application. If an anomaly was found, we revisited pricing, mix splits, or the implied unit intensity and re-contacted relevant respondents to confirm what changed.
Before sign-off, the model and assumptions pass through more than one analyst review so that arithmetic, conversions, and logic are consistent across the full time series. Reports are refreshed annually, and interim updates are made when material events occur, such as major grid policy shifts or notable supply disruptions. Right before delivery, we do a fresh scan of recent developments so the final numbers reflect the latest available information.
Mordor Intelligence's Asia Pacific Electrical Bushing Market Size Compared Against Other Published Estimates
Published market sizes for electrical bushings in Asia-Pacific can vary because the counted product set and the demand anchor are not always the same, even when the title looks similar. Differences also show up when some studies lean more on nameplate equipment shipments, while others tie demand to grid spending or replacement activity, which can move totals in either direction.
In practice, the spread is usually explained by whether resin-impregnated and oil-impregnated designs are both captured at the sold value, how switchgear versus transformer use is split, and how country coverage is treated inside Rest of Asia-Pacific. Some estimates also apply broad price growth or fixed exchange rates, while others refresh ASPs using recent tender pricing and supplier feedback, which then changes the current-year revenue line, a check documented under Mordor Intelligence.
Benchmark comparison
| Source | Market Size | Gaps in Research Methodology |
|---|---|---|
| Mordor Intelligence | USD 0.00 B (2024) | |
| Industry Association A | USD 0.00 B (2024) | Often reported as an equipment-insulation total that can bundle adjacent components and services, and may not separate bushing revenue linked specifically to transformer and switchgear interfaces across APAC countries. |
| Trade Journal B | USD 0.00 B (2025) | Typically extrapolates from global shipment trends with a single regional share and a simplified ASP uplift, which can miss country-level replacement cycles and the price mix gap between resin-impregnated and oil-impregnated products. |
Across these comparisons, the main takeaway is that scope and the price logic create most of the gap, more than the headline growth rate itself. By tying demand to equipment activity and replacement needs, and then pressure-testing pricing with recent market checks, our estimate stays traceable to clear inputs and can be reproduced with the same steps year after year.
Key Questions Answered in the Report
What is the current Asia-Pacific Electrical Bushing Market size?
The Asia-Pacific Electrical Bushing Market is projected to register a CAGR of 4.35% during the forecast period (2026-2031)
Who are the key players in Asia-Pacific Electrical Bushing Market?
General Electric Company, ABB Ltd, Siemens AG, Eaton Corporation PLC and Bharat Heavy Electricals Limited are the major companies operating in the Asia-Pacific Electrical Bushing Market.
What years does this Asia-Pacific Electrical Bushing Market cover?
The report covers the Asia-Pacific Electrical Bushing Market historical market size for years: 2020, 2021, 2022, 2023 and 2024. The report also forecasts the Asia-Pacific Electrical Bushing Market size for years: 2026, 2027, 2028, 2029, 2030 and 2031.