Market Overview
| Study Period | 2021 - 2031 |
|---|---|
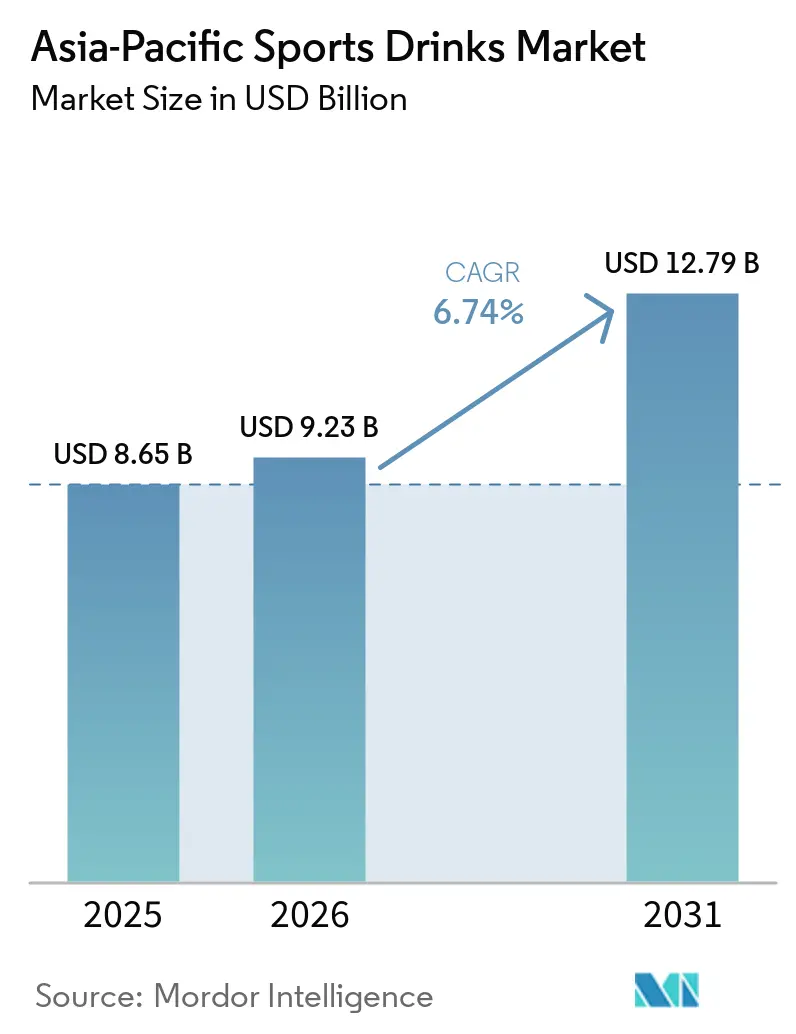
| Base Year Market Size (2025) | USD 8.65 Billion |
| Market Size (2026) | USD 9.23 Billion |
| Market Size (2031) | USD 12.79 Billion |
| Growth Rate (2026 - 2031) | 6.74% CAGR |
| Fastest Growing Market | Isotonic |
| Largest Market | China |
Major Players*Disclaimer: Major Players sorted in no particular order Image © Mordor Intelligence. Reuse requires attribution under CC BY 4.0. |
|
Asia-Pacific Sports Drinks Market Analysis by Mordor Intelligence
The Asia-Pacific sports drinks market size is expected to grow from USD 8.65 billion in 2025 to USD 9.23 billion in 2026 and is forecast to reach USD 12.79 billion by 2031 at 6.74% CAGR over 2026-2031. Governments are ramping up investments in public fitness infrastructure, leading to a surge in gym memberships from China to Indonesia. This trend reflects a growing emphasis on health and wellness across the region. Meanwhile, quick-commerce platforms are boosting product visibility by delivering chilled beverages in under 15 minutes, catering to the increasing demand for convenience among consumers. In response, brands are reformulating products to be sugar-free, countering the impact of rising sugar taxes and aligning with consumer preferences for healthier options. Additionally, they're introducing protein-fortified hypertonic drinks tailored for bodybuilding and recovery, addressing the needs of fitness enthusiasts and athletes. Retailers in tropical markets are increasingly favoring shelf-stable aseptic cartons and pouches, opting for ambient storage to cut energy costs while ensuring product longevity. As competition heats up, regional players are leveraging sports sponsorships and commitments to recyclable packaging to secure shelf space, challenging the dominance of multinationals and appealing to environmentally conscious consumers.
Key Report Takeaways
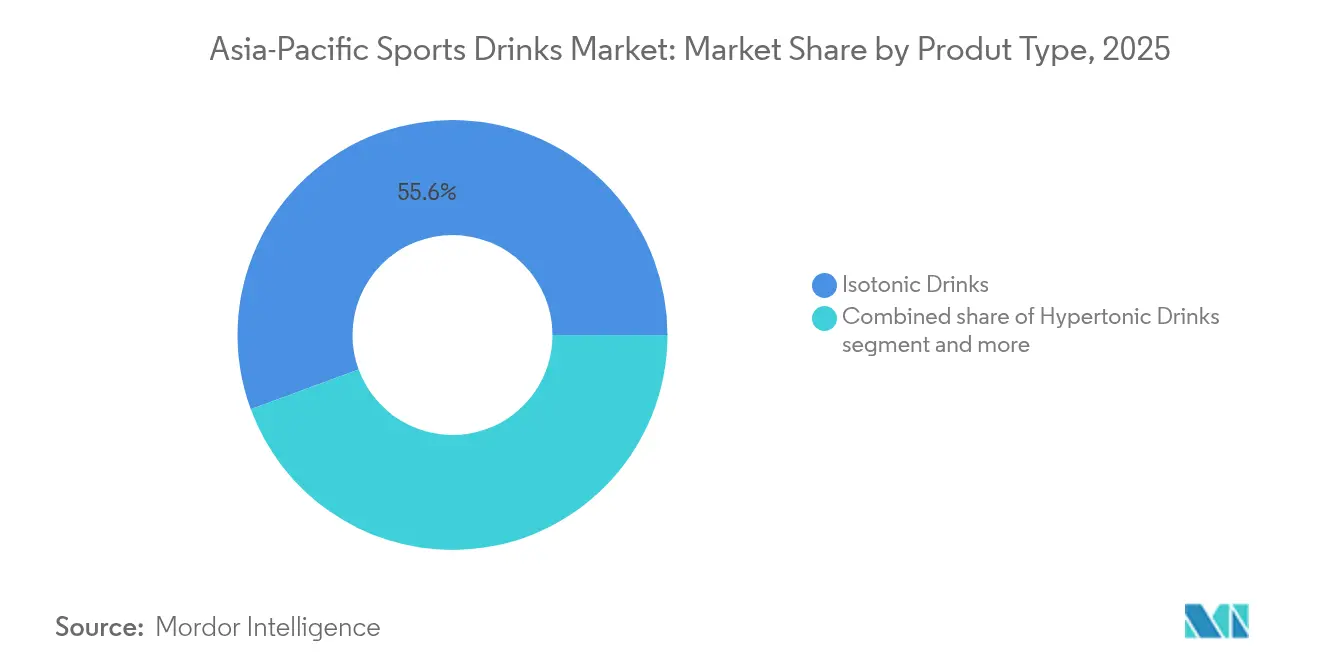
- Isotonic drinks held the largest 55.62% share of the Asia-Pacific sports drinks market in 2025, while hypertonic variants are forecast to expand at a 8.86% CAGR through 2031.
- PET bottles dominated with a 93.75% share in 2025; aseptic cartons and pouches are projected to grow at a 9.48% CAGR between 2026 and 2031.
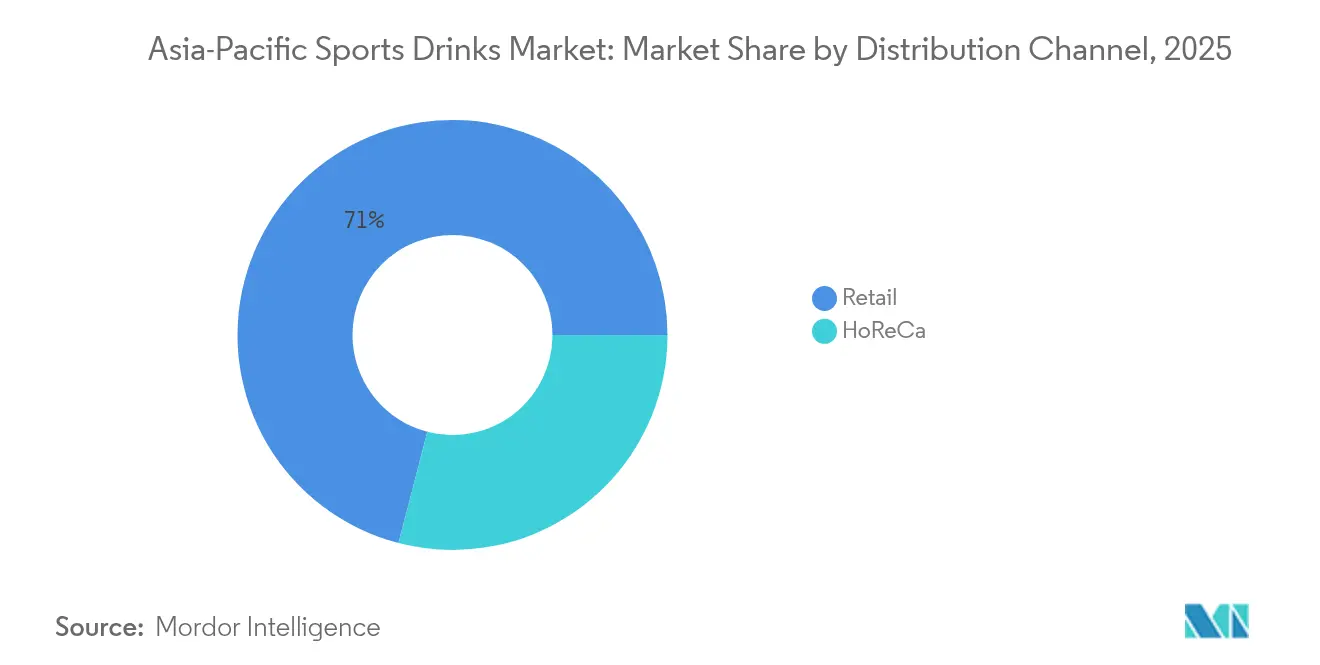
- Retail channels accounted for 70.96% of 2025 revenue, whereas HoReCa sales are set to rise at a 7.22% CAGR over the same outlook period.
- China led with 37.85% geographic share in 2025, yet Vietnam is poised to deliver the fastest 6.88% CAGR through 2031.
Note: Market size and forecast figures in this report are generated using Mordor Intelligence’s proprietary estimation framework, updated with the latest available data and insights as of 2026.
Asia-Pacific Sports Drinks Market Trends and Insights
Drivers Impact Analysis*
| Driver | (~) % Impact on CAGR Forecast | Geographic Relevance | Impact Timeline |
|---|---|---|---|
| Rising health and fitness consciousness | +1.8% | China, Japan, South Korea | Medium term (2-4 years) |
| Growing sports participation and government initiatives | +1.5% | China, India, Southeast Asia | Long term (≥ 4 years) |
| Rapid expansion of modern retail and e-commerce | +1.3% | India, Vietnam, Indonesia, Thailand | Short term (≤ 2 years) |
| Product innovation in functional formulations and flavors | +1.2% | Japan, South Korea, China | Medium term (2-4 years) |
| Surge in gamified hydration apps linking to beverage purchases | +0.4% | Urban centers: China, India, South Korea | Medium term (2-4 years) |
| Corporate wellness programmes bundling sports drinks | +0.5% | China, India, Singapore, Malaysia | Long term (≥ 4 years) |
| Source: Mordor Intelligence | |||


Rising health and fitness consciousness
Governments prioritize physical activity for public health, with China reporting a rise in regular exercisers from 360 million a decade ago to 550 million today. This significant increase highlights a growing awareness of the importance of fitness and well-being. This shift is turning routine hydration moments into opportunities for sports drink consumption, especially through digital wellness challenges that offer product coupons as rewards for mileage, encouraging healthier lifestyles. In Japan, the aging population is turning to ion-supply drinks like Pocari Sweat Ion Water, not just for athletic purposes but for their cognitive health benefits, showcasing a broader application of these beverages in addressing age-related health concerns[3]Source: Statistics Japan, "Population Estimates(2025 September Report", .stat.go.jp. In India, online sales of ready-to-drink beverages jumped 52% year-over-year in Q2 2024, driven by quick-commerce firms marketing chilled bottles as impulse buys, reflecting changing consumer preferences and the growing influence of e-commerce platforms. Meanwhile, in Thailand, beverage makers are enhancing isotonic drinks with claims of gut health and mood support, shifting the perception of sports drinks from niche performance enhancers to essential wellness tools, thereby expanding their appeal to a wider audience seeking functional health benefits.
Growing sports participation and government initiatives
By 2025, China's National Fitness Plan aims to allocate 2.89 square meters of sports venue per person and has introduced hydration kiosks in new facilities, effectively broadening sales points and encouraging greater public participation in fitness activities. In India, Bisleri's branding graces 74 matches of the Premier League cricket teams, a sponsorship that has boosted the company's revenue by 18.3% in FY24 while enhancing its visibility among millions of cricket fans. In Thailand and Vietnam, the rollout of convenience stores aligns with grassroots sports programs, ensuring products are available as new players finish their practice sessions, thereby fostering brand loyalty among young athletes. Cross-border policy forums, part of UNESCO’s Fit for Life platform, disseminate best practices on youth fitness, leading to uniform procurement standards for low-sugar sports drinks across the region and promoting healthier beverage options[1]Source: United Nations Educational, Scientific, and Cultural Organization, "Fit Life Asia-Pacific Promoting Healthy Lifestyles Through Sports and Physical Activity", unesco.org. By strategically aligning with public-sector events, brands not only secure exclusive pouring rights but also cultivate a preference among novice athletes, positioning themselves as integral to the sports ecosystem.
Rapid expansion of modern retail and e-commerce
In India, quick-commerce platforms dominate, managing 57% of online ready-to-drink orders and guaranteeing deliveries in under 15 minutes. This efficiency allows brands to sidestep traditional distributors, enabling faster market penetration and improved consumer reach. Thailand boasts over 13,000 outlets in its 7-Eleven network. These outlets strategically use ambient shelves for aseptic packs and chilled bays for PET, effectively segmenting the shopper journey based on pack type and ensuring product availability across diverse consumer preferences. Indonesia's chains, Indomaret and Alfamart, adopt a similar approach, enhancing last-mile cold-chain delivery to maintain product quality and freshness. Concurrently, direct-to-consumer portals like Bisleri@Doorstep not only boost profit margins but also gather first-party data, steering flavor innovations and enabling personalized marketing strategies. Such nimbleness in channels earns retailers prime eye-level placements, amplifying the prominence and accessibility of the Asia-Pacific sports drinks market.
Product innovation in functional formulations and flavors
Thai Beverages’ 100PLUS Pro combines high protein with hypertonic electrolytes, streamlining recovery nutrition into a single serving. This product caters to consumers seeking convenient solutions for post-exercise recovery, addressing both hydration and muscle repair needs. Coca-Cola’s BodyArmor Flash I.V. ensures swift hydration with tailored sodium-to-potassium ratios, targeting athletes and active individuals who require rapid electrolyte replenishment. Meanwhile, Gatorade Zero navigates India's 40% sugar tax by using sucralose and acesulfame potassium, offering a low-calorie alternative without compromising on taste, thus appealing to health-conscious consumers. Genki Forest taps into erythritol, catering to the zero-calorie trend without the baggage of artificial sweeteners, positioning itself as a healthier option in the competitive beverage market. PRIME Hydration, on the other hand, adds branched-chain amino acids to appeal to the e-sports demographic, addressing the specific nutritional needs of gamers who prioritize endurance and focus. Meanwhile, Japanese players are making subtle adjustments like vitamin B fortification and lower osmolarity to maintain their premium pricing in a saturated domestic market, ensuring they stay relevant to health-focused consumers while preserving their brand value.
Restraints Impact Analysis*
| Restraint | (~) % Impact on CAGR Forecast | Geographic Relevance | Impact Timeline |
|---|---|---|---|
| Increasing regulatory scrutiny on sugars and sweeteners | -0.9% | India, Thailand, Singapore, Malaysia, Philippines | Short term (≤ 2 years) |
| Competition from natural hydration alternatives | -0.6% | Southeast Asia, India (coconut water belt) | Medium term (2-4 years) |
| Environmental activism targeting single-use PET bottles | -0.5% | Thailand, India, Japan, Australia | Medium term (2-4 years) |
| Supply-chain volatility of mineral salts (e.g., KCl) | -0.3% | Global, supply-chain dependent manufacturers | Short term (≤ 2 years) |
| Source: Mordor Intelligence | |||
Increasing regulatory scrutiny on sugars and sweeteners
In India, a combined 28% GST and an additional 12% cess effectively inflate shelf prices by 40%[2]Source: World Health Organization, "WHO manual on Sugar-sweetened beverage taxation policies to promote healthy diets", who.int. This significant tax burden has created a two-tier market where only sugar-free variants can maintain their volume without resorting to steep discounts, as consumers increasingly seek affordable options. Meanwhile, Thailand's excise system incentivizes companies to reduce sugar content, imposing penalties of THB 0-5 per liter based on sugar levels. This regulatory push has driven 75% of ThaiBev's non-alcoholic offerings to align with "healthy" standards, reflecting a broader industry shift towards health-conscious products. In Malaysia, a levy of RM 0.50 on sugary beverages, coupled with Singapore's Nutri-Grade label that categorizes drinks based on sugar and saturated fat content, intensifies the urgency for reformulation to meet consumer and regulatory expectations. The Philippines adds another layer of complexity by taxing beverages differently based on the type of sweetener used, which complicates flavor planning and product development strategies across the region. Brands that hesitate to adapt to these evolving regulations and consumer preferences face risks of shrinking margins, reduced competitiveness, and less favorable shelf placements. However, those pivoting towards innovative solutions, such as stevia or erythritol blends, are not only mitigating fiscal challenges but also enhancing their market positioning and safeguarding their reputation in an increasingly health-conscious market.
Competition from natural hydration alternatives
In Southeast Asia's coconut belt, brands of coconut water tout "naturally occurring electrolytes" to attract health-conscious consumers. Here, easier access to raw materials helps keep production costs down. Meanwhile, reformulated teas, such as Korea's barley tea and China's chrysanthemum variants, are being marketed as post-exercise refreshers, challenging the exclusivity of traditional sports drinks. Nongfu Spring's foray into sugar-free teas illustrates how established water brands can utilize their logistical advantages to compete with conventional isotonic drinks. In a bid to reclaim authenticity, some sports drink brands have started incorporating 10% coconut water into their formulations. Additionally, electrolyte-infused bottled waters, like Pocari Sweat Ion Water, carve out a niche that ensures consumers remain loyal to their brand ecosystem.
*Our forecasts treat driver/restraint impacts as directional, not additive. The impact forecasts reflect baseline growth, mix effects, and variable interactions.
Segment Analysis
By Type: Isotonic Dominance Meets Hypertonic Disruption
In 2025, isotonic drinks dominated the Asia-Pacific sports drinks market, securing a 55.62% share. Their familiar 6–8% carbohydrate formulations cater to moderate-intensity exercise, solidifying their role in hydration for mass-participation sports and everyday fitness. This centrality ensures they remain pivotal in brand portfolios and retail assortments. While hypotonic and electrolyte-enhanced waters hold a smaller market share, their strategic importance is undeniable. In hot climates and high-sweat conditions, these drinks offer rapid fluid absorption. Looking ahead, isotonic drinks are set to maintain their baseline volume. However, brands are now infusing new ingredients like BCAAs, caffeine, and adaptogens, broadening their appeal beyond traditional workouts.
Hypertonic drinks are emerging as the fastest-growing segment, with a projected 8.86% CAGR. This growth outpaces the broader Asia-Pacific sports drinks market, driven by the rising popularity of strength and bodybuilding cultures in countries like China and South Korea. With their elevated carbohydrate content, hypertonic drinks are marketed as post-workout recovery solutions. They're increasingly merging with protein, leading to hybrid products like 100PLUS Pro that cater to both energy and recovery needs. This performance-centric approach not only positions hypertonic drinks as premium offerings but also allows them to tap into mainstream distribution channels. As the crossover of ingredients becomes more pronounced, hypertonic drinks are poised to capture a larger share of the market's value, especially among dedicated athletes and gym enthusiasts seeking richer nutritional benefits.


By Packaging Type: Aseptic Innovation Challenges PET Ubiquity
In 2025, PET bottles solidified their position as the leading packaging choice in the Asia-Pacific sports drinks market, commanding a substantial 93.75% share of the revenue. Their dominance stems from being lightweight, cost-effective, and seamlessly fitting into the existing cold-chain infrastructure. With a strong presence in both modern trade and convenience outlets, PET bottles play a pivotal role in volume strategies. This is especially true as brands commit to incorporating up to 50% recycled content by 2030. Yet, challenges loom: outside of Japan, inconsistent collection and recycling systems could lead to heightened compliance costs and extended producer-responsibility challenges in the future. Meanwhile, glass and metal containers, due to their weight and handling complexities, are expected to remain a niche choice, primarily in premium and on-premise settings.
Aseptic cartons and pouches are emerging as the fastest-growing packaging formats, projected to grow at a robust 9.48% CAGR. This surge is driven by rural and small-format retailers' preference for ambient-packaged sports drinks, which lessen the need for refrigeration and, subsequently, electricity costs. Such shelf-stable packaging is especially beneficial in regions with erratic power supply or steep energy tariffs, broadening distribution beyond urban locales. Moreover, investments in renewable and bio-based carton materials not only diminish carbon footprints but also bolster brand reputation. This is particularly relevant for corporate wellness and institutional tenders that are increasingly prioritizing sustainability metrics. As environmental concerns mount, both flexible and carton packaging are set to gain market share, even as PET bottles maintain their volume lead in the near future.
By Distribution Channel: Retail Fragmentation Meets HoReCa Recovery
In 2025, retail venues dominated the Asia-Pacific sports drinks market, accounting for 70.96% of total turnover. Brick-and-mortar outlets continued to lead in everyday hydration purchases. However, there's a noticeable shift: the market share is moving from large hypermarkets to convenience stores and dark warehouses. These newer outlets cater more effectively to on-the-go consumers and rapid deliveries. This trend is further bolstered by quick-commerce partnerships, especially in bustling urban centers like Indian metros. These collaborations facilitate deliveries in under 15 minutes, essentially bringing retail directly to consumers' doorsteps. Brands that adeptly position themselves in these emerging retail formats not only maintain their scale but also adjust to the evolving shopping behaviors.
While HoReCa (hotels, restaurants, cafés) currently represents a smaller segment, it's the fastest-growing channel. Projected to grow at a 7.22% CAGR, this surge is fueled by gym cafés, stadium kiosks, and corporate cafeterias promoting sports drinks as integral to wellness and performance. Exclusive pouring rights from national league stadium contracts bolster experiential marketing, weaving brands into fan traditions. Moreover, corporate and institutional environments are increasingly recognizing hydration as a facet of employee well-being. This perspective offers sports drink suppliers a consistent, contract-based volume opportunity. As the market evolves, players that seamlessly blend HoReCa growth with robust retail and quick-commerce strategies stand to dominate, capitalizing on multi-occasion consumption and outpacing competitors.
Geography Analysis
In 2025, China captured 37.85% of regional sales, driven by policy-led fitness adoption, widespread distribution of Pocari Sweat and Gatorade, and the rise of sugar-free brands like Genki Forest. The segment's growth now hinges on promoting usage in schools and municipal facilities, a push under the National Fitness Plan. These initiatives aim to integrate fitness into daily routines, creating a broader consumer base for sports and hydration beverages. Additionally, the increasing awareness of health and wellness among the population is expected to further support the demand for functional beverages in the country.
Vietnam, boasting a median age of 32.5 years and a surge in convenience stores, is set to be the fastest-growing market with a projected 6.88% CAGR. This growth is bolstered by Thai brands Carabao and Red Bull, which resonate with the nation's young urban workforce. The rapid expansion of convenience stores provides greater access to these products, aligning with the preferences of time-constrained consumers. In the India sports drink market, a 40% sugar tax mandates reformulation, yet sports sponsorships and direct-to-consumer logistics have propelled Bisleri's FY24 revenue up by 18.3%. The sugar tax has also driven innovation in low-sugar and sugar-free alternatives, catering to health-conscious consumers while maintaining market competitiveness. Meanwhile, Japan and South Korea, though mature markets, find lucrative prospects as ion-water products cater to older consumers wary of dehydration-related cognitive issues. These products address specific health concerns, making them highly appealing to aging populations in these countries.
Thailand solidifies its position as Southeast Asia's export hub, boasting USD 29.36 billion in beverage exports in 2023. Suntory PepsiCo's new lines further enhance regional supply, ensuring consistent availability across neighboring markets. Indonesia and Malaysia capitalize on their dense convenience-store networks and heightened demand during Ramadan, favoring aseptic packaging. The seasonal demand during Ramadan significantly boosts sales, particularly for beverages that align with cultural and religious practices. Australia, while smaller in scale, wields significant influence over environmental regulations, championing recycled-content adoption—a trend poised to spread northward. This geographic diversity underscores the need for customized pack mixes, sugar strategies, and pricing tiers, all attuned to local income levels and policy nuances. Tailored approaches are essential to address the unique consumer preferences and regulatory environments across these diverse markets.
Competitive Landscape
Competitive intensity remains moderate yet concentrated. Giants like PepsiCo, Coca-Cola, Otsuka, and Suntory capitalize on their scale in raw materials, distribution, and media buying. In contrast, regional players such as Genki Forest, Carabao, and Bisleri tap into local tastes, make quicker decisions, and forge sports partnerships to capture market share. Reformulation has emerged as a common defensive strategy: ThaiBev has reduced its sugar index by 30% since 2014, and PepsiCo introduced Gatorade Zero in response to India's tax policies. Sustainability in packaging is another key battleground; Suntory PepsiCo Thailand's transition to 100% rPET for 18 SKUs has cut down on 8,300 tonnes of virgin material, garnering both regulatory favor and procurement advantages. Lastly, sports-property activations like Bisleri's five-team IPL agreement and Aje Group's collaboration with Manchester City FC offer exclusive venue rights and heightened media visibility.
New entrants are reshaping formulas and distribution channels. PRIME Hydration targets e-sports enthusiasts with BCAA-enriched bottles sold on online platforms, while Genki Forest counters China's skepticism towards artificial sweeteners with its erythritol variant. Technological investments are amplifying performance disparities: Suntory PepsiCo employs AI for flavor development, and Bisleri's logistics system ensures dark-store replenishment in mere hours. Companies with recycling capabilities gain an advantage under Extended Producer Responsibility laws; notably, Japanese bottlers have achieved an 88% recovery rate for PET. These dynamics compel established players to diversify packaging, hasten sugar reductions, and engage niche consumer segments.
In the future, research and development will prioritize protein-infused hypertonic drinks, electrolyte-enhanced waters, and zero-sugar products. Collaborations with quick-commerce platforms like Zepto and Blinkit will be essential for urban market presence. Companies lacking robust plastic-waste strategies or genuine sports partnerships may find their shelf space diminishing, as both regulators and retailers increasingly value sustainability and community involvement.
Asia-Pacific Sports Drinks Industry Leaders
-
Otsuka Holdings Co Ltd
-
PepsiCo, Inc.
-
Suntory Holdings Limited
-
Thai Beverages PCL
-
The Coca-Cola Company
- *Disclaimer: Major Players sorted in no particular order

Recent Industry Developments
- July 2025: Evocus, renowned for its black alkaline water, has unveiled the Hydration IV Electrolytes Drink in India's burgeoning sports hydration market. This ready-to-drink (RTD) beverage, free from sugar and available in four enticing flavors - Blueberry, Tangerine, Cranberry, and Lime & Yuzu - is crafted for athletes and health enthusiasts, boasting essential electrolytes for optimal rehydration.
- April 2025: Prime, the hydration and energy drink co-created by Logan Paul and KSI, made its debut in India, launching on prominent online platforms like Amazon and Flipkart. The drink, rich in electrolytes, BCAAs, and coconut water, comes with the added appeal of zero sugar, making it a prime choice for fitness aficionados.
- February 2025: Spinner, a new sports hydration drink brand co-created by former Sri Lankan cricketer Muttiah Muralitharan, made its debut under the umbrella of Reliance Industries, India's largest conglomerate. This launch signifies Reliance's foray into the realm of functional beverages, specifically aiming at athletes and health-conscious consumers.
- February 2025: Coca-Cola, with plans to introduce its billion-dollar sports drink BodyArmorLyte in India, is set to feature electrolytes and coconut water in both carton and PET formats. Additionally, the beverage giant is expanding its offerings of Vitaminwater and Honest Tea, sourced from Assam.


Asia-Pacific Sports Drinks Market Report Scope
Electrolyte-Enhanced Water, Hypertonic, Hypotonic, Isotonic, Protein-based Sport Drinks are covered as segments by Soft Drink Type. Aseptic packages, Metal Can, PET Bottles are covered as segments by Packaging Type. Convenience Stores, Online Retail, Specialty Stores, Supermarket/Hypermarket, Others are covered as segments by Sub Distribution Channel. Australia, China, India, Indonesia, Japan, Malaysia, South Korea, Thailand, Vietnam are covered as segments by Country.
By Type
| Isotonic | |
| Hypertonic | |
| Hypotonic | |
| Electrolyte-Enhanced Water | Goat |
| Protein-based Sport Drinks | Sheep |
By Packaging Type
| PET Bottles |
| Glass Bottles |
| Metal Can |
| Aseptic packages (tetra pak, cartons, pouches) |
| Disposable Cups |
By Distribution Channel
| HoReCa | |
| Retail | Supermarkets/Hypermarkets |
| Convenience/Grocery Stores | |
| Online Retail Stores | |
| Other Distribution Channels |
Country
| Australia |
| China |
| India |
| Indonesia |
| Japan |
| Malaysia |
| South Korea |
| Thailand |
| Vietnam |
| Rest of Asia-Pacific |
| By Type | Isotonic | |
| Hypertonic | ||
| Hypotonic | ||
| Electrolyte-Enhanced Water | Goat | |
| Protein-based Sport Drinks | Sheep | |
| By Packaging Type | PET Bottles | |
| Glass Bottles | ||
| Metal Can | ||
| Aseptic packages (tetra pak, cartons, pouches) | ||
| Disposable Cups | ||
| By Distribution Channel | HoReCa | |
| Retail | Supermarkets/Hypermarkets | |
| Convenience/Grocery Stores | ||
| Online Retail Stores | ||
| Other Distribution Channels | ||
| Country | Australia | |
| China | ||
| India | ||
| Indonesia | ||
| Japan | ||
| Malaysia | ||
| South Korea | ||
| Thailand | ||
| Vietnam | ||
| Rest of Asia-Pacific | ||


Market Definition
- Carbonated Soft Drinks (CSDs) - Carbonated soft drinks (CSDs) refer to non-alcoholic beverages that are carbonated and typically flavored, containing dissolved carbon dioxide to create effervescence. These beverages commonly include cola, lemon-lime, orange, and various fruit-flavored sodas. Marketed in cans, bottles, or fountain dispense.
- Juices - We have considered packaged juices which encompass non-alcoholic beverages derived from fruits, vegetables, or a combination thereof, processed and sealed in various packaging formats such as bottles, cartons, or pouches. Excluding fresh juices, this market segment involves commercially prepared and preserved juices, often with added preservatives and flavors.
- Ready-to-Drink (RTD) Tea and RTD Coffee - Ready-to-Drink (RTD) tea and RTD coffee are pre-packaged, non-alcoholic beverages that are brewed and prepared for consumption without further dilution. RTD tea typically includes various tea varieties, infused with flavors and sweeteners, and comes in bottles, cans, or cartons. Similarly, RTD coffee involves pre-brewed coffee formulations, often mixed with milk, sugar, or flavorings, and is conveniently packaged for on-the-go consumption.
- Energy Drinks - Energy drinks are non-alcoholic beverages formulated to provide a quick boost of energy and alertness. Whereas, sports drinks are beverages designed to hydrate and replenish electrolytes, particularly after physical exertion, exercise, or intense activity
| Keyword | Definition |
|---|---|
| Carbonated Soft Drinks | Carbonated soft drinks (CSDs) are a combination of carbonated water and flavouring, sweetened by sugar or a non-sugar sweeteners. |
| Standard Cola | Standard Cola is defined as the original flavor of cola soda. |
| Diet Cola | A cola-based soft drink containing no or low amounts of sugar |
| Fruit Flavored Carbonates | A carbonated beverage prepared from fruit juice/fruit flavor with carbonated water and containing sugar, dextrose, invert sugar or liquid glucose either singly or in combination. It may contain peel oil and fruit essences. |
| Juice | Juice is a drink made from the extraction or pressing of the natural liquid contained in fruit and vegetables. |
| 100% Juice | Fruit/vegetable juice made from fruit in the form of its juice with no water added to make up the volume. It is not permitted to add sugars, sweeteners, preservatives, flavourings or colourings to fruit juice. |
| Juice Drinks (up to 24% Juice) | Fruit/vegetable juice drinks with up to 24% fruits/vegetable extract. |
| Nectars (25-99% Juice) | Juices that can have between 25 and 99% of fruit, with the minimum legal limits defined depending on the type of fruit |
| Juice concentrates | Juice Concentrates are those form of juices when most of this liquid is removed resulting in a thick, syrupy product known as juice concentrate. |
| RTD Coffee | Packaged coffee beverages that are sold in a prepared form and are ready for consumption at the time of purchase. |
| Iced Coffee | An iced coffee is a cold version of coffee, usually a combination of hot espresso and milk with ice added to it. |
| Cold Brew Coffee | Cold brew also called cold water extraction or cold pressing is made by steeping ground coffee in room-temperature water for several hours. |
| RTD Tea | Ready-to-drink (RTD) tea is a packaged tea product ready for immediate consumption without brewing or preparation |
| Iced Tea | Ice tea or iced tea is a drink made from tea without milk but with sugar and sometimes fruit flavourings, drunk cold. |
| Green Tea | Green tea is a tea beverage which promotes mental alertness, relieving digestive symptoms and promoting weight loss. |
| Herbal Tea | Herbal tea beverages are made from the infusion or decoction of herbs, spices, or other plant material in hot water. |
| Energy Drink | A type of drink containing stimulant compounds, usually caffeine, which is marketed as providing mental and physical stimulation. They may or may not be carbonated and may also contain sugar, other sweeteners, or herbal extracts, among numerous possible ingredients. |
| Sugar-free or Low-calories Energy Drinks | Sugar-free or Low-calories Energy Drinks are sugar-free, artificially sweetened energy drinks with few or no calories. |
| Traditional Energy Drink | Traditional Energy Drinks are functional soft drinks containing ingredients designed to boost the consumer's energy. |
| Natural/Oraganic Energy Drinks | Natural/Organic energy drinks are energy drinks free of artificial sweeteners and synthetic colorings. Instead, they contain naturally derived ingredients such as green tea, yerba mate, and botanical extracts. |
| Energy Shots | A small but highly concentrated energy drink that contains large amounts of caffeine and/or other stimulants. The quantity is comparatively smaller compared to energy drinks. |
| Sports Drink | Sports drinks are beverages designed specifically for the rapid supply of fluid, carbohydrates, and electrolytes before, during or after exercise. |
| Isotonic | Isotonic drinks contain similar concentrations of salt and sugar as in the human body, and are designed to quickly replace fluids lost during exercise but with an increase of carbohydrate. |
| Hypertonic | Hypertonic drinks have a higher concentration of salt and sugar than the human body. They are best drunk after exercise as it is important to replace glycogen levels quickly after exercise. |
| Hypotonic | Hypotonic drinks are designed to quickly replace fluids lost during exercise. They have very low carbohydrate content and a lower concentration of salt and sugar than the human body. |
| Electrolyte-Enhanced Water | Electrolyte water is water infused with electrically-charged minerals, such as sodium, potassium, calcium, and magnesium. |
| Protein-based Sport Drinks | Protein-based sports drinks are those sports drinks which has added protein in it that will improve performance and reduce muscle protein breakdown. |
| On-Trade | The on-trade refers to places that sell beverages for immediate consumption on the premises like bars, restaurants, and pubs |
| Off-Trade | Off-trade usually means places like liquor stores, supermarkets and other places where you don't consume the beverage right away. |
| Convenience Store | A retail business that provides the public with a convenient location to quickly purchase a wide variety of consumable products and services, generally food and gasoline. |
| Specialty store | A specialty store is a shop/store that carries a deep assortment of brands, styles, or models within a relatively narrow category of goods |
| Online Retail | Online retail is a type of eCommerce whereby a business sells goods or services directly to consumers from a website. |
| Aseptic Packaging | Aseptic packaging refers to the filling of a cold, commercially sterile product under sterile conditions into a presterilized container and closure under sterile conditions to form a seal that effectively excludes microorganisms. These includes tetra packs, cartons, pouches etc. |
| PET Bottle | PET bottle means a bottle made of polyethylene terephthalate. |
| Metal Cans | Metal containers made of aluminum or tin- plated or zinc-plated steel, which are commonly used for packaging food, beverages or other products. |
| Disposable Cups | Disposable Cup means a cup or other container designed for single use to serve beverages, such as water, cold drinks, hot drinks and alcoholic beverages. |
| Gen Z | A way of referring to the group of people who were born in the late 1990s and early 2000s. |
| Millenial | Anyone born between 1981 and 1996 (ages 23 to 38 in 2019) is considered a Millennial |
| Taurine | Taurine is an amino acid that supports immune health and nervous system function. |
| Bars & Pubs | It is a drinking establishment licensed to serve alcoholic drinks for consumption on the premises. |
| Café | It is a foodservice establishment serving refreshments (mainly coffee) and light meals. |
| On the go | It means doing / dealing with while busily engaged with something and not diverting plans in order to accommodate. |
| Internet Penetration | The Internet Penetration Rate corresponds to the percentage of the total population of a given country or region that uses the Internet. |
| Vending Machine | A machine that dispenses small articles such as food, drinks, or cigarettes when a coin or token is inserted |
| Discount store | A discount store or discounter offers a retail format in which products are sold at prices that are in principle lower than an actual or supposed "full retail price". Discounters rely on bulk purchasing and efficient distribution to keep down costs. |
| Clean Label | Clean label on the beverage market are drinks that are made from few ingredients of natural origin and are not or only slightly processed. |
| Caffeine | An alkaloid compound which is a stimulant of the central nervous system. It is mainly used recreationally, as a mild cognitive enhancer to increase alertness and attentional performance. |
| Extreme sport | Action sports, adventure sports or extreme sports are activities perceived as involving a high degree of risk. |
| High-intensity interval training | It incorporates several rounds that alternate between several minutes of high intensity movements to significantly increase the heart rate to at least 80% of one's maximum heart rate, followed by short periods of lower intensity movements. |
| Shelf life | The length of time for which an item remains usable, fit for consumption, or saleable. |
| Cream Soda | Cream soda is a sweet soft drink. Generally flavored with vanilla and based on the taste of an ice cream float |
| Root Beer | Root beer is a sweet North American soft drink traditionally made using the root bark of the sassafras tree Sassafras albidum or the vine of Smilax ornata as the primary flavor. Root beer is typically, but not exclusively, non-alcoholic, caffeine-free, sweet, and carbonated. |
| Vanilla Soda | A carbonated soft drink flavoured with vanilla. |
| Dairy-Free | A product that does not contain any milk or milk products from cows, sheep or goats. |
| Caffeine-Free Energy Drinks | Caffeine-free energy drinks rely on other ingredients to boost the energy. Popular choices include amino acids, B vitamins, and electrolytes. |


Research Methodology
Mordor Intelligence follows a four-step methodology in all our reports.
- Step-1: IDENTIFY KEY VARIABLES: In order to build a robust forecasting methodology, the variables and factors identified in Step 1 are tested against available historical market numbers. Through an iterative process, the variables required for market forecast are set, and the model is built on the basis of these variables.
- Step-2: Build a Market Model: Market-size estimations for the forecast years are in nominal terms. Inflation is not a part of the pricing, and the average selling price (ASP) is kept constant throughout the forecast period for each country.
- Step-3: Validate and Finalize: In this important step, all market numbers, variables, and analyst calls are validated through an extensive network of primary research experts from the market studied. The respondents are selected across levels and functions to generate a holistic picture of the market studied.
- Step-4: Research Outputs: Syndicated reports, custom consulting assignments, databases & subscription platforms


