Market Overview
| Study Period | 2021 - 2031 |
|---|---|
| Forecast Data Period | 2026 - 2031 |
| Historical Data Period | 2021 - 2024 |
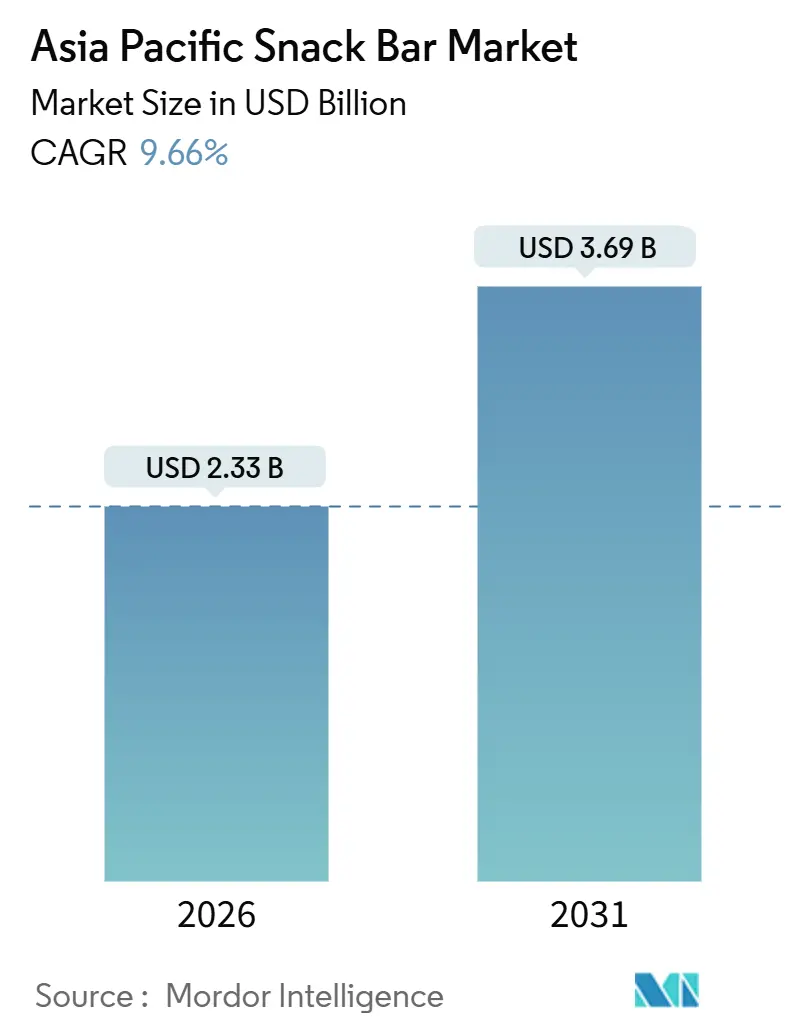
| Market Size (2026) | USD 2.33 Billion |
| Market Size (2031) | USD 3.69 Billion |
| Growth Rate (2026 - 2031) | 9.66% CAGR |
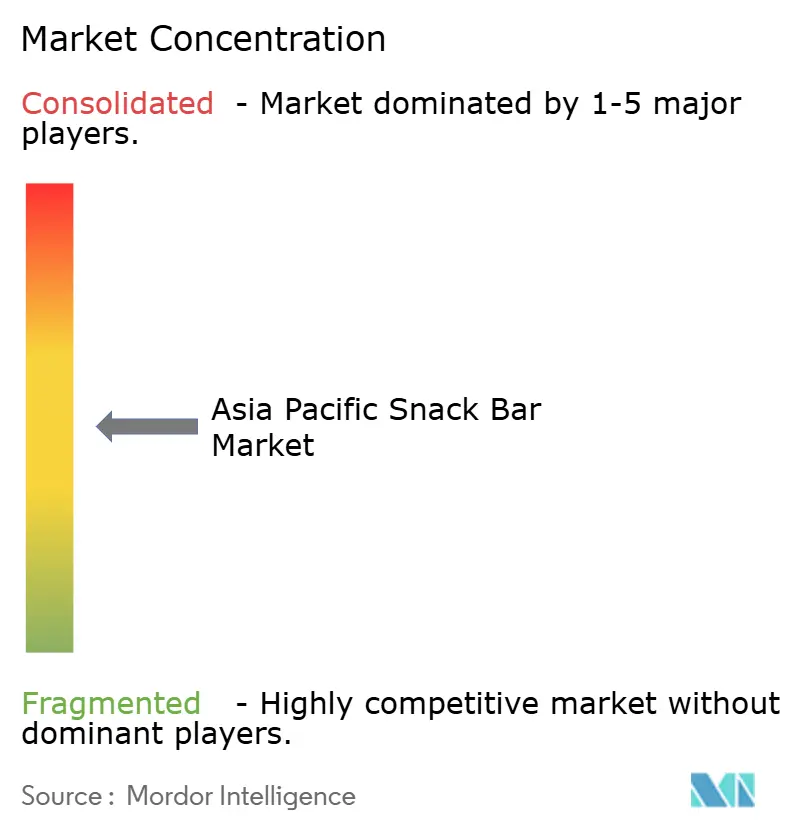
| Market Concentration | Medium |
Major Players
*Disclaimer: Major Players sorted in no particular order Image © Mordor Intelligence. Reuse requires attribution under CC BY 4.0. |
|
Asia Pacific Snack Bar Market Analysis by Mordor Intelligence
The Asia-Pacific snack bars market is projected to grow from USD 2.33 billion in 2026 to USD 3.69 billion by 2031, registering a robust CAGR of 9.66%. This growth reflects the region's increasing shift toward convenient, nutrition-focused snacking. The market expansion is driven by busier lifestyles and a growing preference for on-the-go foods that align with work, commuting, travel, and active routines without requiring preparation. Additionally, rising health consciousness among consumers is boosting demand for snacks that promote better energy management, controlled eating habits, and balanced nutrition. This trend is driving the popularity of snack bars emphasizing high protein content, functional benefits, and portion control. Furthermore, ongoing innovation in taste, format, and product positioning is broadening the appeal of snack bars, extending their consumption beyond niche fitness users to mainstream daily use.
Key Report Takeaways
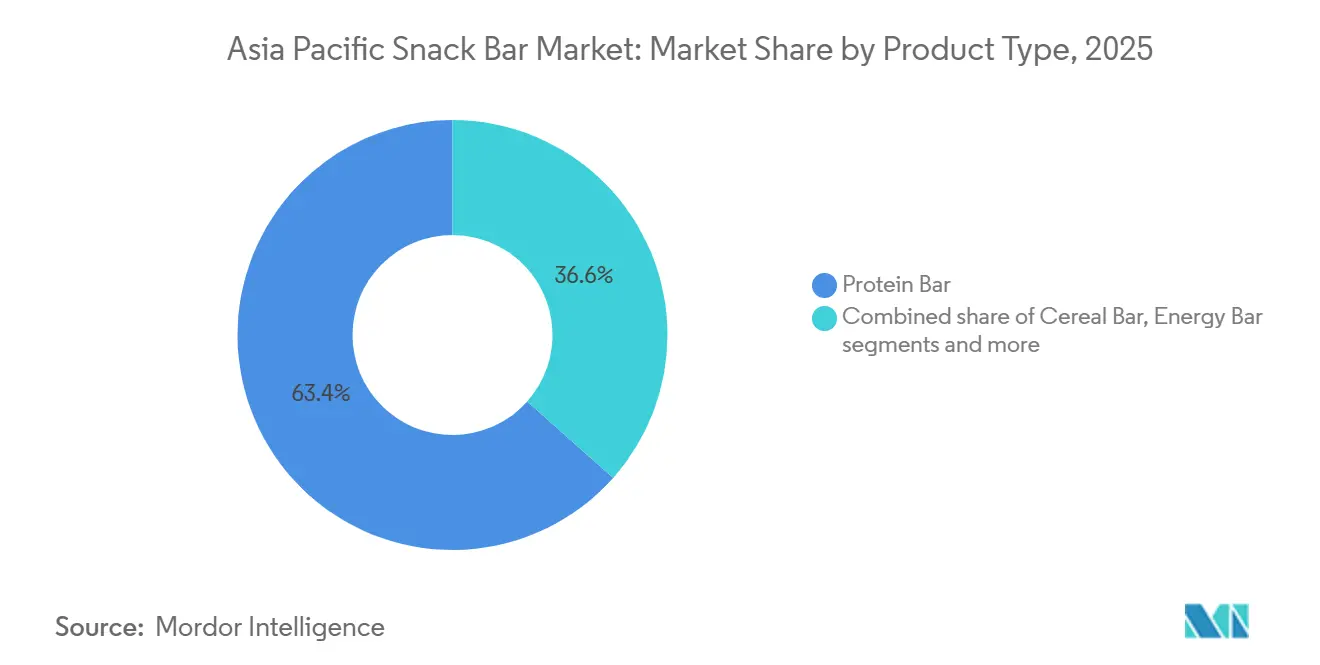
- By product type, protein bars led with 63.43% revenue in 2025; energy bars are forecast to expand at an 11.99% CAGR through 2031.
- By ingredient base, nut-based variants captured 31.35% of 2025 sales, while granola and oat bars are advancing at a 10.43% CAGR to 2031.
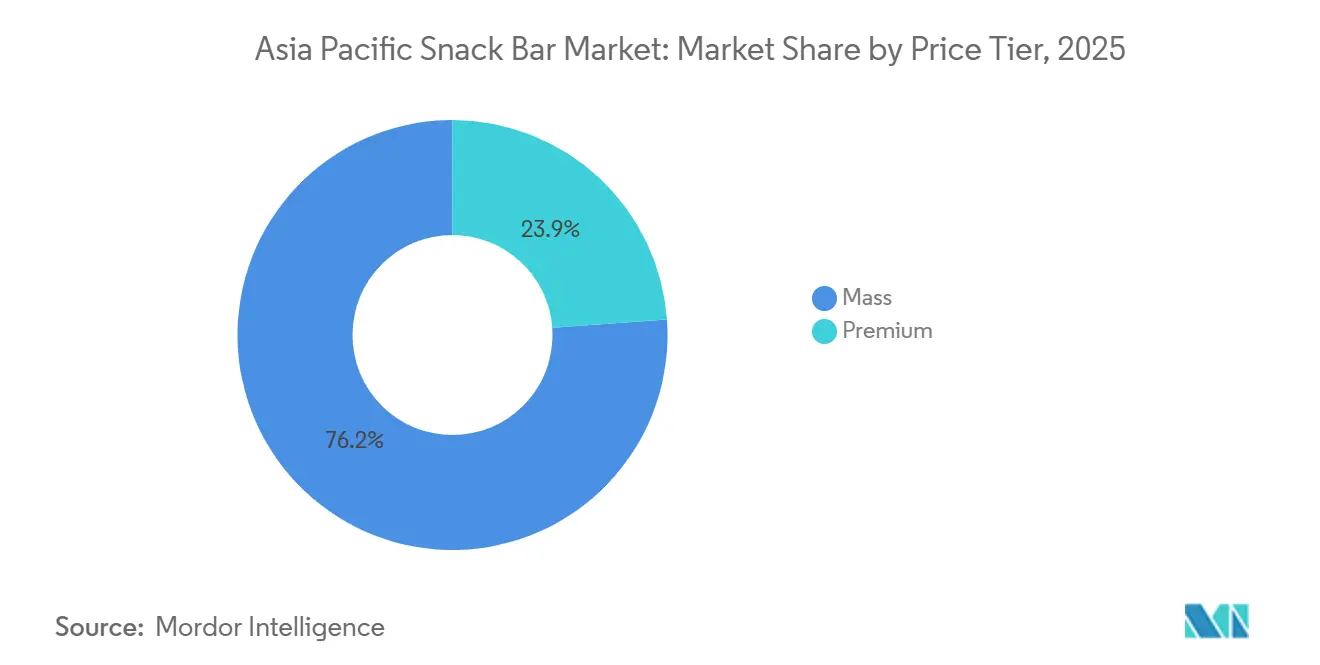
- By price tier, mass products held 76.15% of the Asia-Pacific snack bars market size in 2025, whereas premium offerings are rising at an 11.43% CAGR through 2031.
- By distribution channel, supermarkets and hypermarkets accounted for 59.11% of 2025 revenues, while online retail stores are growing at a 12.36% CAGR to 2031.
- By geography, Japan commanded 36.46% of the Asia-Pacific snack bars market share in 2025, whereas India is set to record the fastest 11.76% CAGR through 2031.
Note: Market size and forecast figures in this report are generated using Mordor Intelligence’s proprietary estimation framework, updated with the latest available data and insights as of January 2026.
Asia Pacific Snack Bar Market Trends and Insights
Drivers Impact Analysis*
| Driver | (~) % Impact on CAGR Forecast | Geographic Relevance | Impact Timeline |
|---|---|---|---|
| Rising fitness participation boosting demand for snack bars | +2.1% | India, China, Australia, with spillover to Southeast Asia | Medium term (2-4 years) |
| Rising health and wellness awareness | +2.3% | Global, strongest in Japan, Australia, Singapore | Long term (≥ 4 years) |
| Growing preference for on-the-go nutrition | +1.9% | Urban centers across China, India, Indonesia, Thailand | Short term (≤ 2 years) |
| Increasing focus on weight management and portion control | +1.7% | Japan, South Korea, Australia, urban India | Medium term (2-4 years) |
| Rising popularity of plant-based and vegan snacking | +1.5% | Singapore, Australia, urban China and India | Long term (≥ 4 years) |
| Innovation in flavors suited to local tastes | +1.3% | Indonesia, Thailand, India, China | Short term (≤ 2 years) |
| Source: Mordor Intelligence | |||


Rising fitness participation is boosting demand for snack bars
Increasing fitness participation is driving the demand for snack bars, as more consumers across the Asia-Pacific region incorporate structured exercise, sports routines, and active lifestyles into their daily activities. This trend has heightened the need for convenient nutrition that supports energy, endurance, and recovery. Snack bars are increasingly recognized as a practical option for pre-workout fueling, post-workout recovery, and on-the-go protein intake. They are particularly popular among gym-goers, runners, cyclists, and individuals engaged in recreational sports, who require portable and time-efficient solutions. This shift is also fueling demand for high-protein and functional snack bar variants that align with performance goals, offering controlled portions and easy consumption without the need for preparation. For example, according to the Australian Sports Commission’s (ASC) New Participation Picture Report – 2025 survey, over 11 million Australian adults participated in sport-related activities, highlighting a growing consumer base likely to purchase nutrition-focused products like snack bars as part of their active lifestyles [1]Source: Australian Sports Commission’s (ASC), "Australians are redefining the way they play", ausport.gov.au.
Rising health and wellness awareness
Increasing health and wellness awareness is a significant driver for the Asia-Pacific snack bars market, as consumers increasingly focus on preventive health, balanced nutrition, and healthier food choices over traditional high-sugar or fried snacks. Snack bars are gaining popularity as they are widely regarded as a convenient, healthier alternative that supports improved energy levels, better weight management, and more disciplined eating habits. Growing awareness of issues such as excessive sugar consumption, low dietary fiber, and lifestyle-related health concerns is prompting consumers to seek products with high protein content, added fiber, reduced sugar, and clean-label formulations. This shift is encouraging brands to enhance their nutritional credibility, ingredient transparency, and product innovation to meet evolving consumer demands. Additionally, this wellness-focused mindset is broadening the appeal of snack bars beyond fitness enthusiasts to include mainstream consumption occasions, such as mid-morning snacks, meal replacements, healthier office snacking, and on-the-go convenience. This trend is driving both initial trials and repeat purchases across the region, further solidifying the market's growth potential.
Growing preference for on-the-go nutrition
The growing preference for on-the-go nutrition is a significant driver of the Asia-Pacific snack bars market. Increasingly busy lifestyles, extended working hours, and fast-paced urban routines are pushing consumers toward portable foods that require no preparation and can be consumed anytime. Snack bars effectively address this need by offering a convenient, portion-controlled format that helps manage hunger between meals. They are particularly suitable for office breaks, commuting, travel, and workout-related snacking. This trend is also encouraging brands to innovate by developing products that combine convenience with functional nutrition, especially protein-enriched options that provide sustained satiety and energy in a compact form. For example, in January 2026, RiteBite introduced a Millet Wafer Protein Bar containing 10g of protein, highlighting how manufacturers are responding to the region's increasing demand for on-the-go consumption solutions with convenient, high-protein, ready-to-eat formats. Additionally, the focus on health-conscious consumers is driving the inclusion of natural ingredients, such as millet, which aligns with the growing preference for wholesome and nutritious snack options.
Increasing focus on weight management and portion control
The growing emphasis on weight management and portion control is a significant driver for the Asia-Pacific snack bars market. Consumers are increasingly adopting disciplined eating habits to manage calorie intake, reduce overeating, and achieve fitness or lifestyle objectives. Snack bars are gaining traction due to their pre-portioned, convenient, and measurable format, enabling consumers to avoid unplanned indulgences and maintain structured meal schedules during busy days. Additionally, they are often preferred as a healthier alternative to traditional packaged snacks, particularly for mid-meal hunger, offering a filling yet controlled option. This trend is boosting demand for products with attributes such as high protein, higher fiber, and reduced sugar, which are associated with satiety, improved appetite management, and better nutritional balance. Furthermore, the versatility of snack bars, available in various flavors and formulations, caters to diverse consumer preferences, making them a practical and appealing choice. Consequently, snack bars are becoming an integral part of daily routines for health-conscious consumers seeking effective weight management solutions without compromising on convenience, taste, or variety.
Restraints Impact Analysis*
| Restraint | (~) % Impact on CAGR Forecast | Geographic Relevance | Impact Timeline |
|---|---|---|---|
| High competition from alternative snacks | -1.1% | Global, particularly intense in India, Indonesia, Thailand | Short term (≤ 2 years) |
| High sugar content in several bar variants | -0.9% | Australia, Singapore, Japan (regulatory scrutiny) | Medium term (2-4 years) |
| Allergen concerns and labeling sensitivity | -0.7% | Australia, New Zealand, Japan, Singapore | Long term (≥ 4 years) |
| Strong competition from alternative healthy snacks | -1.0% | Urban China, India, South Korea | Medium term (2-4 years) |
| Source: Mordor Intelligence | |||
High competition form alternative snacks
High competition from alternative snacks serves as a significant restraint for the Asia-Pacific snack bars market. Consumers have access to a wide variety of convenient snacking options that can directly replace snack bars in daily consumption scenarios. Traditional packaged snacks, better-for-you snack categories, and fresh or minimally processed options often compete effectively by offering taste familiarity, established consumption habits, and convenience. This makes it challenging for snack bars to secure consistent repeat purchases. Furthermore, many consumers prefer snacks that feel more indulgent, culturally relevant, or tailored to specific social contexts, such as tea-time or gatherings, further limiting the appeal of snack bars. As a result, snack bars are often relegated to niche consumption occasions like fitness activities, travel, or meal skipping. This intense overlap among snack categories drives higher brand switching, weakens consumer loyalty, and forces snack bar companies to continuously innovate.
High sugar content in several bar variants
High sugar content in various snack bar variants remains a significant restraint for the snack bars market. This issue creates a disconnect between the healthy snack positioning of these products and their actual nutritional profiles, reducing consumer trust and discouraging repeat purchases among health-conscious consumers. Many snack bars use sweeteners and dense ingredient blends to enhance taste and texture, but these formulations often result in sugar levels that conflict with consumer expectations regarding clean eating, weight management, and balanced nutrition. This concern is amplified as consumers increasingly scrutinize product labels and compare sugar levels across snack options, leading them to favor alternatives perceived as lighter or less sugary. Supporting this, the Chartered Institute of Environmental Health reported that under the United Kingdom’s voluntary front-of-pack traffic-light labeling system, 37% of snack bars sold in supermarkets are high in sugars, and 55% are high in saturated fat. These findings highlight that a significant portion of the category does not meet modern health standards, further fueling consumer skepticism toward snack bars.
*Our forecasts treat driver/restraint impacts as directional, not additive. The impact forecasts reflect baseline growth, mix effects, and variable interactions.
Segment Analysis
By Product Type: Protein Bars Lead, Energy Bars Gain Ground
Protein bars accounted for 63.43% of the Asia Pacific snack bars market in 2025, a leadership position expected to remain robust with a projected CAGR of 11.99% through 2031. This growth is driven by their alignment with the region's key nutrition trends, including high-protein diets, fitness-focused lifestyles, and demand for convenient, better-for-you snacking options. Protein bars are increasingly consumed not only by gym-goers but also by working professionals and students seeking a filling snack that curbs hunger, supports weight management, and offers convenience without preparation. Their market dominance is further bolstered by rapid product innovation, such as high-protein formulations with reduced sugar, added fiber, and functional ingredients. As consumers become more label-conscious, brands are enhancing credibility with cleaner ingredient profiles and plant-based protein options, broadening the appeal of protein bars beyond traditional sports nutrition audiences.
Energy bars cater specifically to endurance athletes, outdoor enthusiasts, trekkers, cyclists, and consumers engaged in long-duration activities, making them a purpose-driven segment within the market. Their demand stems from the need for quick and sustained energy release, often achieved through carbohydrate-rich blends. Energy bars focus on satiety and recovery, offering immediate performance benefits such as quick fueling, stamina support, and convenience during active movement. These attributes make them popular for activities like long-distance running, cycling, outdoor trips, and as emergency snacks. This segment's growth is further supported by the increasing culture of regular fitness participation across the Asia Pacific region. For example, according to the State General Administration of Sports (China), approximately 45.3% of China's population engaged in regular sports activities in 2025, highlighting the expanding consumer base for endurance-focused nutrition products like energy bars [2]Source: State General Administration of Sports (China), "Share of population engaged in regular physical exercising in China", sport.gov.cn.


By Ingredient Base: Granola and Oats Outpace Nut-Based Incumbents
Nut-based snack bars accounted for a 31.35% market share in 2025, supported by their strong positioning as naturally nutritious and premium snack options that align with the Asia-Pacific's evolving health and lifestyle preferences. This segment continues to drive growth as nuts are widely perceived as a wholesome base ingredient, enabling brands to present a product image closer to real-food nutrition rather than heavily processed alternatives. Additionally, nut-based variants benefit from their strong satiety performance, meeting consumer demand for snacks that provide fullness between meals, support weight management goals, and reduce frequent hunger cravings during busy workdays. These bars are also increasingly chosen for their clean-label appeal, as nut-based formats naturally allow simpler formulations and enable brands to highlight benefits such as balanced nutrition and sustained energy without relying heavily on functional claims.
Granola and oat-based bars are projected to grow at a robust 10.43% CAGR through 2031, driven by their broad consumer acceptance as familiar, everyday healthy snacks that balance taste, nutrition, and convenience. This segment is gaining traction across the Asia-Pacific due to its natural fit into breakfast-style and light-meal occasions, making it easy for consumers to adopt as a morning bite, mid-day hunger fix, or travel-friendly snack without altering their eating habits. Granola and oat-based formats are also perceived as better-for-you and less niche compared to performance-focused bars, enabling them to appeal strongly to students, office workers, and families seeking steady energy and a wholesome snack alternative. Furthermore, the versatility of granola and oat-based bars in accommodating various flavors, dietary preferences, and functional ingredients has broadened their appeal, making them a preferred choice for health-conscious consumers. Their ability to combine indulgent taste with nutritional benefits has also contributed to their growing popularity, particularly among individuals seeking a balance between health and enjoyment in their snacking options.
By Price Tier: Premium Segment Surges Despite Mass Dominance
Mass-tier snack bars accounted for 76.15% of 2025 sales, driven by their broad accessibility and alignment with everyday snacking habits across the Asia-Pacific. This segment dominates due to its positioning as practical, routine purchases rather than occasional specialty nutrition products, making them more suitable for daily consumption. Their success is further supported by widespread availability across various purchase points, consistent product familiarity, and a strong focus on core consumer expectations, including satisfying taste, convenient portion sizes, and stable shelf life. Mass-tier brands also benefit from offering a wide variety of flavors and formats that cater to diverse regional preferences while maintaining a simple and easy-to-understand proposition, encouraging repeat purchases and impulse buying.
The premium snack bars segment is projected to grow at a robust 11.43% CAGR through 2031, fueled by rising consumer interest in higher-quality, health-focused, and experience-driven snacking across the Asia-Pacific. Premium bars are expanding rapidly due to their differentiation through superior ingredient quality, cleaner-label formulations, and enhanced taste and texture experiences. This segment benefits from consumers increasingly prioritizing wellness attributes such as high protein, reduced sugar, fiber-rich nutrition, and performance support, alongside expectations for transparency, credibility, and modern packaging. Premium bars also gain appeal through gifting-style presentation, lifestyle-oriented branding, and sophisticated flavor profiles, which encourage frequent trials among urban consumers and working professionals seeking a convenient yet elevated alternative to traditional packaged snacks.
By Distribution Channel: E-Commerce Disrupts Traditional Retail
Supermarkets and hypermarkets accounted for 59.11% of 2025 sales, driven by their ability to facilitate high-volume purchases through one-stop shopping convenience and extensive product visibility. This channel remains dominant as it allows consumers to compare various snack bar brands, flavors, and nutritional formats in a single visit. It supports both planned purchases and impulse buys, particularly when snack bars are strategically placed in high-traffic areas such as checkout counters, health food aisles, or breakfast/snacking sections. Additionally, supermarkets and hypermarkets enhance category leadership through frequent in-store promotions, bundle offers, and sampling activities, which encourage trial and repeat purchases. These factors make this channel effective for both mass-tier snack bars and the growing segment of premium options.
Online retail stores are projected to grow at a robust 12.36% CAGR through 2031, driven by the increasing adoption of digital-first shopping habits and the convenience of ordering snack bars with doorstep delivery. Online platforms facilitate higher trial rates through attractive combo packs, subscription-based repeat purchase options, and targeted recommendations tailored to specific needs, such as fitness routines, weight management, or clean-label preferences. This channel also benefits from faster new-product launches and broader availability across cities beyond the reach of organized retail. These factors enable brands to scale demand efficiently while fostering stronger consumer engagement through influencer content and performance nutrition communities.
Geography Analysis
Japan accounted for 36.46% of the Asia Pacific snack bar market in 2025, reflecting its long-standing convenience-store saturation, advanced regulatory environment, and strong consumer acceptance of functional foods. Snack bars are deeply integrated into daily eating habits in Japan, serving as breakfast replacements, mid-day energy sources, and portion-controlled snacks. This is supported by organized retail execution and high product visibility at key purchase points. The market is further bolstered by busy working lifestyles that favor portable nutrition formats. For example, according to the International Monetary Fund (IMF), the number of employed people in Japan reached 67.73 million in 2025, sustaining demand for convenient, ready-to-eat foods that align with time-constrained schedules [3]Source: International Monetary Fund (IMF), "Number of employed people in Japan", imf.org.
India is projected to achieve a compound annual growth rate (CAGR) of 11.76% through 2031, making it the strongest growth driver in the region. This growth is fueled by increasing adoption of health-focused snacking, a rising preference for protein-based nutrition, and the growing role of snack bars as functional, on-the-go solutions. The market is expanding as snack bars gain relevance beyond a niche urban audience, addressing daily hunger management, meal replacement needs, and fitness-related consumption. Additionally, the influence of digital platforms and advancements in product innovation, particularly in taste and format, are improving trial rates and encouraging repeat purchases, positioning India as one of the most dynamic markets in the region.
China's snack bar market is increasingly influenced by the expanding sports nutrition category, which includes protein and energy bars tailored to fitness routines, endurance needs, and performance-related snacking occasions. Demand is supported by higher participation in structured exercise and a growing emphasis on convenient nutrition that provides targeted benefits such as stamina, recovery, and sustained energy. Beyond the major markets, countries such as Australia, South Korea, Indonesia, Thailand, and Singapore collectively contribute to the region's growth. These markets benefit from wellness-driven consumption trends, premiumization, strong retail visibility, and the rapid expansion of online availability. Together, they reinforce the broad-based growth of the snack bar market across the Asia Pacific region.

Competitive Landscape
The Asia-Pacific snack bars market is moderately fragmented, featuring a diverse mix of global corporations, regional food manufacturers, and emerging health-focused brands competing across both mass-market and premium segments. The market is characterized by a dynamic competitive environment where established players and new entrants vie for consumer attention. Key players in the market include Amway Corp, Asahi Group Holdings Ltd, Bagrrys India Pvt Ltd, General Mills Inc., and Mondelēz International, Inc. These companies leverage scale advantages, diversified product portfolios, strong retail presence, and brand trust to maintain their competitive positions. The competitive dynamics are further shaped by a growing focus on taste innovation and texture enhancement, as brands aim to boost repeat purchases and minimize consumer switching in a market characterized by frequent experimentation with new formats and flavors.
Competition in the market is driven by continuous product innovation, frequent new product launches, and differentiation through nutritional positioning, such as high-protein, functional, and better-for-you snack options. Established brands benefit from extensive distribution networks, strong brand recognition, and the ability to invest in large-scale marketing campaigns. Meanwhile, newer entrants are gaining traction by addressing specific consumer needs, including sports nutrition, meal replacement options, and clean-label preferences. These emerging players often focus on niche markets, leveraging their agility to quickly adapt to changing consumer demands. This dynamic has resulted in a market where market share is distributed among multiple participants rather than being concentrated among a few dominant players. Furthermore, the increasing consumer inclination toward health-conscious and sustainable products is encouraging brands to innovate and differentiate their offerings to remain competitive.
Technology adoption is increasingly distinguishing market leaders from competitors. Brands utilizing AI-driven flavor prediction, blockchain-based traceability, and subscription analytics are better positioned to enhance repeat purchases and reduce customer churn. AI tools enable faster innovation cycles by aligning product development with evolving consumer taste preferences. Blockchain technology enhances ingredient transparency and authenticity, fostering greater consumer trust. Additionally, subscription and loyalty analytics allow brands to monitor purchase frequency, personalize product recommendations, and optimize packaging formats. These tools support stronger retention in online channels and help build long-term consumer engagement in an increasingly competitive market environment.
Asia Pacific Snack Bar Industry Leaders
-
Amway Corp
-
Asahi Group Holdings Ltd
-
Bagrrys India Pvt Ltd
-
General Mills Inc.
-
Mondelēz International, Inc.
- *Disclaimer: Major Players sorted in no particular order

Recent Industry Developments
- November 2025: SnackHQ has introduced a new flavor of its ReFil snack bars, Creamy Caramel. Each bar features a 5 Health Star Rating, is gluten-free, and contains 9g of prebiotic fiber along with 6g of protein.
- August 2025: Phab has introduced India's first savory protein bar, the Bhel Bar, available in three variants: The OG Bhel, Curry Leaf Podi, and Peri Peri. Each bar provides 10 grams of clean plant protein.
- February 2025: EatFit has introduced its new energy bars, Hustl. Developed in collaboration with renowned Indian cricketer Mayank Agarwal, these energy bars are designed to offer a convenient, on-the-go snack that provides energy and supports nutritional needs.


Asia Pacific Snack Bar Market Report Scope
A snack bar is a ready-to-eat food made from grains, dried fruits, nuts, seeds, or protein, offering quick energy or nutrients as a convenient snack. The Asia-Pacific Snack Bar Market is Segmented by Product Type, Ingredient Base, Price Tier, Distribution Channel, and Geography. By Product Type, the market is segmented into Cereal Bars, Energy Bars, Protein Bars, and Fruit and Nut Bars. By Ingredient Base, the market is segmented into Nut-based bars, Granola/Oat-based, Date-based, Dairy/Protein-based, Hybrid blends, and Others. By Price Tier, the market is segmented into Mass and Premium. By Distribution Channel, the market is segmented into Supermarkets and Hypermarkets, Online Retail Stores, Convenience Stores, and Other Distribution Channels. By geography, the market is segmented into China, India, Japan, Australia, Indonesia, South Korea, Thailand, Singapore, and the rest of the Asia-Pacific region. The Market Forecasts are Provided in Terms of Value (USD) and Volume (Tons).
By Product type
| Cereal Bar |
| Energy Bar |
| Protein Bar |
| Fruit and Nut Bar |
By Ingredient Base
| Nut-based bars |
| Granola/Oat-based |
| Date-based |
| Dairy/Protein-based |
| Hybrid blends |
| Others |
By Price Tier
| Mass |
| Premium |
By Distribution Channel
| Supermarkets/Hypermarkets |
| Online Retail Stores |
| Convenience Stores |
| Other Distribution Channels |
By Geography
| China |
| India |
| Japan |
| Australia |
| Indonesia |
| South Korea |
| Thailand |
| Singapore |
| Rest of Asia-Pacific |
| By Product type | Cereal Bar |
| Energy Bar | |
| Protein Bar | |
| Fruit and Nut Bar | |
| By Ingredient Base | Nut-based bars |
| Granola/Oat-based | |
| Date-based | |
| Dairy/Protein-based | |
| Hybrid blends | |
| Others | |
| By Price Tier | Mass |
| Premium | |
| By Distribution Channel | Supermarkets/Hypermarkets |
| Online Retail Stores | |
| Convenience Stores | |
| Other Distribution Channels | |
| By Geography | China |
| India | |
| Japan | |
| Australia | |
| Indonesia | |
| South Korea | |
| Thailand | |
| Singapore | |
| Rest of Asia-Pacific |


Market Definition
- Milk and White Chocolate - Milk chocolates is a solid chocolate made with milk (in the form of either milk powder, liquid milk, or condensed milk) and cocoa solids. White chocolate is made from cocoa butter and milk and contains no cocoa solids whatsoever. The scope includes regular chocolates, low-sugar, and sugar-free variants
- Toffees & Nougats - Toffees include hard, chewy, and small or one-bite candies marketed with labels as toffee or toffee-like confectionery. Nougat is a chewy confection with almond, sugar, and egg white as a basic ingredient; and it originated in Europe and Middle East countries.
- Cereals Bars - A snack composed of breakfast cereal that has been compressed into a bar shape and is held together with a form of edible adhesive. The scope includes snack bars made with cereals such as rice, oats, corn, etc. mixed with a binding syrup. These also include products labeled as cereal bars, cereal treat bars, or grain bars.
- Chewing Gum - This is a preparation for chewing, usually made of flavored and sweetened chicle or such substitutes as polyvinyl acetate. The types of chewing gums included in the scope are sugar-chewing gums and sugar-free chewing gums
| Keyword | Definition |
|---|---|
| Dark Chocolate | Dark chocolate is a form of chocolate containing cocoa solids and cocoa butter without the milk. |
| White Chocolate | White chocolate is the type of chocolate containing the highest percentage of milk solids, typically around or over 30 percent. |
| Milk Chocolate | Milk chocolate is made from dark chocolate that has a low cocoa solid content and higher sugar content, plus a milk product. |
| Hard Candy | A candy made of sugar and corn syrup boiled without crystallizing. |
| Toffees | A hard, chewy, often brown sweet that is made from sugar boiled with butter. |
| Nougats | A chewy or brittle candy containing almonds or other nuts and sometimes fruit. |
| Cereal bar | A cereal bar is a bar-shaped food product, made by pressing cereals and usually dried fruit or berries, which are in most cases held together by glucose syrup. |
| Protein bar | Protein bars are nutrition bars that contain a high proportion of protein to carbohydrates/fats. |
| Fruit & Nut bar | These are often based on dates with other dried fruit and nut additions and, in some cases, flavorings. |
| NCA | The National Confectioners Association is an American trade organization that promotes chocolate, candy, gum and mints, and the companies that make these treats. |
| CGMP | Current good manufacturing practices are those conforming to the guidelines recommended by relevant agencies. |
| Unstandardized foods | Unstandardized foods are those that do not have a standard of identity or that deviate from a prescribed standard in any manner. |
| GI | The glycemic index (GI) is a way of ranking carbohydrate-containing foods based on how slowly or quickly they are digested and increase blood glucose levels over a period of time |
| Skimmed milk powder | Skimmed milk powder is obtained by removing water from pasteurized skim milk by spray-drying. |
| Flavanols | Flavanols are a group of compounds found in cocoa, tea, apples, and many other plant-based foods and beverages. |
| WPC | Whey protein concentrate- the substance obtained by the removal of sufficient nonprotein constituents from pasteurized whey so that the finished dry product contains greater than 25% protein. |
| LDL | Low density Lipoprotein- the bad cholesterol |
| HDL | High density Lipoprotein- the good cholesterol |
| BHT | butylated Hydroxytoluene is a lab-made chemical that is added to foods as a preservative. |
| Carrageenan | Carrageenan is an additive used to thicken, emulsify, and preserve foods and drinks. |
| Free form | Not containing certain ingredients, such as gluten, dairy, or sugar. |
| Cocoa butter | It is a fatty substance obtained from cocoa beans, used in the manufacture of confectionery. |
| Pastellies | A type of of Brazilian candy made from sugar, eggs, and milk. |
| Draggees | Small, round candies that are coated with a hard sugar shell |
| CHOPRABISCO | Royal Belgian Association of the chocolate, pralines, biscuit, and confectionery industry- A trade association that represents the Belgian chocolate industry. |
| European Directive 2000/13 | A European Union directive that regulates the labeling of food products |
| Kakao-Verordnung | The German chocolate ordinance, a set of regulations that define what can be labeled as "chocolate" in Germany. |
| FASFC | Federal Agency for the Safety of the Food Chain |
| Pectin | A natural substance that is derived from fruits and vegetables. It is used in confectionery to create a gel-like texture. |
| Invert sugars | A type of sugar that is made up of glucose and fructose. |
| Emulsifier | A substance that helps to mix to liquids that does not mix together. |
| Anthocyanins | A type of flavonoid that is responsible for the red, purple, and blue colors of confectionery. |
| Functional Foods | Foods that have been modified to provide additional health benefits beyond basic nutrition. |
| Kosher certificate | This certification verifies that the ingredients, production process including all machinery, and/or food-service process complies with the standards of Jewish dietary law |
| Chicory root extract | A natural extract from the chicory root that is a good source of fiber, calcium, phosphorous, and folate |
| RDD | Recommended daily dose |
| Gummies | A chewy gelatin-based candy that is often flavored with fruit. |
| Nutraceuticals | Food or dietary supplements that are claimed to have health benefits. |
| Energy bars | Snack bars that are high in carbohydrates and calories are designed to provide energy on the go. |
| BFSO | Belgian Food Safety Organization for the food chain. |


Research Methodology
Mordor Intelligence follows a four-step methodology in all our reports.
- Step-1: Identify Key Variables: In order to build a robust forecasting methodology, the variables and factors identified in Step 1 are tested against available historical market numbers. Through an iterative process, the variables required for market forecast are set, and the model is built on the basis of these variables.
- Step-2: Build a Market Model: Market-size estimations for the forecast years are in nominal terms. Inflation is not a part of the pricing, and the average selling price (ASP) is kept constant throughout the forecast period for each country.
- Step-3: Validate and Finalize: In this important step, all market numbers, variables, and analyst calls are validated through an extensive network of primary research experts from the market studied. The respondents are selected across levels and functions to generate a holistic picture of the market studied.
- Step-4: Research Outputs: Syndicated Reports, Custom Consulting Assignments, Databases & Subscription Platforms


