Market Overview
| Study Period | 2018 - 2031 |
|---|---|
| Forecast Data Period | 2026 - 2031 |
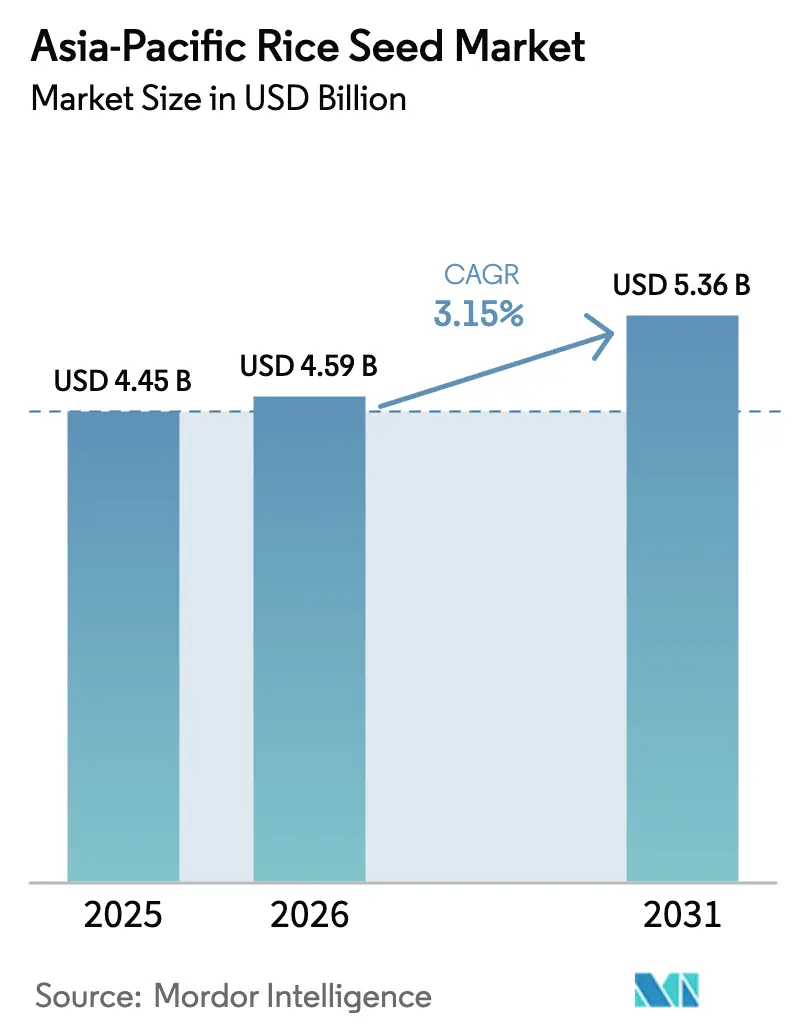
| Base Year Market Size (2025) | USD 4.45 Billion |
| Market Size (2026) | USD 4.59 Billion |
| Market Size (2031) | USD 5.36 Billion |
| Growth Rate (2026 - 2031) | 3.15% CAGR |
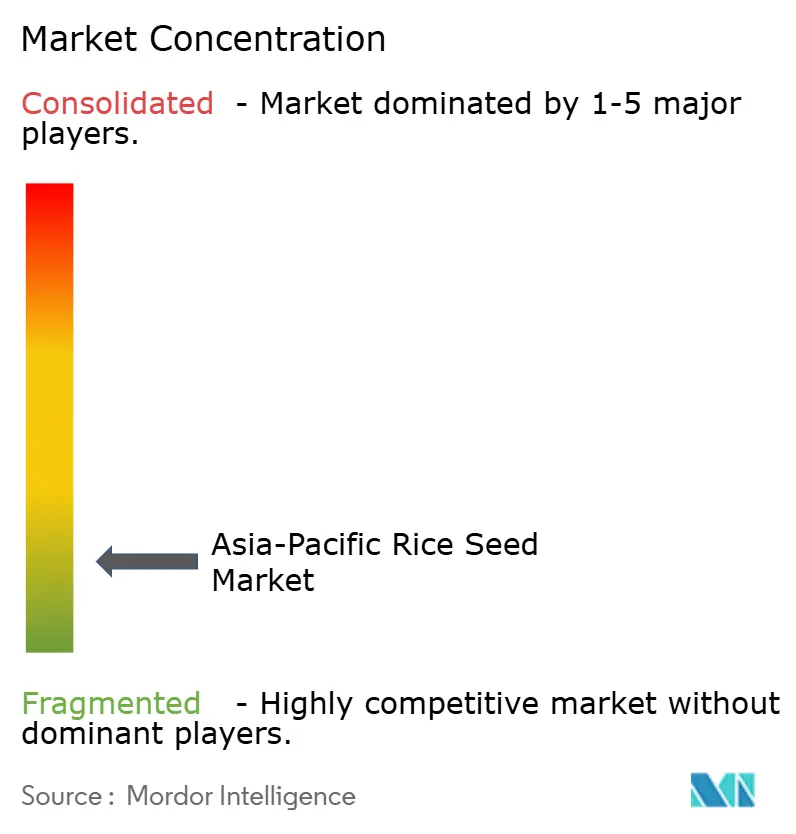
| Market Concentration | Low |
Major Players
*Disclaimer: Major Players sorted in no particular order Image © Mordor Intelligence. Reuse requires attribution under CC BY 4.0. |
|
Asia-Pacific Rice Seed Market Analysis by Mordor Intelligence
The Asia-Pacific rice seed market size is expected to grow from USD 4.45 billion in 2025 to USD 4.59 billion in 2026 and is forecast to reach USD 5.36 billion by 2031 at 3.15% CAGR over 2026-2031. Continued public investment in climate-resilient breeding, rapid genome-editing breakthroughs, and rising adoption of direct-seeded cultivation underpin the market’s momentum. Government programs, such as China’s Seed Chips initiative and India’s direct-seeded rice (DSR) subsidy, are accelerating varietal turnover, while post-pandemic food security stockpiles are spurring demand for high-quality certified seed. Increasing e-commerce penetration in farm input retail is shortening upgrade cycles and widening farmer access to improved genetics. Meanwhile, drought- and heat-tolerant germplasm is gaining commercial traction as El Niño-related yield losses push growers toward premium stress-mitigation traits[1]Source: International Rice Research Institute, "Low GI rice seen as promising solution to mitigate Asia's diabetes crisis," irri.org.
Key Report Takeaways
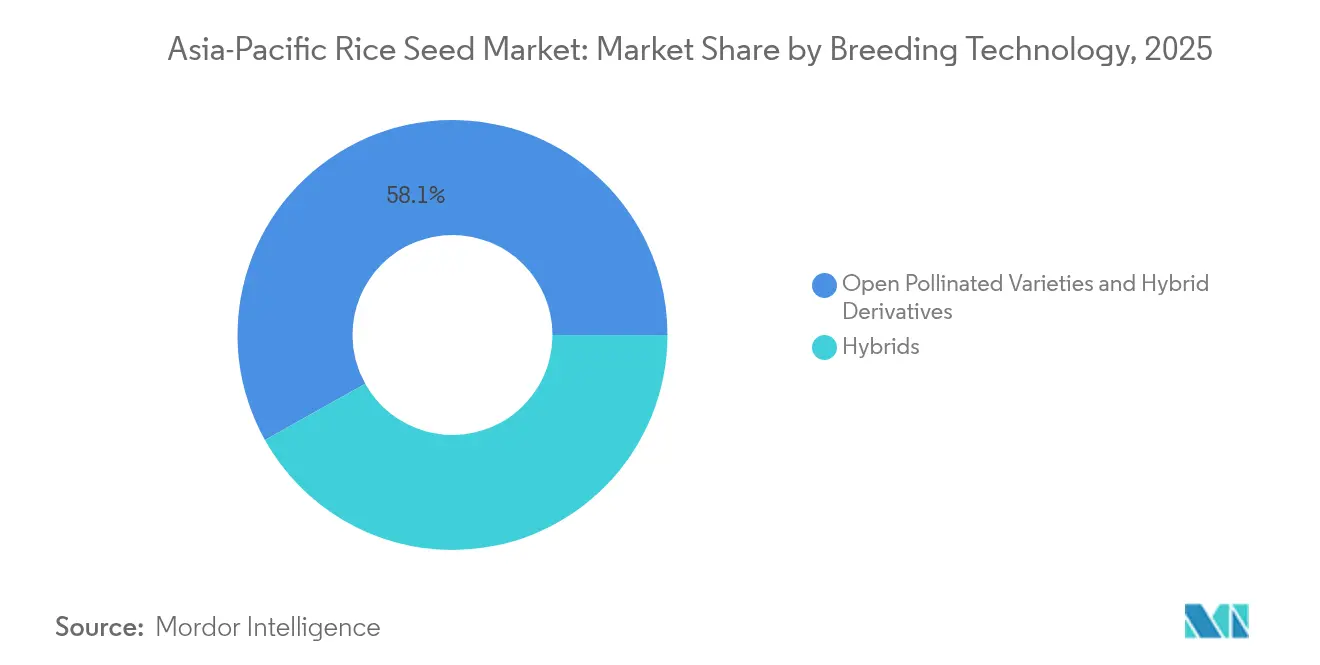
- By breeding technology, open-pollinated varieties and hybrid derivatives held 58.12% of the Asia-Pacific rice seed market share in 2025 and are projected to grow at a 3.29% CAGR to 2031.
- By country, China accounted for a 41.95% share of the Asia-Pacific rice seed market size in 2025, while Bangladesh is advancing at a 6.14% CAGR through 2031.
- The top five companies collectively captured nearly 13.8% of the Asia-Pacific rice seed market share in 2024, with Yuan Longping High-Tech Agriculture leading at 2%, highlighting a highly fragmented competitive landscape.
Note: Market size and forecast figures in this report are generated using Mordor Intelligence’s proprietary estimation framework, updated with the latest available data and insights as of 2026.
Asia-Pacific Rice Seed Market Trends and Insights
Drivers Impact Analysis*
| Driver | (~) % Impact on CAGR Forecast | Geographic Relevance | Impact Timeline |
|---|---|---|---|
| Yield-oriented public varietal replacements | +0.8% | China, India, Bangladesh | Medium term (2–4 years) |
| Hybridization funded under Seed Chips plan | +0.6% | China, spillover to Asia-Pacific | Long term (≥ 4 years) |
| Accelerated varietal turnover via e-commerce | +0.4% | India, China, Thailand, and Vietnam | Short term (≤ 2 years) |
| Climate-resilient germplasm demand | +0.7% | Philippines, Vietnam, and Thailand | Medium term (2–4 years) |
| Government DSR subsidies in India | +0.5% | India, Bangladesh, and Myanmar | Medium term (2–4 years) |
| Regional food-security stock-builds | +0.3% | Core Asia-Pacific, spillover to Asia | Long term (≥ 4 years) |
| Source: Mordor Intelligence | |||
Yield-oriented public varietal replacements
Government-led replacement programs are accelerating across major producers. India’s AICRIP (All India Coordinated Rice Improvement Project) approved zinc-biofortified Spoorthi with 26 ppm zinc, well above the 12–16 ppm baseline, and distributed 50 quintals of foundation seed in 2025[2]Source: International Rice Research Institute, "New Zinc-Rich Rice Variety 'Spoorthi' Rolled Out in India," irri.org. China’s organized farming bases in Harbin, Baicheng, Jilin, and Panjin are systematically phasing out legacy cultivars in favor of high-yielding lines. Bangladesh’s modernization push mirrors these efforts, underpinning its 6.21% CAGR. Public speed-breeding protocols delivering 4–5 generations annually enable faster turnover and intensify competitive pressure on private hybrids.
Hybridization programs funded under China’s “Seed Chips” plan
China’s multibillion-dollar Seed Chips initiative is channeling funds into genome editing and molecular breeding that deliver heat-tolerant lines sustaining yields at 2–3 °C above historical norms. Yuan Longping High-Tech Agriculture, riding preferential access to state labs, has released nitrogen-efficient hybrids cutting fertilizer use by 30% without yield compromise. Neighboring Thailand legalized genome-edited crops in 2024, while Vietnam and the Philippines are drafting parallel regulations, signaling broader regional uptake.
Accelerated varietal turnover driven by e-commerce seed retail
Digital marketplaces are shrinking replacement intervals from 3–5 years to 2–3 years. The Philippines’ RiceBIS network links 23 communities across 10,000 ha, marrying seed sales with contract-buying arrangements[3]Source: Philippine News Agency, "PhilRice links clustered farm groups with private sector," pna.gov.ph. India’s DSR subsidy portal bundles certified seed with agronomic advisory, boosting uptake of mechanization-ready varieties. Direct-to-farmer channels are easing distribution bottlenecks in Indonesia and Myanmar and forcing price transparency that favors value-rich germplasm.
Climate-resilient germplasm demand
The 2024 El Niño cut irrigation allocations, prompting Thailand to limit farmers to a single crop season and trimming Vietnam’s exportable surplus. Stress-tolerant varieties delivering 20–30% yield protection under heat, drought, or salinity are now commercially viable despite 15–25% higher seed costs. Venture capital is flowing, highlighted by Rize’s USD 14 million Series A to scale low-emission rice systems among 20,000 farmers in Indonesia and Vietnam.
Restraints Impact Analysis*
| Restraint | (~) % Impact on CAGR Forecast | Geographic Relevance | Impact Timeline |
|---|---|---|---|
| Farmer distrust of trait-royalty pricing | −0.4% | India, Bangladesh, Myanmar, and Indonesia | Short term (≤ 2 years) |
| Slow biotech trait clearance in Japan and Korea | −0.3% | Japan and Korea | Long term (≥ 4 years) |
| Fragmented last-mile distribution in Indonesia and Myanmar | −0.2% | Indonesia, Myanmar, and rural Philippines | Medium term (2–4 years) |
| Soil salinity escalation in the Mekong Delta | −0.5% | Vietnam, Cambodia, and Thailand | Long term (≥ 4 years |
| Source: Mordor Intelligence | |||
Farmer distrust of trait-royalty pricing
Uncertainty over long-term cost recovery discourages many smallholders from buying proprietary hybrids that carry technology fees, even when the varieties promise 10–15% higher yields. Farmers in India, Bangladesh, and Myanmar report difficulty in verifying seed authenticity and trait performance, leading to perceptions that premium prices do not always translate into proportional income gains. Because royalty-bearing seed must be repurchased every season, cash-constrained growers often revert to farm-saved open-pollinated seed after one cycle, undermining the repeat-purchase model that private breeders rely on.
Soil salinity escalation limiting seed effectiveness in Mekong Delta
Saltwater intrusion affected an estimated 1.77 million hectares of the Mekong Delta in 2024, curbing yields and shrinking the addressable acreage for conventional high-yielding varieties. Elevated soil salinity reduces germination rates, shortens panicle length, and accelerates lodging, eroding the performance gains that improved genetics are designed to deliver. Although breeders are rushing salt-tolerant lines to market, most carry yield penalties of 5–8% under non-stress conditions, making farmers reluctant to switch unless salinity stress is severe.
*Our forecasts treat driver/restraint impacts as directional, not additive. The impact forecasts reflect baseline growth, mix effects, and variable interactions.
Segment Analysis
By Breeding Technology: Open-Pollinated Varieties Anchor the Base
Open Pollinated Varieties and Hybrid Derivatives command 58.12% market share in 2025, with forecasted growth of 3.29% CAGR through 2031, reflecting their established farmer acceptance and lower seed replacement costs compared to hybrid alternatives. This dominance persists despite significant technological advances in hybrid development, as smallholder farmers prioritize seed-saving capabilities and proven performance over potential yield advantages that require optimal management conditions. Hybrid varieties, while representing a smaller market share, demonstrate stronger growth potential through government-backed programs like China's "Seed Chips" initiative, which specifically targets hybrid development for yield improvements and climate resilience.
Non-transgenic hybrids continue to capture the largest share within the hybrid segment, driven by consumer acceptance and regulatory approval advantages across most Asia-Pacific markets, while transgenic hybrids face varying approval timelines and market resistance despite superior trait performance. Insect-resistant hybrids show particular promise in regions experiencing increased pest pressure due to climate change, with integrated pest management benefits offsetting higher seed costs for commercial producers. The Philippines' approval of Golden Rice for commercial cultivation demonstrates growing regulatory acceptance of biofortified varieties, potentially opening pathways for other transgenic traits including herbicide tolerance and enhanced nutritional content. Speed breeding protocols developed by IRRI, enabling 4-5 generations per year versus traditional 2-3, are accelerating hybrid development timelines and reducing commercialization costs, making hybrid varieties increasingly competitive with open-pollinated alternatives.


Geography Analysis
East Asia dominates the Asia-Pacific rice seed market, with China's volume leadership and Japan's premium positioning anchoring the region. China maintained 41.95% of the Asia-Pacific rice seed market size in 2025. Growth is moderating as established seed systems and aging farmer demographics limit adoption velocity, though Japan's recent price crisis has created openings for storage-stable varieties. China's Seed Chips program across Harbin, Baicheng, and Jilin represents a systematic push toward seed sovereignty with regional spillover effects.
Southeast Asia represents a significant portion of the market and leads regional growth, powered by Bangladesh's expansion and climate adaptation imperatives. Bangladesh leads growth at 6.14% CAGR through 2031, driven by modernization programs and smallholder productivity initiatives. Vietnam's position as a major global exporter, supplying most of the Philippines' imports, drives demand for export-quality genetics. Mekong Delta salinity affects vast agricultural areas, intensifying the need for salt-tolerant varieties. Indonesia and Myanmar face distribution challenges that digital platforms and cooperative models are beginning to address.
South Asia maintains a substantial market presence with strong growth potential through India's DSR subsidies and biofortified variety rollout, including zinc-enhanced Spoorthi. Pakistan's basmati systems create niche opportunities for aromatic varieties. Regulatory frameworks vary significantly, with India advancing genome editing approvals while maintaining caution on transgenic traits, creating complex market dynamics for multinational seed companies operating across multiple jurisdictions.
Competitive Landscape
The Asia-Pacific rice seed market exhibits high fragmentation, with the top five players controlling just 13.8% combined share, indicating substantial consolidation potential and limited entry barriers for companies with appropriate technology and distribution capabilities. Yuan Longping High-Tech Agriculture leads the market through preferential access to China's Seed Chips funding, while Syngenta Group follows through with its diversified portfolio and established distribution networks. This fragmentation reflects smallholder predominance, regional variety preferences, and policies favoring domestic seed companies in key markets.
Competitive strategies increasingly focus on technology integration and public-private partnerships, exemplified by IRRI's collaboration with XAG on drone-based precision seeding in the Philippines and Rize's USD 14 million Series A funding for sustainable farming technologies in Indonesia and Vietnam. White-space opportunities exist in biofortification, with only one zinc-enhanced variety approved in India despite nutritional deficiencies affecting 30–40% of the population. Emerging disruptors leverage speed breeding to compress development cycles from 6–7 years to 1.5–2 years, enabling faster response to climate adaptation needs and government program requirements.
Companies gaining market share demonstrate superior capabilities in regulatory navigation, farmer education, and integrated crop management systems that combine seeds with precision agriculture technologies and financial services for smallholder producers. IRRI's May 2025 Seed Accelerator Meet in Hyderabad brought together state corporations, private companies including Advanta Seeds, and farmer producer organizations to strengthen early-generation seed access and accelerate commercial deployment of new varieties.
Asia-Pacific Rice Seed Industry Leaders
-
Beidahuang Kenfeng Seed
-
Syngenta Group
-
SL Agritech Corporation
-
Advanta Seeds (UPL Ltd.)
-
Yuan Longping High-Tech Agriculture
- *Disclaimer: Major Players sorted in no particular order

Recent Industry Developments
- July 2025: IRRI announced the rollout of zinc-rich rice variety Spoorthi in India, containing 26 ppm zinc versus 12–16 ppm in conventional varieties, with 50 quintals of seed distributed to farmers in Karnataka and Telangana for multiplication and scale-up.
- May 2025: The International Rice Research Institute (IRRI) organized a Seed Accelerator Meet to expedite the distribution and adoption of new rice varieties in Asia and Africa. The meeting focused on developing collaborative approaches to strengthen seed systems and improve farmers' access to new varieties.
- May 2024: Rize completed USD 14 million Series A funding led by Breakthrough Energy Ventures, GenZero, Temasek, and Wavemaker Impact to expand sustainable rice farming technology across Indonesia and Vietnam, targeting 20,000 farmers and 7,000 hectares with a projected 50% emissions reduction and 30% income increase.


Asia-Pacific Rice Seed Market Report Scope
Hybrids, Open Pollinated Varieties & Hybrid Derivatives are covered as segments by Breeding Technology. Australia, Bangladesh, China, India, Indonesia, Japan, Myanmar, Pakistan, Philippines, Thailand, Vietnam are covered as segments by Country.
Breeding Technology
| Hybrids | Non-Transgenic Hybrids | |
| Transgenic Hybrids | Insect Resistant Hybrids | |
| Other Traits | ||
| Open Pollinated Varieties and Hybrid Derivatives | ||
Country
| Australia |
| Bangladesh |
| China |
| India |
| Indonesia |
| Japan |
| Myanmar |
| Pakistan |
| Philippines |
| Thailand |
| Vietnam |
| Rest of Asia-Pacific |
| Breeding Technology | Hybrids | Non-Transgenic Hybrids | |
| Transgenic Hybrids | Insect Resistant Hybrids | ||
| Other Traits | |||
| Open Pollinated Varieties and Hybrid Derivatives | |||
| Country | Australia | ||
| Bangladesh | |||
| China | |||
| India | |||
| Indonesia | |||
| Japan | |||
| Myanmar | |||
| Pakistan | |||
| Philippines | |||
| Thailand | |||
| Vietnam | |||
| Rest of Asia-Pacific | |||


Market Definition
- Commercial Seed - For the purpose of this study, only commercial seeds have been included as part of the scope. Farm-saved Seeds, which are not commercially labeled are excluded from scope, even though a minor percentage of farm-saved seeds are exchanged commercially among farmers. The scope also excludes vegetatively reproduced crops and plant parts, which may be commercially sold in the market.
- Crop Acreage - While calculating the acreage under different crops, the Gross Cropped Area has been considered. Also known as Area Harvested, according to the Food & Agricultural Organization (FAO), this includes the total area cultivated under a particular crop across seasons.
- Seed Replacement Rate - Seed Replacement Rate is the percentage of area sown out of the total area of crop planted in the season by using certified/quality seeds other than the farm-saved seed.
- Protected Cultivation - The report defines protected cultivation as the process of growing crops in a controlled environment. This includes greenhouses, glasshouses, hydroponics, aeroponics, or any other cultivation system that protects the crop against any abiotic stress. However, cultivation in an open field using plastic mulch is excluded from this definition and is included under open field.
| Keyword | Definition |
|---|---|
| Row Crops | These are usually the field crops which include the different crop categories like grains & cereals, oilseeds, fiber crops like cotton, pulses, and forage crops. |
| Solanaceae | These are the family of flowering plants which includes tomato, chili, eggplants, and other crops. |
| Cucurbits | It represents a gourd family consisting of about 965 species in around 95 genera. The major crops considered for this study include Cucumber & Gherkin, Pumpkin and squash, and other crops. |
| Brassicas | It is a genus of plants in the cabbage and mustard family. It includes crops such as carrots, cabbage, cauliflower & broccoli. |
| Roots & Bulbs | The roots and bulbs segment includes onion, garlic, potato, and other crops. |
| Unclassified Vegetables | This segment in the report includes the crops which don’t belong to any of the above-mentioned categories. These include crops such as okra, asparagus, lettuce, peas, spinach, and others. |
| Hybrid Seed | It is the first generation of the seed produced by controlling cross-pollination and by combining two or more varieties, or species. |
| Transgenic Seed | It is a seed that is genetically modified to contain certain desirable input and/or output traits. |
| Non-Transgenic Seed | The seed produced through cross-pollination without any genetic modification. |
| Open-Pollinated Varieties & Hybrid Derivatives | Open-pollinated varieties produce seeds true to type as they cross-pollinate only with other plants of the same variety. |
| Other Solanaceae | The crops considered under other Solanaceae include bell peppers and other different peppers based on the locality of the respective countries. |
| Other Brassicaceae | The crops considered under other brassicas include radishes, turnips, Brussels sprouts, and kale. |
| Other Roots & Bulbs | The crops considered under other roots & bulbs include Sweet Potatoes and cassava. |
| Other Cucurbits | The crops considered under other cucurbits include gourds (bottle gourd, bitter gourd, ridge gourd, Snake gourd, and others). |
| Other Grains & Cereals | The crops considered under other grains & cereals include Barley, Buck Wheat, Canary Seed, Triticale, Oats, Millets, and Rye. |
| Other Fibre Crops | The crops considered under other fibers include Hemp, Jute, Agave fibers, Flax, Kenaf, Ramie, Abaca, Sisal, and Kapok. |
| Other Oilseeds | The crops considered under other oilseeds include Ground nut, Hempseed, Mustard seed, Castor seeds, safflower seeds, Sesame seeds, and Linseeds. |
| Other Forage Crops | The crops considered under other forages include Napier grass, Oat grass, White clover, Ryegrass, and Timothy. Other forage crops were considered based on the locality of the respective countries. |
| Pulses | Pigeon peas, Lentils, Broad and horse beans, Vetches, Chickpeas, Cowpeas, Lupins, and Bambara beans are the crops considered under pulses. |
| Other Unclassified Vegetables | The crops considered under other unclassified vegetables include Artichokes, Cassava Leaves, Leeks, Chicory, and String beans. |


Research Methodology
Mordor Intelligence follows a four-step methodology in all our reports.
- Step-1: IDENTIFY KEY VARIABLES: In order to build a robust forecasting methodology, the variables and factors identified in Step-1 are tested against available historical market numbers. Through an iterative process, the variables required for market forecast are set and the model is built on the basis of these variables.
- Step-2: Build a Market Model: Market-size estimations for the forecast years are in nominal terms. Inflation is not a part of the pricing, and the average selling price (ASP) is kept constant throughout the forecast period.
- Step-3: Validate and Finalize: In this important step, all market numbers, variables and analyst calls are validated through an extensive network of primary research experts from the market studied. The respondents are selected across levels and functions to generate a holistic picture of the market studied.
- Step-4: Research Outputs: Syndicated Reports, Custom Consulting Assignments, Databases, and Subscription Platforms


