Market Overview
| Study Period | 2021 - 2031 |
|---|---|
| Forecast Data Period | 2026 - 2031 |
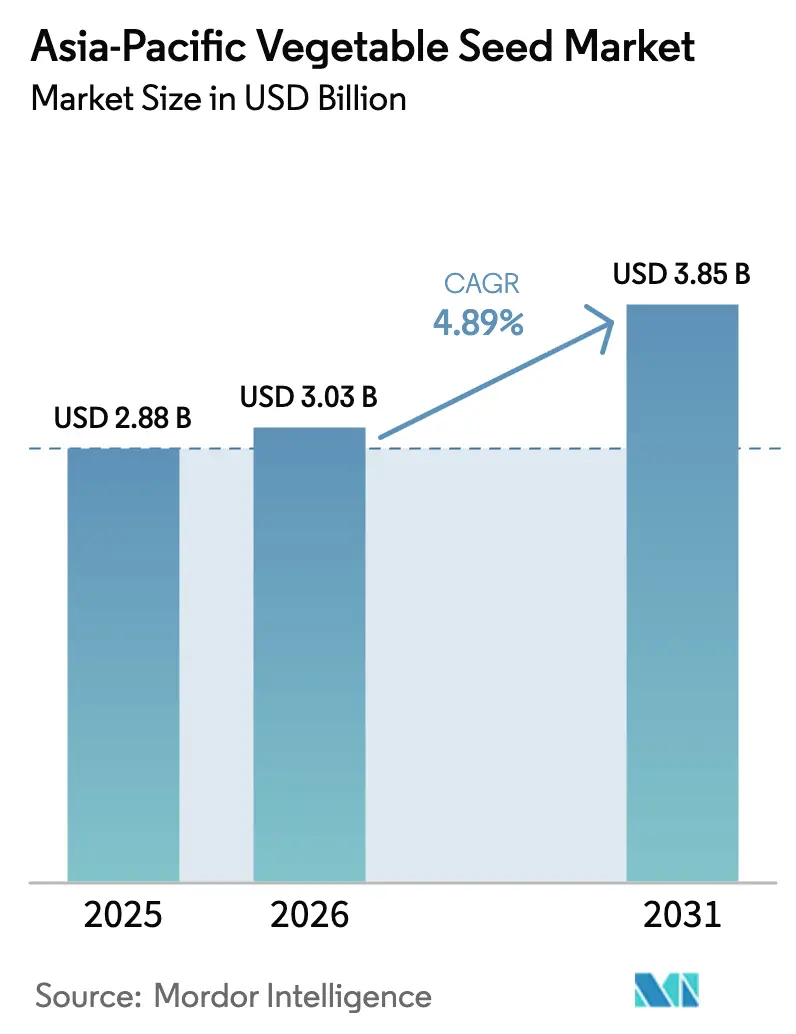
| Base Year Market Size (2025) | USD 2.88 Billion |
| Market Size (2026) | USD 3.03 Billion |
| Market Size (2031) | USD 3.85 Billion |
| Growth Rate (2026 - 2031) | 4.89% CAGR |
| Market Concentration | Medium |
Major Players
*Disclaimer: Major Players sorted in no particular order Image © Mordor Intelligence. Reuse requires attribution under CC BY 4.0. |
|
Asia-Pacific Vegetable Seed Market Analysis by Mordor Intelligence
The Asia-Pacific vegetable seed market size is anticipated to grow from USD 2.88 billion in 2025 to USD 3.03 billion in 2026 and is forecast to reach USD 3.85 billion by 2031 at a 4.9% CAGR over 2026-2031. Renewed government subsidies for hybrids, rapid expansion of protected cultivation, and artificial-intelligence-driven breeding pipelines are shifting demand away from open-pollinated varieties toward high-value hybrids. Digital traceability platforms now earn exporters price premiums, pushing seed developers to embed blockchain provenance in every batch. Urban vertical farms in China, Japan, and Singapore are scaling micro-dwarf varieties that mature in 30-40 days, accelerating seed-replacement cycles. Meanwhile, Gen Z shoppers favor nutrient-dense Brassicas and pesticide-free produce, encouraging companies to prioritize biofortification and residue-free genetics. Competitive rivalry stays moderate because regional specialists still match multinationals by releasing locally adapted hybrids faster.
Key Report Takeaways
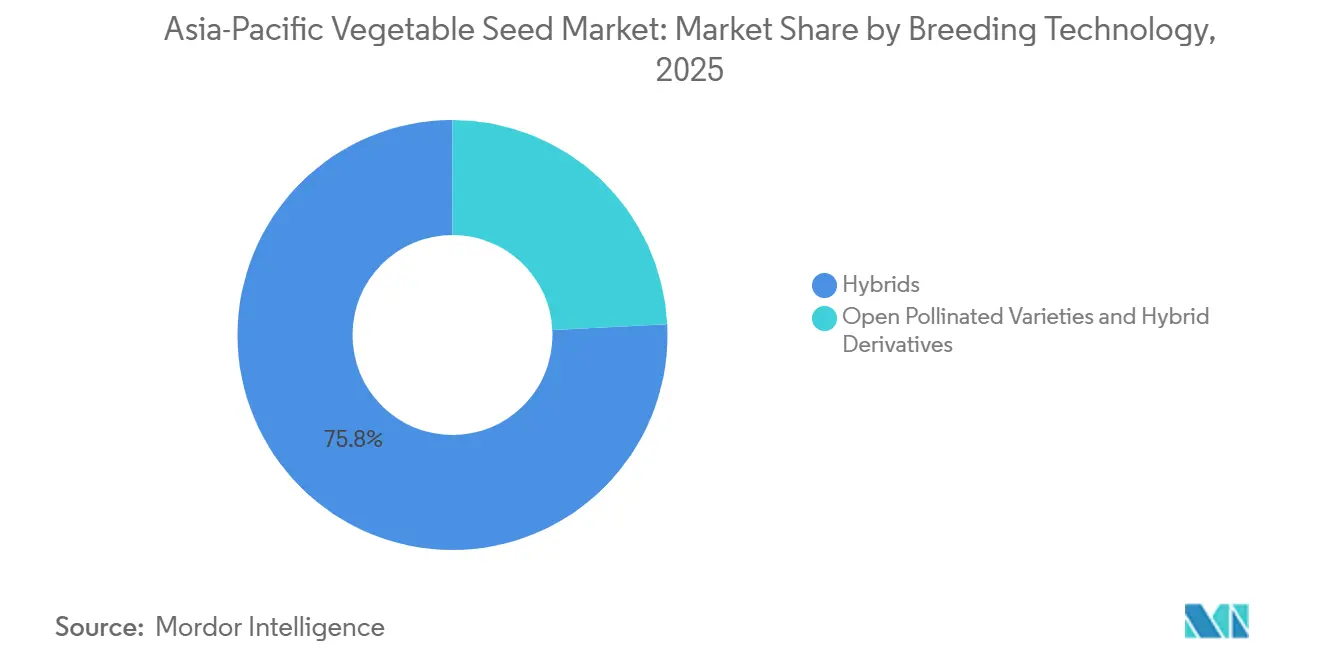
- By breeding technology, hybrids held 75.8% of the Asia-Pacific vegetable seed market share in 2025, and this segment is forecast to record the fastest 5.0% CAGR between 2026 and 2031.
- By cultivation mechanism, open-field systems accounted for 92.8% of the Asia-Pacific vegetable seed market size in 2025, whereas protected cultivation is forecast to expand at the fastest 7.1% CAGR between 2026 and 2031.
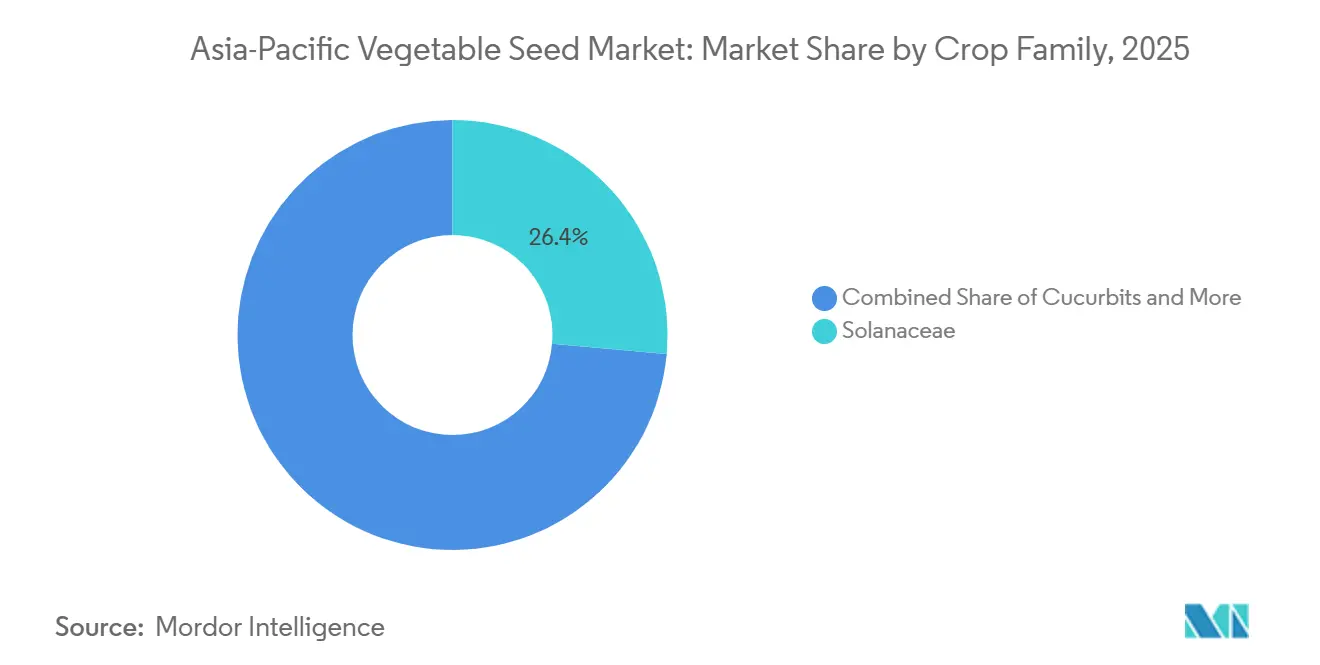
- By crop family, Solanaceae captured 26.4% revenue share in 2025, while Brassicas is the fastest-growing group with a 5.0% CAGR between 2026 and 2031.
- By geography, China commanded a 36.5% share of the Asia-Pacific vegetable seed market in 2025, while Vietnam is projected to grow at the fastest 7.0% CAGR between 2026 and 2031.
Note: Market size and forecast figures in this report are generated using Mordor Intelligence’s proprietary estimation framework, updated with the latest available data and insights as of 2026.
Asia-Pacific Vegetable Seed Market Trends and Insights
Drivers Impact Analysis*
| Driver | (~) % Impact on CAGR Forecast | Geographic Relevance | Impact Timeline |
|---|---|---|---|
| Surge in protected-cultivation acreage | +1.2% | China, India, Vietnam, Indonesia, with spillover to Thailand and Philippines | Medium term (2-4 years) |
| Hybrid-seed subsidies under national horticulture schemes | +0.9% | India, Vietnam, Indonesia, Bangladesh, and Pakistan | Short term (≤ 2 years) |
| Adoption of blockchain traceability premiums by exporters | +0.5% | China, Thailand, Vietnam, with pilot programs in Malaysia and Philippines | Medium term (2-4 years) |
| Rapid expansion of urban vertical farms requiring micro-dwarf varieties | +0.6% | China, Japan, Australia, Singapore, South Korea, with emerging adoption in India and Indonesia | Long term (≥ 4 years) |
| Dietary shift toward nutrient-dense vegetables among Gen-Z consumers | +0.7% | Urban centers across China, India, Japan, Australia, Thailand, and Vietnam | Medium term (2-4 years) |
| AI-driven genotype-to-phenotype breeding accelerating time-to-market | +0.8% | Global, with R&D hubs concentrated in China, India, Japan, and Australia | Long term (≥ 4 years) |
| Source: Mordor Intelligence | |||
Surge in protected-cultivation acreage
China leads in greenhouse operations, holding a significant share of global capacity. India has significantly expanded its polyhouse land area in recent years, supported by substantial subsidies. Vietnam continues to invest heavily in mid-scale polyhouses with ongoing financial support. Protected environments enable multiple annual tomato cycles, improving seed-replacement rates and allowing for premium pricing. Demand is focused on hybrids designed for humidity tolerance and resistance to diseases in controlled environments.
Hybrid-Seed Subsidies Under National Horticulture Schemes
India’s program reimburses a portion of hybrid seed costs for smallholders, driving increased adoption in crops like tomatoes, chilies, and cabbages. Vietnam has allocated funding for seed incentives under its Sustainable Agriculture Transformation project. Similarly, Indonesia and Bangladesh have implemented programs to reduce the price gap between hybrid seeds and farm-saved seeds. These initiatives lower entry costs, encourage repeat purchases, and boost volumes in the Asia-Pacific Vegetable Seeds Market, surpassing acreage growth.
Adoption of Blockchain Traceability Premiums by Exporters
Starting in 2026, China Customs' Announcement 219 will enforce blockchain traceability for vegetable exports[1]Source: Announcement 219, "China General Administration of Customs", customs.gov.cn. Vietnam's Ministry of Industry and Trade initiated a blockchain consortium in 2025, connecting seed companies, growers, and logistics providers. This initiative aimed to reduce documentation fraud and enable real-time quality audits. The system creates immutable records detailing seed variety, planting dates, pesticide usage, and harvest timing, which exporters use to position their produce in premium markets. Additionally, a regional program was launched to implement blockchain infrastructure across multiple countries. This effort seeks to standardize phytosanitary certification and reduce border clearance times significantly.
Dietary Shift Toward Nutrient-Dense Vegetables Among Gen Z Consumers
Health Japan 21 (Third Term), as well as the previous second term, recommends a daily vegetable intake of at least 350 grams for Japanese adults to support health and prevent lifestyle-related diseases. Social media challenges featuring vegetables like kale and broccoli significantly boosted organic vegetable sales on Chinese e-commerce platforms. Urban Gen Z consumers prioritize nutrition over price when purchasing vegetables. Their preference for traceable and residue-free food is driving the rapid turnover of premium seeds in major cities.
Restraints Impact Analysis*
| Restraint | (~) % Impact on CAGR Forecast | Geographic Relevance | Impact Timeline |
|---|---|---|---|
| Fragmented and stringent seed and GMO regulations | -0.6% | China, India, Philippines, Indonesia, and Thailand, with divergent protocols across ASEAN | Long term (≥ 4 years) |
| Counterfeit and sub-standard seed circulation | -0.8% | India, Bangladesh, Pakistan, Myanmar, and Indonesia, with spillover to rural Vietnam | Short term (≤ 2 years) |
| Climate-driven pollinator variability reducing hybrid-seed yields | -0.5% | India, Bangladesh, Pakistan, Thailand, and Vietnam, with localized impacts in China | Medium term (2-4 years) |
| Narrow genetic base raising disease-susceptibility costs | -0.4% | Global, with acute vulnerability in India, China, Bangladesh, and Indonesia | Medium term (2-4 years) |
| Source: Mordor Intelligence | |||
Fragmented and Stringent Seed and GMO Regulations
India's Genetic Engineering Appraisal Committee approved only a few genetically modified vegetables in recent years such as Bt Cotton, GM Mustard (DMH-11) in 2022 for environmental release (pre-commercialization), leading to a significant application backlog. China implemented new environmental-risk tests that have extended import approval timelines. Thailand and the Philippines continue to prohibit commercial GM vegetables, requiring multinationals to maintain hybrid portfolios. These regulatory differences increase compliance costs and delay the adoption of new traits in the Asia-Pacific Vegetable Seeds Market.
Counterfeit and Sub-Standard Seed Circulation
Counterfeit and substandard seeds continue to be a significant issue in rural India, undermining farmer trust and limiting the adoption of premium seeds. In Bangladesh, counterfeit vegetable seeds with fake packaging resembling major brands have disrupted the market. Pakistan faces challenges with low genetic purity in seeds sold by rural retailers, falling short of national standards. Myanmar struggles with unregistered seed traders operating unchecked, leading to widespread uncertified seed sales. In Indonesia, efforts to introduce a QR-code authentication system for seed verification have seen limited adoption due to low digital literacy in rural areas.
*Our forecasts treat driver/restraint impacts as directional, not additive. The impact forecasts reflect baseline growth, mix effects, and variable interactions.
Segment Analysis
By Breeding Technology: Hybrids Extend Their Lead
Hybrid lines are the largest segment that accounted for 75.8% of the Asia-Pacific vegetable seed market size in 2025 and are set to retain leadership with a fastest-growing 5.0% CAGR between 2026 and 2031. Subsidies in India, Vietnam, and Indonesia now offset up to 50% of hybrid cost, shrinking the price gap with open-pollinated lines. Artificial-intelligence-aided selection halves development cycles, letting firms launch stress-tolerant hybrids ahead of competitors. As protected acreage widens, uniform hybrid phenotype and virus resistance become indispensable for export quality.
Open-pollinated varieties and their hybrid derivatives are anticipated to grow at a slower pace due to the influence of organic certification programs and traditional seed-saving practices in Myanmar and Laos. Community seed banks help preserve local diversity, but generally do not match the yield improvements hybrids provide in intensive farming systems. Some farmers continue to use open-pollinated lines as a safeguard against fluctuating hybrid prices. Despite this, hybrids maintain a significant advantage in the Asia-Pacific Vegetable Seeds market.


By Cultivation Mechanism: Protected Systems Scale Quickly
Open-field cultivation remains the dominant segment, accounting for 92.8% of the Asia-Pacific vegetable seed market size in 2025. Its scale is supported by extensive acreage under traditional farming systems across major producing countries. However, protected cultivation is emerging as the fastest-growing segment, projected to register a 7.1% CAGR between 2026 and 2031. In peri-urban areas, where off-season produce commands premium pricing, the adoption of plastic houses and greenhouses is accelerating, supporting higher-value seed demand. Seed companies are increasingly developing greenhouse-specific varieties with traits such as compact plant architecture, multi-disease resistance, and stable fruit set under controlled conditions. These specialized seeds, often priced at a 40–60% premium, highlight how infrastructure modernization is influencing breeding priorities across the region.
The expansion of protected systems is further supported by vertical farming and climate-controlled production models, particularly in countries such as Japan and South Korea, where policy incentives encourage climate-smart agriculture. Vertical farms prioritize short-cycle, compact varieties of crops like lettuce, basil, and cucumber that perform efficiently under LED lighting and high-density planting. Although vertical farming accounts for a relatively small cultivation area, its intensive production model results in higher seed usage per square meter. Overall, the rapid growth of protected cultivation is reshaping research and development focus toward traits suited for controlled environments, reinforcing its position as the fastest-growing cultivation mechanism in the Asia-Pacific vegetable seed market.
By Crop Family: Solanaceae Dominant, Brassicas Fastest
In 2025, Solanaceae are set to dominate the market with a 26.4% share. Virus-resistant tomato hybrids already make up 35% of India’s tomato seed turnover after the 2024 leaf curl outbreak. Premium chili hybrids with more than 50,000 Scoville units earn exporters 20-25% price uplifts, widening margin for seed companies. Eggplant hybrids tolerant to bacterial wilt add acreage in Indonesia and the Philippines. Here, the allure of export opportunities to North America and Europe has spurred the development of premium varieties, boasting enhanced capsaicin content and a longer shelf life.
On the other hand, Brassicas represent the fastest-growing segment in the vegetable seed market, projected to expand at a CAGR of 5.0% between 2026 and 2031. Growth is primarily driven by rising health consciousness and increasing consumer demand for antioxidant-rich cruciferous vegetables such as cabbage, broccoli, and cauliflower. Although the segment operates within relatively mature retail markets, sustained preference for nutrient-dense diets continues to support stable pricing and consistent seed demand.
Geography Analysis
China’s lead with 36.5% market share due to extensive greenhouse coverage and the implementation of mandatory blockchain traceability for exports. State funding for vertical farms further strengthened its urban seed niche. India followed closely, supported by government reimbursements for hybrid costs, which boosted the adoption of key crops. Japan leveraged advanced indoor farming technologies to produce significant quantities of leafy greens.
Vietnam's emergence as the fastest-growing market at 7.0% CAGR between 2026-2031 reflects rapid agricultural modernization supported by foreign direct investment and export-oriented production strategies. It is also driven by subsidies promoting polyhouse construction. Thailand capitalized on blockchain technology to secure export premiums, encouraging local seed firms to digitize provenance. Indonesia focused on reducing vegetable imports through subsidies for seeds and greenhouse inputs. The Philippines expanded its protected cultivation area, spurring hybrid seed adoption.
Bangladesh, Pakistan, and Myanmar face challenges with counterfeit seeds, but growth is anticipated due to quality-control reforms. South Korea, Taiwan, Malaysia, and Singapore collectively contributed to the market, with Singapore's urban farming incentives increasing local vegetable production[2]Source: Singapore Food Agency, "Urban Farming Investment 2024", sfa.gov.sg. Australia’s development of heat-tolerant crops reflects rising demand under changing climatic conditions. These developments underscore the geographical diversification of the Asia-Pacific Vegetable Seeds Market.
Competitive Landscape
In 2025, the top suppliers secured a significant share of regional sales, indicating a moderately concentrated market. Bayer, Syngenta, and BASF leverage global research budgets to introduce pest-resistant hybrids. In contrast, East-West Seed, Sakata, and Rijk Zwaan focus on developing germplasm tailored for tropical smallholders[3]Source: East-West Seed, "Southeast Asia Revenue Report 2025", eastwestseed.com. Regional players like Namdhari Seeds and VNR Seeds utilize extensive dealer networks and local languages, enabling quicker feedback and faster variety turnover. Meanwhile, joint ventures between seed producers and greenhouse operators are increasing, targeting hydroponic-friendly lettuce and tomato lines in key markets.
Technology plays a pivotal role in this landscape. Bayer’s platform analyzes multispectral data to identify heat-tolerant genotypes. Syngenta combines CRISPR technology with machine learning to produce tomato hybrids resistant to the tomato brown rugose fruit virus, achieving this faster than traditional methods. In a notable collaboration, Rijk Zwaan partnered with a vertical-farm chain to co-design a compact lettuce variety that matures rapidly. Companies lagging in digitizing their R&D processes face the risk of losing prime shelf space, especially as traceability and rapid breeding become industry norms.
Efforts to combat counterfeiting further distinguish industry leaders. Advanta is set to roll out blockchain-enabled QR codes, allowing farmers to verify seed packet authenticity. Simultaneously, Corteva's acquisition of a stake in a Thai breeder secures localized germplasm tailored for the humid tropics. Known-You Seed and Nongwoo Bio are making strides in exports by adhering to stringent purity standards set by key markets. While multinationals continue to eye strategic acquisitions, challenges like valuation discrepancies and scrutiny from antitrust regulators are curbing large-scale mergers, thereby creating opportunities for nimble specialists in the Asia-Pacific Vegetable Seeds Market.
Asia-Pacific Vegetable Seed Industry Leaders
-
Bayer AG
-
Syngenta Group
-
BASF SE
-
Rijk Zwaan Zaadteelt en Zaadhandel BV
-
Groupe Limagrain
- *Disclaimer: Major Players sorted in no particular order

Recent Industry Developments
- March 2025: Advanta Seeds and KPAGRO have opened a sweet corn seed drying facility in Lopburi, Thailand, strengthening their 19-year partnership. The facility features automated intake systems, centralized heating, and SCADA monitoring capabilities, enhancing Thailand's position in tropical sweet corn seed production.
- November 2024: Crystal Crop Protection acquired IB Seeds to expand its presence in the vegetable and flower seed segments. This acquisition strengthens the company's research and development capabilities and product portfolio while advancing its expansion into India's horticulture markets.
- March 2024: Syngenta Vegetable Seeds opened a new Seed Health Lab in Hyderabad, India, to improve seed quality testing and support growers across Asia-Pacific and other regions. The facility, constructed at INR 20 crore (USD 2.4 million), has the capacity to conduct 12,000 virus and bacterial tests annually and complies with global phytosanitary standards.


Asia-Pacific Vegetable Seed Market Report Scope
A vegetable seed is a reproductive unit of a vegetable plant that contains the embryo and stored nutrients required to grow into a mature plant under suitable conditions. It is used in agriculture and horticulture to cultivate vegetables for commercial production and consumption.
The Asia-Pacific Vegetable Seed Market Report provides a comprehensive analysis based on breeding technology, covering hybrids, open pollinated varieties, and hybrid derivatives. It further examines the market by cultivation mechanism, including open field and protected cultivation, and by crop family, such as Solanaceae, Brassicas, Cucurbits, and other categories. Geographically, the study spans key countries including Australia, Bangladesh, China, India, Indonesia, and others. Market estimates and forecasts are expressed in USD for value and in metric tons for volume.
By Breeding Technology
| Hybrids |
| Open Pollinated Varieties and Hybrid Derivatives |
By Cultivation Mechanism
| Open Field |
| Protected Cultivation |
By Crop Family
| Brassicas | Cabbage |
| Carrot | |
| Cauliflower and Broccoli | |
| Other Brassicas | |
| Cucurbits | Cucumber and Gherkin |
| Pumpkin and Squash | |
| Other Cucurbits | |
| Roots and Bulbs | Garlic |
| Onion | |
| Potato | |
| Other Roots and Bulbs | |
| Solanaceae | Chilli |
| Eggplant | |
| Tomato | |
| Other Solanaceae | |
| Unclassified Vegetables | Asparagus |
| Lettuce | |
| Okra | |
| Peas | |
| Spinach | |
| Other Unclassified Vegetables |
By Geography
| Australia |
| Bangladesh |
| China |
| India |
| Indonesia |
| Japan |
| Myanmar |
| Pakistan |
| Philippines |
| Thailand |
| Vietnam |
| Rest of Asia-Pacific |
| By Breeding Technology | Hybrids | |
| Open Pollinated Varieties and Hybrid Derivatives | ||
| By Cultivation Mechanism | Open Field | |
| Protected Cultivation | ||
| By Crop Family | Brassicas | Cabbage |
| Carrot | ||
| Cauliflower and Broccoli | ||
| Other Brassicas | ||
| Cucurbits | Cucumber and Gherkin | |
| Pumpkin and Squash | ||
| Other Cucurbits | ||
| Roots and Bulbs | Garlic | |
| Onion | ||
| Potato | ||
| Other Roots and Bulbs | ||
| Solanaceae | Chilli | |
| Eggplant | ||
| Tomato | ||
| Other Solanaceae | ||
| Unclassified Vegetables | Asparagus | |
| Lettuce | ||
| Okra | ||
| Peas | ||
| Spinach | ||
| Other Unclassified Vegetables | ||
| By Geography | Australia | |
| Bangladesh | ||
| China | ||
| India | ||
| Indonesia | ||
| Japan | ||
| Myanmar | ||
| Pakistan | ||
| Philippines | ||
| Thailand | ||
| Vietnam | ||
| Rest of Asia-Pacific | ||


Market Definition
- Commercial Seed - For the purpose of this study, only commercial seeds have been included as part of the scope. Farm-saved Seeds, which are not commercially labeled are excluded from scope, even though a minor percentage of farm-saved seeds are exchanged commercially among farmers. The scope also excludes vegetatively reproduced crops and plant parts, which may be commercially sold in the market.
- Crop Acreage - While calculating the acreage under different crops, the Gross Cropped Area has been considered. Also known as Area Harvested, according to the Food & Agricultural Organization (FAO), this includes the total area cultivated under a particular crop across seasons.
- Seed Replacement Rate - Seed Replacement Rate is the percentage of area sown out of the total area of crop planted in the season by using certified/quality seeds other than the farm-saved seed.
- Protected Cultivation - The report defines protected cultivation as the process of growing crops in a controlled environment. This includes greenhouses, glasshouses, hydroponics, aeroponics, or any other cultivation system that protects the crop against any abiotic stress. However, cultivation in an open field using plastic mulch is excluded from this definition and is included under open field.
| Keyword | Definition |
|---|---|
| Row Crops | These are usually the field crops which include the different crop categories like grains & cereals, oilseeds, fiber crops like cotton, pulses, and forage crops. |
| Solanaceae | These are the family of flowering plants which includes tomato, chili, eggplants, and other crops. |
| Cucurbits | It represents a gourd family consisting of about 965 species in around 95 genera. The major crops considered for this study include Cucumber & Gherkin, Pumpkin and squash, and other crops. |
| Brassicas | It is a genus of plants in the cabbage and mustard family. It includes crops such as carrots, cabbage, cauliflower & broccoli. |
| Roots & Bulbs | The roots and bulbs segment includes onion, garlic, potato, and other crops. |
| Unclassified Vegetables | This segment in the report includes the crops which don’t belong to any of the above-mentioned categories. These include crops such as okra, asparagus, lettuce, peas, spinach, and others. |
| Hybrid Seed | It is the first generation of the seed produced by controlling cross-pollination and by combining two or more varieties, or species. |
| Transgenic Seed | It is a seed that is genetically modified to contain certain desirable input and/or output traits. |
| Non-Transgenic Seed | The seed produced through cross-pollination without any genetic modification. |
| Open-Pollinated Varieties & Hybrid Derivatives | Open-pollinated varieties produce seeds true to type as they cross-pollinate only with other plants of the same variety. |
| Other Solanaceae | The crops considered under other Solanaceae include bell peppers and other different peppers based on the locality of the respective countries. |
| Other Brassicaceae | The crops considered under other brassicas include radishes, turnips, Brussels sprouts, and kale. |
| Other Roots & Bulbs | The crops considered under other roots & bulbs include Sweet Potatoes and cassava. |
| Other Cucurbits | The crops considered under other cucurbits include gourds (bottle gourd, bitter gourd, ridge gourd, Snake gourd, and others). |
| Other Grains & Cereals | The crops considered under other grains & cereals include Barley, Buck Wheat, Canary Seed, Triticale, Oats, Millets, and Rye. |
| Other Fibre Crops | The crops considered under other fibers include Hemp, Jute, Agave fibers, Flax, Kenaf, Ramie, Abaca, Sisal, and Kapok. |
| Other Oilseeds | The crops considered under other oilseeds include Ground nut, Hempseed, Mustard seed, Castor seeds, safflower seeds, Sesame seeds, and Linseeds. |
| Other Forage Crops | The crops considered under other forages include Napier grass, Oat grass, White clover, Ryegrass, and Timothy. Other forage crops were considered based on the locality of the respective countries. |
| Pulses | Pigeon peas, Lentils, Broad and horse beans, Vetches, Chickpeas, Cowpeas, Lupins, and Bambara beans are the crops considered under pulses. |
| Other Unclassified Vegetables | The crops considered under other unclassified vegetables include Artichokes, Cassava Leaves, Leeks, Chicory, and String beans. |


Research Methodology
Mordor Intelligence follows a four-step methodology in all our reports.
- Step-1: IDENTIFY KEY VARIABLES: In order to build a robust forecasting methodology, the variables and factors identified in Step-1 are tested against available historical market numbers. Through an iterative process, the variables required for market forecast are set and the model is built on the basis of these variables.
- Step-2: Build a Market Model: Market-size estimations for the forecast years are in nominal terms. Inflation is not a part of the pricing, and the average selling price (ASP) is kept constant throughout the forecast period.
- Step-3: Validate and Finalize: In this important step, all market numbers, variables and analyst calls are validated through an extensive network of primary research experts from the market studied. The respondents are selected across levels and functions to generate a holistic picture of the market studied.
- Step-4: Research Outputs: Syndicated Reports, Custom Consulting Assignments, Databases, and Subscription Platforms


