
Market Overview
| Study Period | 2020 - 2031 |
|---|---|
| Forecast Data Period | 2026 - 2031 |
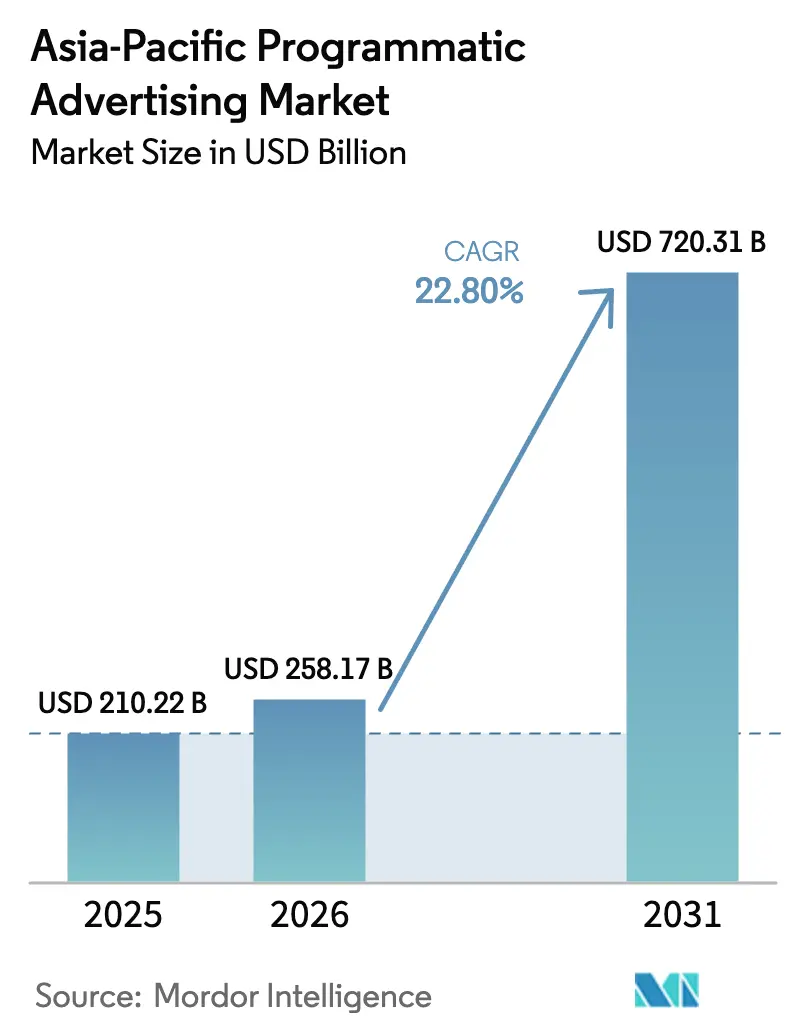
| Base Year Market Size (2025) | USD 210.22 Billion |
| Market Size (2026) | USD 258.17 Billion |
| Market Size (2031) | USD 720.31 Billion |
| Growth Rate (2026 - 2031) | 22.80 % |
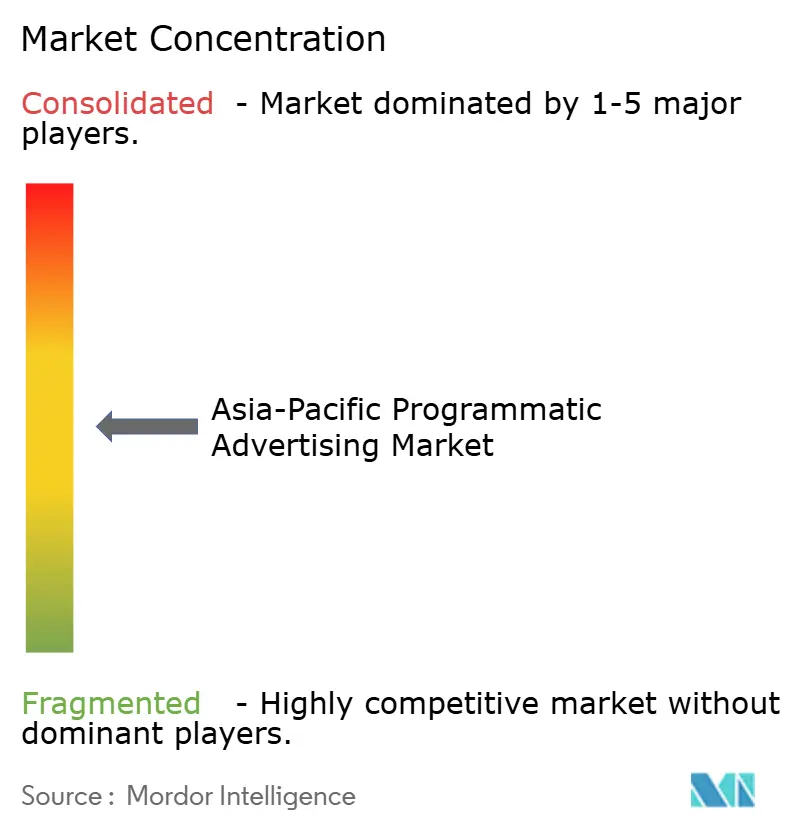
| Market Concentration | Medium |
Major Players *Disclaimer: Major Players sorted in no particular order Image © Mordor Intelligence. Reuse requires attribution under CC BY 4.0. | |
Asia-Pacific Programmatic Advertising Market Analysis by Mordor Intelligence
The Asia-Pacific programmatic advertising market size is expected to grow from USD 210.22 billion in 2025 to USD 258.17 billion in 2026 and is forecast to reach USD 720.31 billion by 2031 at 22.8% CAGR over 2026-2031. Current growth is fueled by rapid mobile adoption, 5G roll-outs, and the measurable returns that programmatic delivers over traditional media.[1]Digital Turbine Investor Relations, “Mobile Growth Press Releases,” digitalturbine.com Advertisers are reallocating budgets toward automated buying models that blend auction efficiency with inventory certainty, while publishers monetize new formats such as connected TV (CTV) and programmatic digital out-of-home (pDOOH). Government digital-economy agendas, especially in China, India, and South Korea, are expanding premium ad supply, and AI-driven optimization is helping brands manage language and cultural diversity at scale. Competitive intensity is rising as regional specialists use vernacular data and contextual algorithms to close performance gaps left by global platforms. Sustainability metrics, notably carbon-emission dashboards embedded in ad platforms, are emerging as a differentiator for responsible brand spending.[2]LoopMe, “LoopMe Partners with Cedara,” loopme.com
Key Report Takeaways
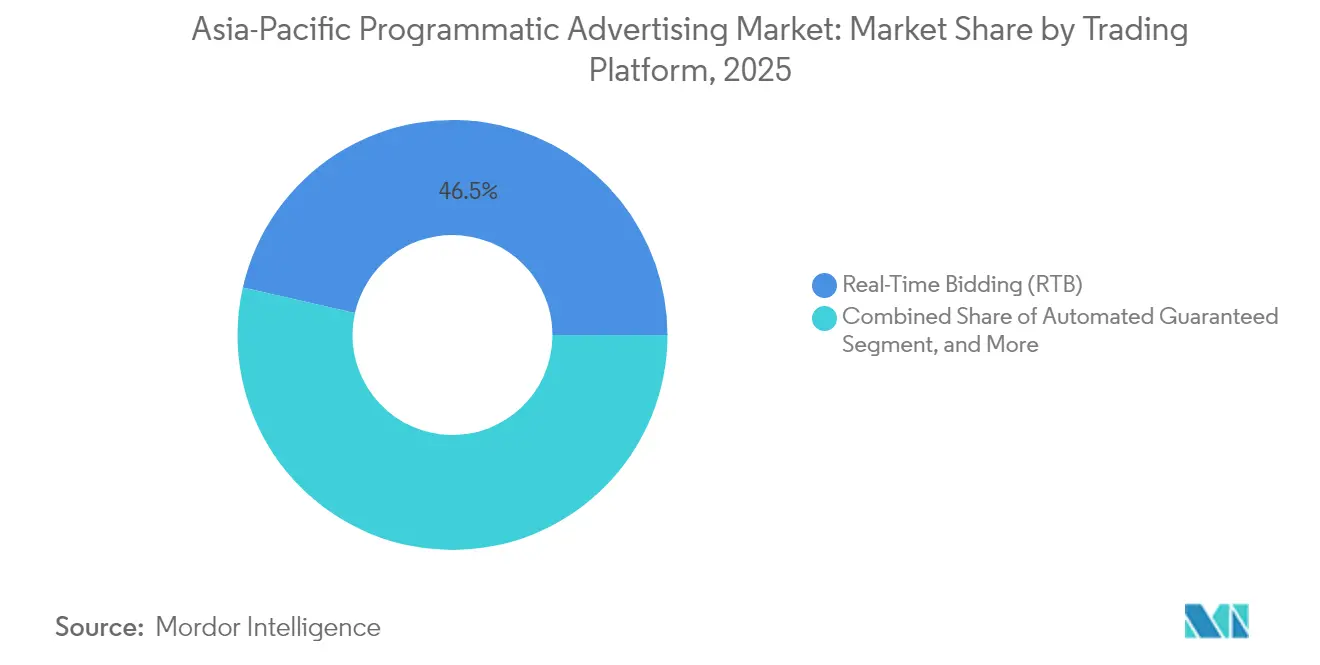
- By trading platform, Real-Time Bidding led with a 46.45% revenue share of the Asia-Pacific programmatic advertising market in 2025; Automated Guaranteed is projected to expand at a 24.06% CAGR through 2031.
- By advertising media, Mobile Display captured 49.10% of the Asia-Pacific programmatic advertising market share in 2025, while Connected TV/OTT is forecast to surge at a 24.5% CAGR to 2031.
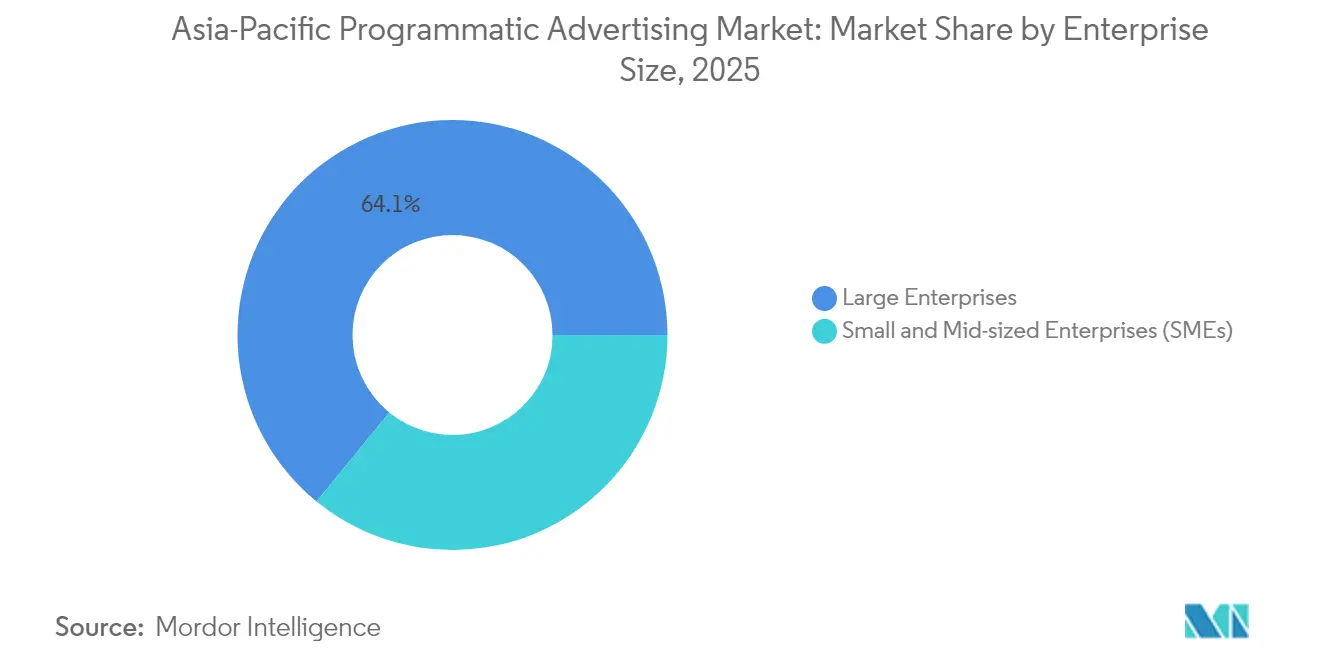
- By enterprise size, Large Enterprises accounted for 64.10% of the Asia-Pacific programmatic advertising market size in 2025, and Small and Mid-sized Enterprises are growing at a 23.57% CAGR through 2031.
- By industry vertical, E-commerce and Retail commanded 29.70% of spending of the Asia-Pacific programmatic advertising market in 2025; Travel and Hospitality is advancing at a 24.7% CAGR through 2031.
- By geography, China held a 42.05% share of the Asia-Pacific programmatic advertising market size in 2025, whereas India is forecast to expand at a 24.6% CAGR between 2026-2031.
Note: Market size and forecast figures in this report are generated using Mordor Intelligence’s proprietary estimation framework, updated with the latest available data and insights as of 2026.
Market Trends and Insights
Drivers Impact Analysis of Asia-Pacific Programmatic Advertising Market*
| Driver | (~) % Impact on CAGR Forecast | Geographic Relevance | Impact Timeline |
|---|---|---|---|
| Rapid shift of Asia Pacific ad budgets from traditional to digital channels | +6.2% | Global Asia-Pacific, strongest in China and India | Medium term (2-4 years) |
| Mobile-first user base fuelling in-app inventory growth | +5.8% | Southeast Asia core, spill-over to broader Asia-Pacific | Short term (≤ 2 years) |
| Government-led 5G roll-outs expanding high-quality ad slots | +4.1% | China, South Korea, Japan, expanding to India and Southeast Asia | Long term (≥ 4 years) |
| Rising adoption of AI/ML for real-time campaign optimisation | +3.9% | Technology hubs: Singapore, Hong Kong, Tokyo, expanding regionally | Medium term (2-4 years) |
| Brand-safety algorithms tailored for Asian languages and cultures | +2.1% | Multi-language markets: India, Southeast Asia, China | Medium term (2-4 years) |
| Emergence of programmatic digital out-of-home networks in tier-2 Asian cities | +1.4% | Tier-2 cities across China, India, Indonesia, Thailand | Long term (≥ 4 years) |
| Source: Mordor Intelligence | |||
Rapid shift of ad budgets to digital channels
Digital media captured a larger share of advertising spend across Asia-Pacific in 2025 as brands pursued measurable, audience-level outcomes that traditional media struggled to deliver.[3]Dentsu Global, “Digital Advertising Growth Trends in Asia-Pacific,” dentsu.com Programmatic platforms benefited as marketers adopted attribution tools that optimize cross-channel journeys in real time. Markets with historically limited linear TV reach, such as Indonesia and Vietnam, leapfrogged directly into mobile-led programmatic models. Regulators reinforced the shift by mandating transparency and data-access standards that favor automated trading. As a result, programmatic now attracts even brand-building budgets that once defaulted to television, widening the addressable pool of spend.
Mobile-first ecosystem fuels in-app inventory
Mobile devices generate more impressions than desktops across every major APAC market, making in-app ad space the prime real estate for the Asia-Pacific programmatic advertising market. Higher engagement rates and richer behavioral data raise bid density and effective CPMs. Partnerships such as AnyMind Group with InMobi yielded 4.3× year-over-year revenue gains for publishers by automating mediation across demand sources. Advertisers are layering geo-location and app-usage signals to serve real-time offers near stores, while publishers roll out rewarded video and playable formats that drive completion rates above 90%. The depth of mobile data also supports privacy-compliant look-alike modeling that compensates for cookie deprecation on browsers.
AI and machine learning transform optimization
Sophisticated AI models now analyze user intent, lifetime value, and contextual cues in milliseconds, improving bid accuracy and creative relevance. Appier embedded generative AI features after acquiring AdCreative.ai, enabling dynamic asset iteration tailored to local languages and cultural references. These models predict conversion likelihood and throttle spend to the highest-value audiences, shrinking waste and raising return on ad spend. AI also automates fraud filtering and brand-safety enforcement, critical for campaigns spanning thousands of small publishers across multiple scripts. Early adopters report double-digit lift in conversion rates and cost-per-action reductions, reinforcing AI as a default capability for platforms serving the Asia-Pacific programmatic advertising market.
Government 5G roll-outs create premium inventory
Governments in China, South Korea, and Japan have accelerated 5G deployment, unlocking high-bandwidth ad formats such as interactive video and AR overlays that command premium pricing. Faster networks lower latency in real-time bidding and improve verification pings, reducing discrepancies. They also enhance GPS accuracy, enabling hyper-local retail activations. In emerging markets, planned 5G expansions promise to leapfrog fixed-line limitations, widening rural audience reach for programmatic campaigns. Publishers expect 5G video to raise completion rates, while advertisers can deploy immersive storytelling without buffering risks, strengthening brand affinity, and justifying higher CPMs.
Restraints Impact Analysis of Asia-Pacific Programmatic Advertising Market*
| Restraint | (~) % Impact on CAGR Forecast | Geographic Relevance | Impact Timeline |
|---|---|---|---|
| Fragmented data privacy regulations across the Asia-Pacific markets | -3.2% | Regional fragmentation, strongest impact in China, India, Singapore | Medium term (2-4 years) |
| Shortage of skilled programmatic talent outside top metro areas | -2.1% | Tier-2 and tier-3 cities across Asia-Pacific, rural markets | Long term (≥ 4 years) |
| Browser and OEM-level restrictions on device IDs in China and India | -1.8% | China and India primarily, potential expansion to other markets | Short term (≤ 2 years) |
| Limited premium local inventory for vernacular content in South-East Asia | -1.3% | Southeast Asia, particularly Indonesia, Thailand, Vietnam | Medium term (2-4 years) |
| Source: Mordor Intelligence | |||
Fragmented privacy regulations add compliance cost
Divergent data-protection laws force platforms to maintain market-specific consent flows, data shores, and reporting templates, inflating overheads and delaying campaign launches. Larger vendors absorb the burden through dedicated legal teams, while smaller players risk fines or exit less-profitable markets. Cross-border campaigns must often partition user data, reducing scale advantages. Advertisers, wary of penalties, favor partners with audited compliance credentials, concentrating spend and potentially limiting innovation from startups.
Talent shortage outside top metros hampers scaling
Expertise in demand-side platforms, data analysis, and advanced creative optimization remains scarce beyond major hubs like Singapore, Tokyo, and Mumbai. This gap slows adoption among local brands in fast-growing secondary cities despite rising digital budgets. Agencies struggle to recruit certified traders, and turnover remains high as specialists migrate to higher-paying regional roles. E-learning programs and vendor academies are expanding, but skill pipelines will take several years to meet demand, tempering growth in underserved markets.
*Our forecasts treat driver/restraint impacts as directional, not additive. The impact forecasts reflect baseline growth, mix effects, and variable interactions.
Asia-Pacific Programmatic Advertising Market Segment Analysis
By Trading Platform:
Advertisers balance certainty with auction efficiencyReal-Time Bidding represents the largest slice of the Asia-Pacific programmatic advertising market at 46.45% revenue share in 2025, reflecting its flexibility and dynamic pricing benefits. The segment’s scale stems from open exchange liquidity and sophisticated bid-shading tools that minimize overpayment. However, inventory quality concerns and brand-safety requirements have led premium advertisers to commit budgets through Automated Guaranteed, which is growing at a 24.06% CAGR. The Asia-Pacific programmatic advertising market share for Automated Guaranteed is rising as publishers package high-visibility placements with fixed rates, ensuring predictable delivery during peak events. Private Marketplace Guaranteed straddles both models, letting buyers access curated impressions with preferential terms, while Unreserved Fixed-Rate remains a niche option for campaigns prioritizing rate stability over reach.
Hybrid buying strategies are emerging: brands start with a guaranteed block to secure prime slots, then chase incremental reach via RTB as frequency caps are met. Platform integrations, such as X deploying Magnite to monetize remnant social inventory, illustrate how publishers blend direct and auction channels to maximize yield. The outcome is a trading landscape where buyers flex between certainty and efficiency, broadening revenue streams across platform types.



By Advertising Media:
CTV and pDOOH supplement mobile dominanceMobile Display holds 49.10% of the Asia-Pacific programmatic advertising market size due to smartphone ubiquity and superior engagement metrics. Deep in-app data and first-party identifiers reinforce mobile’s targeting edge, while rewarded and playable ads drive performance for gaming and commerce apps. Connected TV/OTT, though smaller today, is scaling at a 24.5% CAGR as viewers migrate from linear TV to streaming. Programmatic pipes now plug into local broadcasters and over-the-top services, letting brands execute audience buys across large-screen environments once reserved for upfront deals. Digital Display on desktop maintains pockets of influence in office-centric segments, whereas pDOOH is reinventing outdoor with dynamic scheduling tied to audience movement patterns.
Samsung’s healthcare pDOOH campaign with Hivestack synchronized mobile retargeting, showcasing omnichannel storytelling that boosts recall and lifts foot traffic. As broadband penetration widens, CTV ad loads rise, and household co-viewing provides incremental reach. Advertisers, therefore, allocate budgets across screens, reinforcing omnichannel measurement tools that stitch exposures into unified frequency caps.
By Enterprise Size:
Self-service unlocks SME growthLarge enterprises commanded 64.10% of 2025 spend, leveraging cross-market data lakes and private marketplaces for scale. Yet SMEs are the fastest-growing customer cohort, expanding at 23.57% annually as intuitive dashboards remove technical barriers. Retail-media networks embed programmatic modules into merchant portals, letting small sellers extend on-site promotions to off-site inventory with a few clicks. For instance, PubMatic’s Tokopedia link enables Indonesian merchants to target high-intent audiences beyond the marketplace. The Asia-Pacific programmatic advertising market size generated by SMEs is set to climb as minimum IOs drop and AI-guided setup templates suggest bid ceilings, creatives, and audiences.
Vendor roadmaps prioritize simplified UX, one-click pixel integration, and automatic conversion optimization to cater to resource-constrained businesses. As SMEs gain confidence, many progress from lower-funnel retargeting to upper-funnel brand building, diversifying spend across video, CTV, and pDOOH.
By Industry Vertical:
Travel rebounds, retail sustains leadershipE-commerce and Retail accounted for 29.70% of 2025 spend, driven by always-on customer acquisition, cart-abandon retargeting, and loyalty upsells. On-platform ads deliver closed-loop attribution, making budgets highly defensible. Travel and Hospitality is the breakout vertical, posting a 24.7% CAGR as borders reopened and consumers resumed booking trips. Airlines and tourism boards deploy dynamic deals based on seat inventory and search trends, capitalizing on programmatic’s speed. BFSI maintains steady investment in data-driven acquisition for credit-card and loan products, while Automotive pivots to lead generation for electric-vehicle launches. Healthcare, education, and tech round out the “other” category, each gradually increasing programmatic mix as compliance frameworks mature.
Retailers themselves are doubling as media owners: Southeast Asia’s retail-media revenues are projected at USD 4.7 billion by 2030, with Indonesia growing 219% as marketplaces monetize first-party shopper data. This convergence of advertiser and publisher roles reshapes buying models and expands programmatic inventory pools.
Geography Analysis
China Programmatic Advertising Market
China contributed 42.05% of the Asia-Pacific programmatic advertising market in 2025, thanks to super-apps that unify social, payments, and commerce. China remains the largest contributor to the Asia-Pacific programmatic advertising market size, yet its pace is settling as Personal Information Protection Law compliance raises operating thresholds. Super-app ecosystems still deliver unrivaled reach and data richness, particularly in commerce-linked ad units, and tier-2 cities add incremental inventory as 5G and pDOOH footprints expand. Foreign platforms continue to face entry barriers, but domestic rivals compete vigorously on AI features and carbon-reporting add-ons, ensuring ongoing innovation.
India Programmatic Advertising Market
Affordable data plans underpin India’s 24.6% CAGR through 2031, UPI payment ubiquity, and government digital-service portals that onboard new internet users daily. India is the fastest-growing geography, propelled by surging smartphone adoption, nationwide digital-infrastructure projects, and a maturing data-privacy law that clarifies compliance expectations. Vernacular content formats thrive, and programmatic engines segment audiences across more than 20 official languages. Rural penetration gains, coupled with low-cost Android devices, bring newcomers online, enlarging impression pools. Local DSPs with language-aware categorization challenge global incumbents, and the government’s Open Network for Digital Commerce hints at future first-party data opportunities for advertisers.
APAC Programmatic Advertising Market
Japan, South Korea, and Australia offer advanced but saturated environments where value creation depends on sophisticated measurement, CTV expansion, and cross-device frequency controls. These markets pioneer privacy-safe identity frameworks that avoid cookies, setting templates for broader regional rollout. Southeast Asian countries Thailand, Singapore, and Malaysia show double-digit growth as broadband access widens and cross-border e-commerce rises. Regional players leverage cultural fluency to win brand budgets, while investment flows into local content studios to boost premium inventory. Fragmented regulations remain a hurdle for campaign orchestration across borders, necessitating modular compliance stacks within DSPs.
Regulatory Landscape
Regulation in Asia-Pacific programmatic advertising is tightening around platform accountability, ad verification, and fraud prevention, which adds compliance steps to cross-border buying. In China, the China Advertising Association and China Communications Standards Association implemented T/CCSA 553-2024 / T/CAAAD 006-2024 in October 2024 to standardize internet advertising monitoring and verification, reinforcing local requirements for viewability and invalid-traffic detection that shape how DSPs, SSPs, and verification vendors operate in-market.
Several markets introduced new obligations that affect digital advertising platforms and programmatic workflows. Taiwan’s Ministry of Digital Affairs implemented subsidiary regulations under the Fraud Crime Hazard Prevention Act in November 2024, placing information-disclosure and fraud-prevention duties on large-scale internet advertising platforms. Vietnam issued Decree 342/2025/ND-CP in December 2025 (effective February 15, 2026) to update rules for online advertisements and digital signage. Thailand’s Technology Crime Prevention Measures (No. 2) also requires identity verification for advertisers on digital advertising platforms, effective November 1, 2026, which increases KYC-like requirements for onboarding and campaign activation.
Value Chain Analysis
The value chain starts with advertisers (brands, app publishers, marketplaces, and SMEs) and agencies defining objectives, budget, and creatives, then routes demand through DSPs and buying platforms into exchanges and SSPs. On the supply side, publishers (mobile apps, web publishers, CTV/OTT services, and DOOH network operators) expose inventory via ad servers and SSPs, while verification and measurement providers sit across the chain for fraud detection, viewability, and brand safety. As of 2025, web supply in several APAC markets is heavily intermediated by scaled platforms such as Google AdExchange, while SSP leadership can vary by channel and country, pushing buyers toward active supply-path optimization rather than one-size-fits-all buying.
Data and identity services (first-party data, contextual signals, and privacy-safe IDs) and infrastructure (cloud, content delivery, and device/OEM surfaces) are key inputs that influence match rates and performance, particularly as browser and OEM-level restrictions constrain device IDs in parts of the region. Partnerships are increasingly used to secure premium video and commerce-linked signals: FreeWheel and Innity (June 2025) aligned around premium CTV and online video in Southeast Asia and Hong Kong, Geniee and Mediagene (October 2025) connected rich media creative automation with SSP supply, and TNL Mediagene partnered with Coupang (November 2025) to connect content commerce and retail media. Bottlenecks persist around fragmented national compliance and high invalid traffic risk in CTV, which increases the role of verification, curated supply, and SPO tooling such as IAB Tech Lab supply-chain transparency practices.
Competitive Landscape
The Asia-Pacific programmatic advertising market features mid-level concentration; top global exchanges, demand-side platforms, and ad-verification suites coexist with regional specialists tuned to local scripts and consumer behaviors. Market share leadership differs by country, creating a mosaic where one player rarely exceeds 25% share region-wide. Technology innovation, rather than inventory exclusivity, is the prime battleground: AI-native platforms tout cost-efficient user-acquisition models, while incumbents emphasize scaled identity graphs and brand-safety credentials.
Fragmentation is most evident in emerging markets, where language fragmentation and vernacular video surge. Companies such as SQREEM gain traction by offering cookie-less behavioral targeting aligned with local privacy rules. Meanwhile, environmental accountability grows; LoopMe’s integration of Cedara’s carbon dashboard positions it favorably with sustainability-focused advertisers. Competitive moves also highlight vertical integration. Digital Turbine embeds app-discovery ads at the device level, while PubMatic partners with marketplaces to broaden commerce signal access. Patent filings across AI bidding and privacy-preserving analytics point to fierce IP defense. Scale players leverage compliance investments to navigate multi-country laws, setting a high bar for smaller entrants and nudging the market toward gradual consolidation around identity-secure, multilingual platforms.
Local acquisitions continue: Catcha Digital’s stake in Digital Symphony boosts regional omnichannel reach, whereas FreakOut’s UUUM purchase bundles influencer marketing into programmatic offers. These tie-ups reflect advertiser demand for holistic solutions spanning social, video, and outdoor. Vendors that unify activation, measurement, and carbon tracking under one login are best placed to capture incremental budgets.
Asia-Pacific Programmatic Advertising Industry Leaders
Amazon.com LLC (Amazon Advertising)
Appier Inc.
Aarki, Inc.
Adform A/S
AnyMind Group Pte. Ltd.
- *Disclaimer: Major Players sorted in no particular order
Asia-Pacific Programmatic Advertising Market Companies Covered in this Report
- Amazon.com LLC (Amazon Advertising)
- Appier Inc.
- Aarki, Inc.
- Adform A/S
- AnyMind Group Pte. Ltd.
- Criteo S.A.
- Digital Turbine, Inc.
- FreakOut Holdings, Inc.
- Google LLC
- Hivestack Inc.
- Index Exchange Inc.
- InMobi Pte. Ltd.
- Integral Ad Science Holding Corp.
- Komli Media India Private Ltd.
- LoopMe Ltd.
- Magnite, Inc.
- MediaMath, Inc.
- Moloco, Inc.
- PubMatic, Inc.
- Smaato, Inc.
- The Trade Desk, Inc.
- Xandr LLC
Read Analysis of Asia-Pacific Programmatic Advertising Companies

Market Opportunities and Future Outlook
CTV/OTT and premium online video are clear whitespace for programmatic expansion beyond mobile display, especially where buyers want television-like reach with digital targeting and measurement. Market actions such as the FreeWheel and Innity partnership (June 2025) to streamline premium CTV and digital video across Southeast Asia and Hong Kong, and Amazon Ads rolling out Complete TV capabilities in Australia, point to continued investment in programmatic pipes for streaming inventory and unified planning and measurement.
Commerce-linked programmatic is another opportunity area as retail media and content commerce deepen first-party data access and closed-loop attribution. The TNL Mediagene and Coupang partnership (November 2025) shows how premium publisher inventory is being connected to transaction signals, supporting performance and measurement use cases that rely less on third-party cookies. At the same time, rising compliance and fraud obligations in markets such as Taiwan (MODA subsidiary regulations in November 2024) and Thailand (identity verification requirements effective November 1, 2026) are increasing demand for platforms that can operationalize advertiser verification, transparent supply paths, and robust ad verification under country-specific rules.
Recent Industry Developments in Asia-Pacific Programmatic Advertising Market
- April 2026: Appier announced a collaboration with Omio to scale user acquisition across 21 markets using its agentic AI-driven optimization capabilities. The deployment highlights how programmatic execution is being packaged as full-funnel, AI-led acquisition and measurement rather than standalone media buying, raising the bar for optimization, creative iteration, and incrementality analytics in regional campaigns.
- March 2026: Amazon Ads introduced new AI tools in India, including Creative Agent and Ads Agent, alongside unified campaign management updates shared around its flagship Connected Worlds activity. The release strengthens self-serve and managed-service workflows for large enterprises and SMEs, while reinforcing the shift toward automation in creative production and campaign operations within India’s fast-scaling programmatic ecosystem.
- October 2024: The China Advertising Association and China Communications Standards Association implemented T/CCSA 553-2024 / T/CAAAD 006-2024, a technical standard for internet advertising monitoring and verification. Standardized requirements for measurement, visibility, and invalid-traffic detection increase the importance of in-market verification integrations and can influence how global platforms adapt reporting and compliance stacks for China.


Asia-Pacific Programmatic Advertising Market Report Scope and Research Methodology
Market Definition and Coverage
For this study, we define the Asia-Pacific programmatic advertising market as digital ad spend that is bought and sold through automated platforms, where media inventory is priced and allocated using programmatic transaction methods across the region.
Scope exclusions: We exclude non-programmatic digital buying and purely traditional offline ad spend that is not executed through programmatic workflows.
Segments Covered in This Report
- By Trading Platform
- Real-Time Bidding (RTB)
- Private Marketplace Guaranteed
- Automated Guaranteed
- Unreserved Fixed-Rate
- By Advertising Media
- Digital Display (Web)
- Mobile Display (In-App and Web)
- Connected TV/OTT
- Digital Out-of-Home
- By Enterprise Size
- Small and Mid-sized Enterprises (SMEs)
- Large Enterprises
- By Industry Vertical
- E-commerce and Retail
- Media and Entertainment
- BFSI
- Travel and Hospitality
- Automotive
- Other Industry Verticals
- By Country
- China
- Japan
- India
- South Korea
- Australia
- Thailand
- Singapore
- Malaysia
- Rest of Asia-Pacific
Data Sources, Market Sizing, and Validation
Desk Research
Desk research starts with setting the boundary of what counts as programmatic spend in Asia-Pacific, then mapping it to measurable ad economy signals. We review public sources such as International Telecommunication Union (ITU) connectivity statistics, World Bank macro indicators, OECD digital economy publications, and regulator communications in large APAC markets to anchor digital adoption and media access context.
To translate adoption into spend logic, we also use industry-facing sources such as IAB and other national advertising associations where available, plus peer-reviewed journals that discuss programmatic price and auction dynamics. These inputs are combined with company annual reports, earnings decks, and investor presentations to understand how the revenue mix shifts across programmatic channels over time. Where needed, we reference paid databases for company financials, news and filings, and patent databases to sanity-check platform capability trends. These desk sources are illustrative, and other public and paid references were used to collect data, cross-check assumptions, and clarify open questions.
Primary Interviews and Surveys
Primary work is used to confirm how programmatic budgets are allocated across APAC, and to pressure-test the assumptions that desk sources cannot fully explain. We interview and survey media buyers, publishers, ad tech intermediaries, and large advertisers across major APAC markets so that pricing movement, inventory availability, and measurement constraints are reflected in the model.
Distribution of primary research fieldwork respondents
| Company type | Respondent position |
|---|---|
| Top tier: 34% | CXOs: 13% |
| Mid tier: 52% | Functional/Unit leaders: 30% |
| Smaller Players: 14% | Managers: 57% |
Market-Sizing & Forecasting
Market sizing is built using a top-down and bottom-up approach, where the top-down backbone reconstructs programmatic spend from APAC digital ad activity and the share that flows through automated buying pipes. The totals are then corroborated using selective bottom-up checks such as sampled spend patterns by media type and transaction method, plus channel checks on typical price movements, before final totals are adjusted.
In practice, the model is guided by inputs such as digital ad spend growth by major APAC markets, mobile versus desktop consumption mix, programmatic penetration by format (for example display and mobile display), the mix of transaction types (RTB versus private marketplace and guaranteed-style buying), and typical CPM and fill-rate direction seen by buyers and publishers. When bottom-up fragments are incomplete for smaller markets, we handle gaps by applying conservative penetration ranges anchored to similar market structures and then revalidating them through primary inputs.
For forecasting, we use scenario analysis supported by a short set of measurable drivers, since policy shifts and platform changes can move pricing and addressability quickly. In each scenario, the key drivers are projected first and then rolled into programmatic spend growth. The resulting trend line is reviewed with experts so outlier growth paths can be corrected before the final forecast is locked.
Data Validation & Update Cycle
Validation is done through several checks so one data series cannot overly influence the outcome. We compare modeled totals against independent signals such as regional ad spend direction, digital consumption indicators, and observed programmatic share movements discussed by market participants, and then investigate large variances before sign-off.
Anomaly checks are run at country and format level, so sudden step-changes are explained by a real driver (like regulation, measurement change, or a major pricing swing) rather than a modeling error. A second analyst review is completed before publication, and respondents are re-contacted when assumptions move outside expected ranges. Reports are refreshed annually, with interim updates for material market events, and a final pre-delivery pass is done so clients receive the latest view.
Mordor Intelligence's Asia Pacific Programmatic Advertising Market Size Versus Other Published Estimates
Published market values for APAC programmatic advertising can differ because firms choose different spend boundaries, treat adjacent formats differently, and sometimes apply aggressive growth curves without the same level of cross-checking.
The table shows a wide spread, and in Mordor Intelligence's model the market is counted as programmatic spend tied to defined trading-platform methods and digital media formats (including display and mobile display). This avoids folding in broader digital advertising spend that is not bought through automated transactions.
Benchmark comparison
| Source | Market Size | Gaps in Research Methodology |
|---|---|---|
| Mordor Intelligence | USD 210.22 B (2025) | |
| Global Consultancy A | USD 185.40 B (2025) | Uses a narrower definition that appears to emphasize open auction activity and may undercount private marketplace and guaranteed programmatic deals, which can be material in mature APAC markets. |
| Industry Association B | USD 241.90 B (2025) | Often reported as a broadened digital automation bucket, where parts of digital ad spend are included even when buying is not fully programmatic, and year conversion timing can also lift the USD total. |
Across the three figures, most of the variance can be traced to what is treated as programmatic versus general digital spend, and how deal types beyond RTB are handled. Our approach stays repeatable by linking spend to clear transaction methods, format-level adoption, and primary validation on price and share movement, which makes the final total easier to explain and update year to year.


Key Questions Answered in the Report
How large is spending on automated buying in the Asia-Pacific programmatic advertising market?
The Asia-Pacific programmatic advertising market size reached USD 258.17 billion in 2026 and is projected at USD 720.31 billion by 2031.
Which country is growing fastest for programmatic ad spend in Asia-Pacific?
India is forecast to expand at a 24.6% CAGR through 2031, driven by mobile adoption and digital-payment uptake.
What media channel leads programmatic budgets today?
Mobile Display commands 49.10% of spend because smartphones dominate internet access across the region.
Why are advertisers shifting to Automated Guaranteed deals?
Automated Guaranteed offers inventory certainty and brand-safe environments, prompting a 24.06% CAGR even as RTB remains dominant.
How is sustainability addressed in programmatic campaigns?
Vendors such as LoopMe integrate carbon-measurement dashboards so brands can track and reduce emissions tied to ad delivery.
What is the biggest restraint on cross-border programmatic campaigns in Asia-Pacific?
Fragmented data-privacy laws add compliance complexity and cost, reducing the ease of running unified regional campaigns.
Page last updated on:


 Your data is secure and never sold or shared.


