US Pet Nutraceuticals Market Size and Share
Market Overview
| Study Period | 2018 - 2031 |
|---|---|
| Forecast Data Period | 2026 - 2031 |
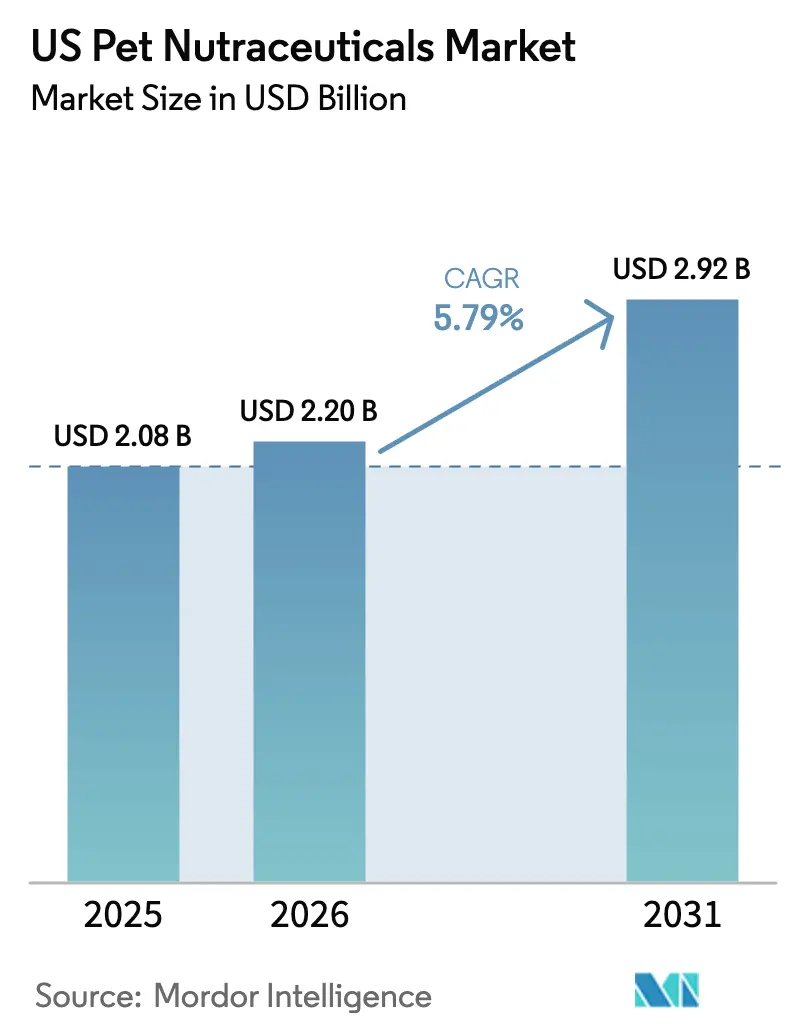
| Base Year Market Size (2025) | USD 2.08 Billion |
| Market Size (2026) | USD 2.2 Billion |
| Market Size (2031) | USD 2.92 Billion |
| Growth Rate (2026 - 2031) | 5.79% CAGR |
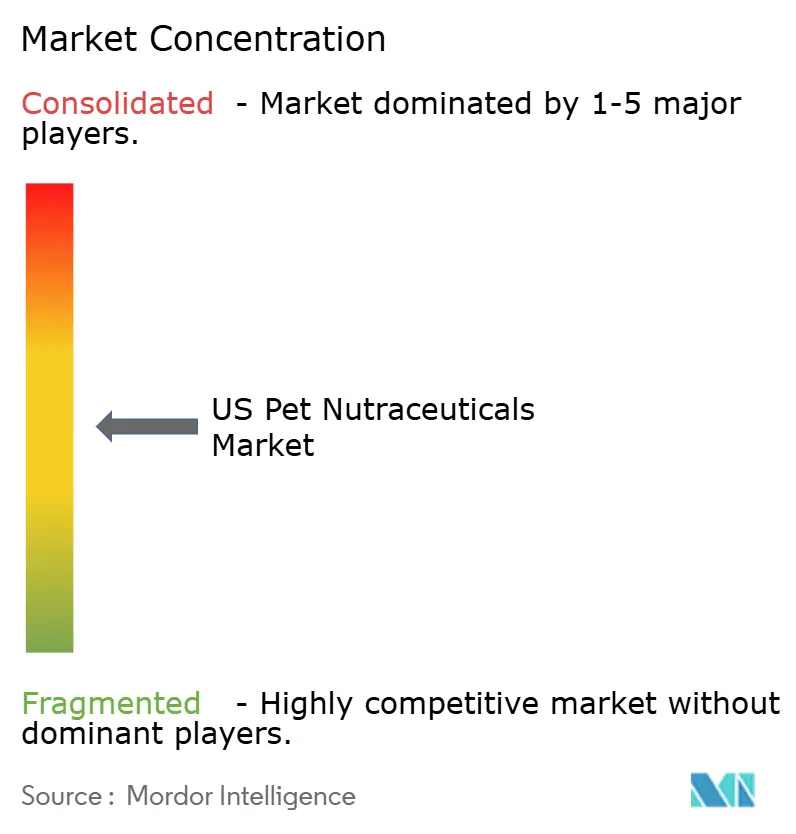
| Market Concentration | Medium |
Major Players *Disclaimer: Major Players sorted in no particular order Image © Mordor Intelligence. Reuse requires attribution under CC BY 4.0. | |
US Pet Nutraceuticals Market Analysis by Mordor Intelligence
The US pet nutraceuticals market size was valued at USD 2.08 billion in 2025 and estimated to grow from USD 2.2 billion in 2026 to reach USD 2.92 billion by 2031, at a CAGR of 5.79% during the forecast period (2026-2031). Accelerating pet humanization, premium price acceptance, and a growing focus on preventive care are fueling steady volume gains. Premium-priced functional treats, joint health chews, and digestive support powders are expanding household supplement repertoires, while data-driven subscription programs enhance repeat purchase rates. Market leadership remains in flux because digital-native entrants utilize direct-to-consumer models to educate shoppers, collect first-party data, and implement personalization engines. Established conglomerates counter this threat through veterinary endorsements, clean-label reformulation, and omnichannel merchandising that prioritizes convenience. Regulatory complexity under the Food and Drug Administration’s shared feed and drug oversight raises compliance costs, yet it also protects incumbents with robust quality systems. Raw material price swings, especially for omega-3 oils and botanical concentrates, pressure margins and heighten the importance of diversified sourcing.
Key Report Takeaways
- By sub-product, vitamins and minerals led with 26.02% revenue share in 2025, and are projected to expand at a 6.39% CAGR through 2031.
- By pet type, dogs accounted for 60.95% of the US pet nutraceuticals market share in 2025, and are projected to advance at a 6.32% CAGR through 2031.
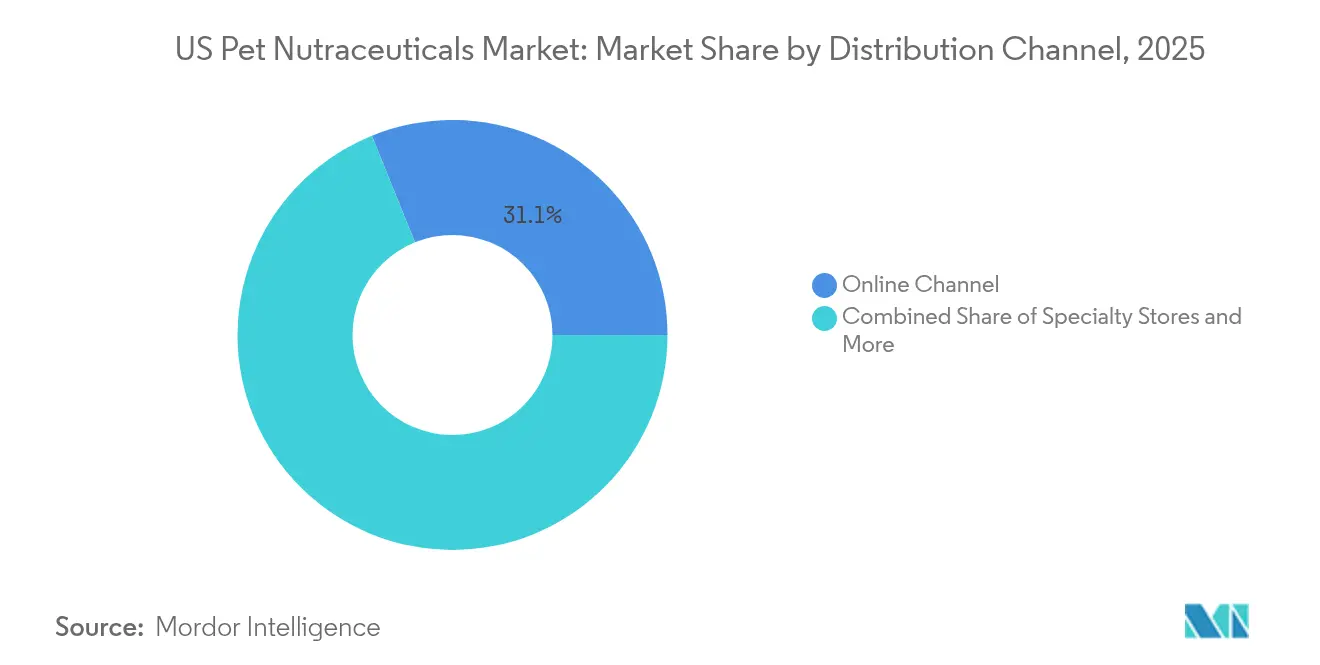
- By distribution channel, online channel captured a 31.12% share of the US pet nutraceuticals market size in 2025 and are projected to rise at a 7.14% CAGR through 2031.
Note: Market size and forecast figures in this report are generated using Mordor Intelligence’s proprietary estimation framework, updated with the latest available data and insights as of 2026.
US Pet Nutraceuticals Market Trends and Insights
Drivers Impact Analysis*
| Driver | (~) % Impact on CAGR Forecast | Geographic Relevance | Impact Timeline |
|---|---|---|---|
| Humanization of pets accelerates preventive health spending | +1.2% | National hubs in Northeast and West Coast metros | Medium term (2-4 years) |
| Rapid e-commerce penetration expanding supplement availability | +1.0% | Urban markets nationwide | Short term (≤ 2 years) |
| Veterinarian endorsements boosting credibility and uptake | +0.8% | Suburban veterinary practices | Medium term (2-4 years) |
| Aging pet population raising demand for joint health products | +0.9% | Higher-income households nationwide | Long term (≥ 4 years) |
| Post-biotics emerging as high-growth digestive support solutions | +0.7% | Premium segments nationwide | Medium term (2-4 years) |
| AI-driven personalized nutrition platforms increasing basket size | +0.5% | Tech-savvy urban markets | Long term (≥ 4 years) |
| Source: Mordor Intelligence | |||
Humanization of pets accelerates preventive health spending
American Pet Products Association data confirm a persistent rise in companion animal medical expenditures, which owners now classify as essential rather than discretionary[1]Source: Harris Williams, “Pet Industry Report,” harriswilliams.com. Nearly four in five owners support supplements that may lengthen lifespan, driving expanded household penetration of multivitamins, skin-and-coat oils, and dental chews. Millennials and Generation Z display the highest spend intensity because they equate responsible pet parenting with human-grade preventive nutrition. Scientific backing from ingredient suppliers and veterinary colleges further legitimizes early intervention approaches that maintain quality of life and reduce the need for costly treatments.
Rapid e-commerce penetration expanding supplement availability
Digital platforms already account for 30.6% of sales, and their 7.2% CAGR outpaces every offline format. Subscription options such as autoship reorder and curated boxes make repeat purchasing frictionless, which suits consumable supplements. Rich product pages, videos, and peer reviews clarify complex benefit claims and dosage instructions that can be hard to convey in physical aisles. The convenience effect is evident, as a majority of subscribers report visiting brick-and-mortar stores less often for pet supplies[2]Source: Lisa Cleaver, “Report: E-commerce Pet Subscription Services Altering Shopping Patterns,” petfoodindustry.com. Online ecosystems also generate valuable behavioral data for targeting launch campaigns and tailoring promotions.
Veterinarian endorsements boosting credibility and uptake
Purina’s Vet Direct program doubled Pro Plan Therapeutics sales once veterinarians could write digital prescriptions that ship directly to homes, eliminating clinic inventory hurdles. Tele-nutrition networks such as Vetster extend licensed expertise to all 50 states, pairing diagnostics with precise dietary recommendations. Professional guidance addresses owner concerns about safety and efficacy, which is crucial for condition-specific formulas such as renal support or joint mobility powders. Survey evidence shows that 71% of owners prefer pet food backed by clinical research, underscoring the value of scientific positioning.
Aging pet population raising demand for joint health products
Demographic shifts in pet populations drive sustained demand for age-related health solutions, with joint health supplements representing a rapidly expanding category within the broader nutraceuticals market. The American Veterinary Medical Association reports an increasing pet lifespan, which correlates with a rising prevalence of arthritis and mobility issues, creating a sustained demand for glucosamine, chondroitin, and omega-3 formulations targeting joint inflammation[3]Source: American Veterinary Medical Association, “US Pet Ownership Statistics,” avma.org. The aging pet demographic creates predictable, long-term demand patterns as owners seek to maintain the quality of life for senior pets. The premium positioning of joint health formulations enables manufacturers to capture higher margins while addressing genuine medical needs, supported by veterinary recommendations and measurable functional outcomes.
Restraints Impact Analysis*
| Restraint | (~) % Impact on CAGR Forecast | Geographic Relevance | Impact Timeline |
|---|---|---|---|
| Ambiguous FDA (Food and Drug Administration) jurisdiction inflating compliance costs | –0.6% | Nationwide | Short term (≤ 2 years) |
| Raw-material price volatility for omega-3 and botanicals | –0.4% | Global supply chains affecting US pricing | Short term (≤ 2 years) |
| Ingredient-specific safety concerns | –0.3% | State-level variations | Medium term (2-4 years) |
| Consumer skepticism about unproven claims in crowded marketplace | –0.5% | New entrants nationwide | Medium term (2-4 years) |
| Source: Mordor Intelligence | |||
Ambiguous FDA (Food and Drug Administration) jurisdiction inflating compliance costs
The regulatory landscape for pet nutraceuticals operates under an ambiguous jurisdiction of the FDA (Food and Drug Administration), creating compliance uncertainty and increasing operational costs across the supply chain. Unlike human dietary supplements, which are regulated under the DSHEA (Dietary Supplement Health and Education Act), pet supplements fall into a regulatory gray area where the FDA's Center for Veterinary Medicine oversees safety but lacks clear guidance on manufacturing standards, labeling requirements, and substantiation of health claims. This regulatory uncertainty particularly impacts innovation timelines and market entry strategies, as companies must invest significant resources in regulatory assessment before product development, constraining the pace of new ingredient adoption and formulation innovation that drives market growth.
Raw-material price volatility for omega-3 and botanicals
Supply chain volatility for key nutraceutical ingredients creates margin pressure and formulation challenges that constrain market expansion, particularly for omega-3 fatty acids and botanical extracts that represent core functional categories. Fish oil prices have experienced significant volatility due to declining global fish stocks, climate change impacts on fishing grounds, and increased demand from both human and pet nutrition applications. This volatility particularly impacts smaller manufacturers, who often lack supply chain diversification and long-term contract capabilities that larger companies use to mitigate price risk.
*Our forecasts treat driver/restraint impacts as directional, not additive. The impact forecasts reflect baseline growth, mix effects, and variable interactions.
Segment Analysis
By Sub Product: Vitamins and Minerals Drive Foundational Wellness
Vitamins and minerals represented 26.02% of 2025 revenue and posted the fastest 6.39% CAGR, serving as an anchor that supports the broader US pet nutraceuticals market's size expansion. Multivitamin chews, calcium powders, and zinc-infused toppers serve all life stages, making them gateway products for first-time buyers. Their GRAS (Generally Recognized As Safe) status, broad veterinary acceptance, and clear deficiency symptoms simplify marketing and enable private-label adoption. Growth also stems from omega-3 fortified capsules that address skin and coat complaints while delivering joint and cardiovascular benefits.
Demand unlocks adjacent innovation. Probiotics offer gut-brain benefits, but they require refrigeration, which complicates logistics. Post-biotics now solve this issue through shelf-stable metabolites. Proteins and peptides enhance musculoskeletal recovery, attracting athletes in agility sports. Botanical extracts, such as turmeric and green-lipped mussel, differentiate premium formulas; however, supply volatility and bioavailability challenges warrant the use of nanotechnology delivery systems. Niche actives occupy smaller shares yet play a role in lifetime value by prompting basket expansion.


By Pets: Dogs Dominate Through Size and Health Complexity
Dogs capture 60.95% market share in 2025 and maintain 6.32% CAGR growth through 2031, driven by their larger body size requiring higher dosages, greater health complexity creating diverse supplement needs, and stronger owner emotional attachment supporting premium spending decisions. The canine segment benefits from extensive clinical research supporting the efficacy of nutraceuticals, with studies demonstrating measurable outcomes for joint health, cognitive function, and digestive wellness, enabling evidence-based marketing claims.
Cats represent a smaller but important segment with unique metabolic considerations that require species-specific formulation approaches, particularly regarding their limited glucuronidation capacity, which affects the metabolism and safety profiles of botanical extracts. Feline-specific innovations include urinary health formulations, hairball control supplements, and stress-reduction products addressing behavioral concerns common in indoor cats. Other pets, including birds, small mammals, and reptiles, constitute niche segments with specialized nutritional requirements and a limited research foundation. However, growing interest in exotic pet ownership creates emerging opportunities for targeted supplement development.
By Distribution Channel: Online Channels Accelerate Market Access
Online channel platforms held a 31.12% share in 2025 and posted the highest 7.14% CAGR, extending the US pet nutraceuticals market reach into rural ZIP codes beyond specialty stores. Autoship and curated box models embed stickiness through discounts and surprise elements. Dynamic bundling pairs joint chews with mobility toys or gut health powders with prebiotic treats, nudging average order value higher.
Brick-and-mortar outlets remain relevant for immediate needs and tactile evaluation. Specialty stores employ trained staff to explain dosing and stack trial samples at checkout, which lifts conversion. Veterinary clinics distribute prescription joint support and renal diets, backed by electronic health record integration that triggers refill reminders. Supermarkets stock entry-level vitamins positioned next to kibble, leveraging traffic but facing shelf-space competition. Convenience stores test single-serve sachets near registers, enabling impulse purchases for on-the-go owners.
Geography Analysis
Regional disparities influence growth trajectories across the US pet nutraceuticals market. Coastal metros in California, New York, and Massachusetts show the highest per-pet spending, supported by elevated disposable income, dense veterinary networks, and wellness-oriented lifestyles. Subscription penetration runs deepest in these locations, with same-day courier services shortening delivery windows. Post-biotic launches often debut in these hubs to capture early adopters.
Suburban belts in Texas, Florida, and Illinois generate volume gains as household formation increases. Joint health blends for senior dogs resonate strongly due to larger backyard breeds. Online uptake in these zones benefits from big-box click-and-collect options. Rural counties in the Midwest and Mountain states lag in premium adoption, yet broadband expansion enables direct-to-farm shipping, boosting the reach of powder supplements for working dogs.
State regulations, such as California’s Proposition 65 labeling and New York’s ingredient disclosure bills, impose variable compliance demands. Brands adapt through regional packaging runs and targeted education campaigns that explain the benefits of traceability and third-party testing. Ingredient supply clusters are centered around the Midwest, where soy and corn fermentation feed the production of probiotics, providing local formulators with lead times and freight savings.
Competitive Landscape
Competition is moderate, with top multinationals leveraging integrated feed-to-finished product assets, while agile start-ups carve out niche functionalities. Mars Incorporated, ADM, Nestle SA (Purina), Schell & Kampeter Inc. (Diamond Pet Foods), and Vetoquinol Company collectively captured a significant portion of the 2024 revenue, leveraging veterinary endorsements, omnichannel presence, and robust research pipelines. Nutramax Laboratories and Virbac exploit scientific depth to win prescription supplement categories.
Strategic themes include vertical ingredient integration to mitigate raw material swings, investment in telehealth partnerships that incorporate supplements into care plans, and sustainability positioning through marine-protected omega-3 sourcing. Mergers acquire digital capabilities, as seen in FabFitFun’s purchase of PupBox, which adds canine subscription expertise. Post-biotic patents and data-driven personalization differentiate challengers while building high-margin intellectual property. Incumbents respond by launching venture arms that scout innovators in gut health and genomic nutrition.
Regulatory stewardship is a barrier to entry because adherence to good manufacturing practices and adverse event reporting favors firms with established compliance teams. Quality badges, such as National Animal Supplement Council certification, now appear prominently on e-commerce listings, guiding shoppers' trust. Technology adoption differentiates market leaders, with companies investing in telehealth platform integration, subscription commerce capabilities, and data analytics for customer retention and cross-selling optimization.
US Pet Nutraceuticals Industry Leaders
ADM
Mars Incorporated
Nestle (Purina)
Schell & Kampeter Inc. (Diamond Pet Foods)
Vetoquinol
- *Disclaimer: Major Players sorted in no particular order

Recent Industry Developments
- March 2025: Purina facilitated the growth of therapeutic pet food through its Vet Direct direct-to-consumer model, reporting that Pro Plan Therapeutics sales doubled as the program addressed veterinary clinic inventory reluctance and consumer transport barriers by enabling prescription issuance with direct-to-home shipping.
- February 2023: ADM opened its new probiotics and postbiotics production facility in Spain. The facility will supply these supplements to North America, Europe, the Middle East, and Africa (EMEA), and Asia-Pacific.
- January 2023: Wellness Pet Company Inc., a subsidiary of Clearlake Capital Group LP, launched a fresh range of supplements designed for dogs, which prioritize providing daily health advantages to promote overall well-being. These products help meet the proactive approach of pet parents for long-term health and well-being.


US Pet Nutraceuticals Market Report Scope
Milk Bioactives, Omega-3 Fatty Acids, Probiotics, Proteins and Peptides, Vitamins and Minerals are covered as segments by Sub Product. Cats, Dogs are covered as segments by Pets. Convenience Stores, Online Channel, Specialty Stores, Supermarkets/Hypermarkets are covered as segments by Distribution Channel.| Milk Bioactives |
| Omega-3 Fatty Acids |
| Probiotics |
| Proteins and Peptides |
| Vitamins and Minerals |
| Other Nutraceuticals |
| Cats |
| Dogs |
| Other Pets |
| Convenience Stores |
| Online Channel |
| Specialty Stores |
| Supermarkets/Hypermarkets |
| Other Channels |
| Sub Product | Milk Bioactives |
| Omega-3 Fatty Acids | |
| Probiotics | |
| Proteins and Peptides | |
| Vitamins and Minerals | |
| Other Nutraceuticals | |
| Pets | Cats |
| Dogs | |
| Other Pets | |
| Distribution Channel | Convenience Stores |
| Online Channel | |
| Specialty Stores | |
| Supermarkets/Hypermarkets | |
| Other Channels |


Market Definition
- FUNCTIONS - Pet foods are usually intended to provide complete and balanced nutrition to the pet but are primarily used as functional products. The scope includes the food and supplements consumed by pets including veterinary diets. Supplements/nutraceuticals that are directly supplied to pets are considered within the scope.
- RESELLERS - Companies engaged in reselling of pet food without value addition have been excluded from the market scope, in order to avoid double counting.
- END CONSUMERS - Pet owners are considered to be the end-consumers in the market studied.
- DISTRIBUTION CHANNELS - Supermarkets/hypermarkets, specialty stores, convenience stores, online channels and other channels are considered within the scope. The stores which are exclusively providing pet related basic and custom products are considered within the scope of specialty stores.
| Keyword | Definition |
|---|---|
| Pet Food | The scope of pet food includes the food that is eatable by pets including food, treats, veterinary diets, and nutraceuticals/supplements. |
| Food | Food is animal feed intended for consumption by pets. It is formulated to provide essential nutrients and meet the dietary needs of various types of pets, including dogs, cats, and other animals. These are generally segmented into dry and wet pet foods. |
| Dry Pet Food | Dry pet foods may be extruded/baked (kibbles) or flaked. They have a lower moisture content, typically around 12-20%. |
| Wet Pet Food | Wet pet food, also known as canned pet food or moist pet food, generally has a higher moisture content compared to dry pet food, often ranging from 70-80%. |
| Kibbles | Kibbles are dry, processed pet food in small, bite-sized pieces or pellets. They are specifically formulated to provide balanced nutrition for various domestic animals, such as dogs, cats, and other animals. |
| Treats | Pet Treats are special food items or rewards given to pets, to show affection, and encourage good behavior. They are especially used during training. Pet treats are made from various combinations of meat or meat-derived materials with other ingredients. |
| Dental Treats | Pet dental treats are specialized treats that are formulated to promote good oral hygiene in pets. |
| Crunchy Treats | It is a type of pet treat that has a firm and crispy texture which can be a good source of nutrition for pets. |
| Soft and chewy treats | Soft and Chewy pet treats are a type of pet food product that is formulated to be easy to chewy and digest. They are usually made from soft and pliable ingredients, such as meat, poultry, or vegetables, that have been blended and formed into bite-sized pieces or strips. |
| Freeze-dried & Jerky Treats | Freeze-dried and jerky treats are snacks given to pets, that are prepared through a special preservation process, without damaging the nutritional content, resulting in long-lasting, nutrient-rich treats. |
| Urinary Tract Disease Diets | These are commercial diets that are specifically formulated to promote urinary health and reduce the risk of urinary tract infections and other urinary problems. |
| Renal Diets | These are specialized pet foods formulated to support the health of pets with kidney disease or renal insufficiency. |
| Digestive Sensitivity Diets | Digestive-sensitive diets are specially formulated to meet the nutritional needs of pets with digestive issues such as food intolerances, allergies, and sensitivities. These diets are designed to be easily digestible and to reduce the symptoms of digestive problems in pets. |
| Oral Care Diets | Oral care diets for pets are specially formulated diets produced to promote oral health and hygiene in pets. |
| Grain-Free Pet Food | Pet food that does not contain common grains like wheat, corn, or soy. Grain-free diets are often preferred by pet owners seeking alternative options or if their pets have specific dietary sensitivities. |
| Premium Pet Food | High-quality pet food formulated with superior ingredients often offers additional nutritional benefits compared to standard pet food. |
| Natural Pet Food | Pet food made from natural ingredients, with minimal processing and without artificial preservatives. |
| Organic Pet Food | Pet food is produced using organic ingredients, free from synthetic pesticides, hormones, and genetically modified organisms (GMOs). |
| Extrusion | A manufacturing process used to produce dry pet food, where ingredients are cooked, mixed, and shaped under high pressure and temperature. |
| Other Pets | Other pets include birds, fish, rabbits, hamsters, ferrets, and reptiles. |
| Palatability | The taste, texture, and aroma of pet food influence its appeal and acceptance by pets. |
| Complete and Balanced Pet Food | Pet food that provides all essential nutrients in appropriate proportions to meet the nutritional needs of pets without additional supplementation. |
| Preservatives | These are the substances that are added to pet food to extend its shelf life and prevent spoilage. |
| Nutraceuticals | Food products that offer health benefits beyond basic nutrition, often contain bioactive compounds with potential therapeutic effects. |
| Probiotics | Live beneficial bacteria that promote a healthy balance of gut flora, supporting digestive health and immune function in pets. |
| Antioxidants | Compounds that help neutralize harmful free radicals in the body, promoting cellular health and supporting the immune system in pets. |
| Shelf-Life | The duration of which pet food remains safe and nutritionally viable for consumption after its production date. |
| Prescription diet | Specialized pet food formulated to address specific medical conditions under veterinary supervision. |
| Allergen | A substance that can cause allergic reactions in some pets, leading to food allergies or sensitivities. |
| Canned food | Wet pet food that is packed in cans and contains higher moisture content than dry food. |
| Limited ingredient diet (LID) | Pet food formulated with a reduced number of ingredients to minimize potential allergens. |
| Guaranteed Analysis | The minimum or maximum levels of certain nutrients present in pet food. |
| Weight management | Pet food designed to help pets maintain a healthy weight or support weight loss efforts. |
| Other Nutraceuticals | It includes prebiotics, antioxidants, digestive fiber, enzymes, essential oils and herbs. |
| Other Veterinary Diets | It includes weight management diets, skin and coat health, cardiac care, and joint care. |
| Other Treats | It includes rawhides, mineral blocks, lickables, and catnips. |
| Other Dry Foods | It includes cereal flakes, mixers, meal toppers, freeze-dried foods, and air-dried foods. |
| Other Animals | It includes birds, fish, reptiles, and small animals (rabbits, ferrets, hamsters). |
| Other Distribution Channels | It includes veterinary clinics, local unregulated stores, and feed and farm stores. |
| Proteins and Peptides | Proteins are large molecules composed of basic units called amino acids which help in the growth and development of pets. Peptides are the short string of 2 to 50 amino acids. |
| Omega-3 fatty acids | Omega-3 fatty acids are essential polyunsaturated fats that play a crucial role in the overall health and well-being of Pets |
| Vitamins | Vitamins are the essential organic compounds that are essential for vital physiological functioning. |
| Minerals | Minerals are naturally occurring inorganic substances that are essential for various physiological functions in pets. |
| CKD | Chronic Kidney Disease |
| DHA | Docosahexaenoic Acid |
| EPA | Eicosapentaenoic Acid |
| ALA | Alpha-linolenic Acid |
| BHA | Butylated Hydroxyanisol |
| BHT | Butylated Hydroxytoluene |
| FLUTD | Feline Lower Urinary Tract Disease |


Research Methodology
Mordor Intelligence follows a four-step methodology in all our reports.
- Step-1: IDENTIFY KEY VARIABLES: In order to build a robust forecasting methodology, the variables and factors identified in Step-1 are tested against available historical market numbers. Through an iterative process, the variables required for market forecast are set and the model is built on the basis of these variables.
- Step-2: Build a Market Model: Market-size estimations for the forecast years are in nominal terms. Inflation is not a part of the pricing, and the average selling price (ASP) is kept constant throughout the forecast period.
- Step-3: Validate and Finalize: In this important step, all market numbers, variables and analyst calls are validated through an extensive network of primary research experts from the market studied. The respondents are selected across levels and functions to generate a holistic picture of the market studied.
- Step-4: Research Outputs: Syndicated Reports, Custom Consulting Assignments, Databases & Subscription Platforms


