Market Overview
| Study Period | 2020 - 2031 |
|---|---|
| Forecast Data Period | 2026 - 2031 |
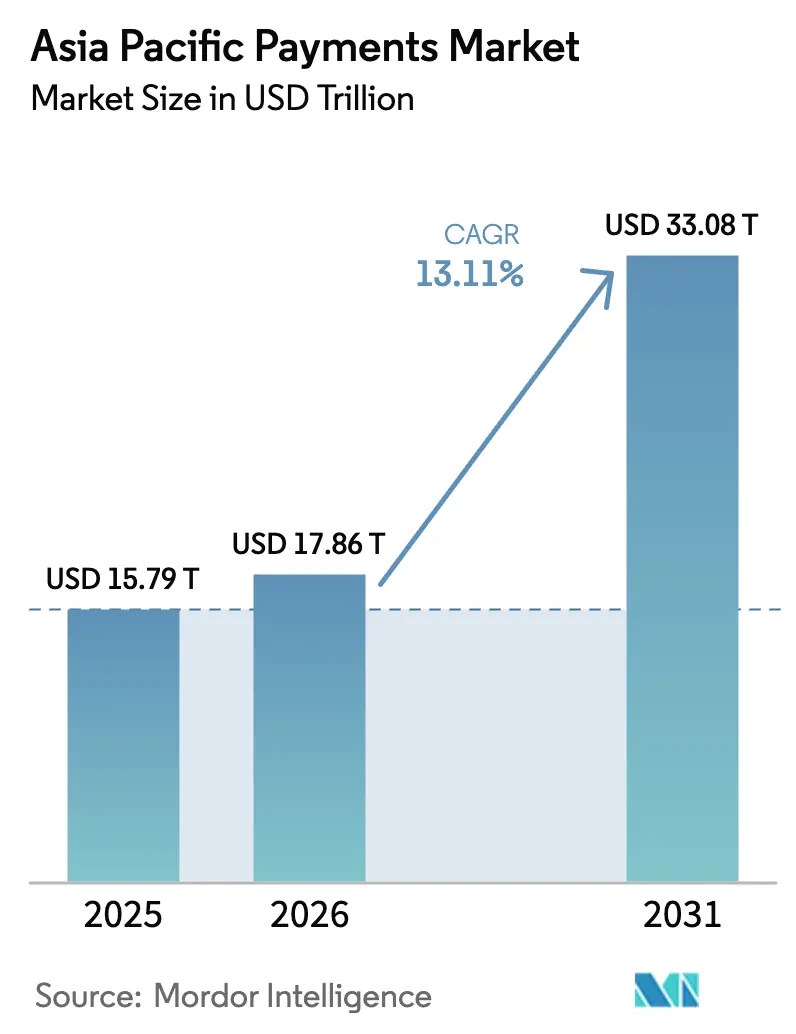
| Base Year Market Size (2025) | USD 15.79 Trillion |
| Market Size (2026) | USD 17.86 Trillion |
| Market Size (2031) | USD 33.08 Trillion |
| Growth Rate (2026 - 2031) | 13.11% CAGR |
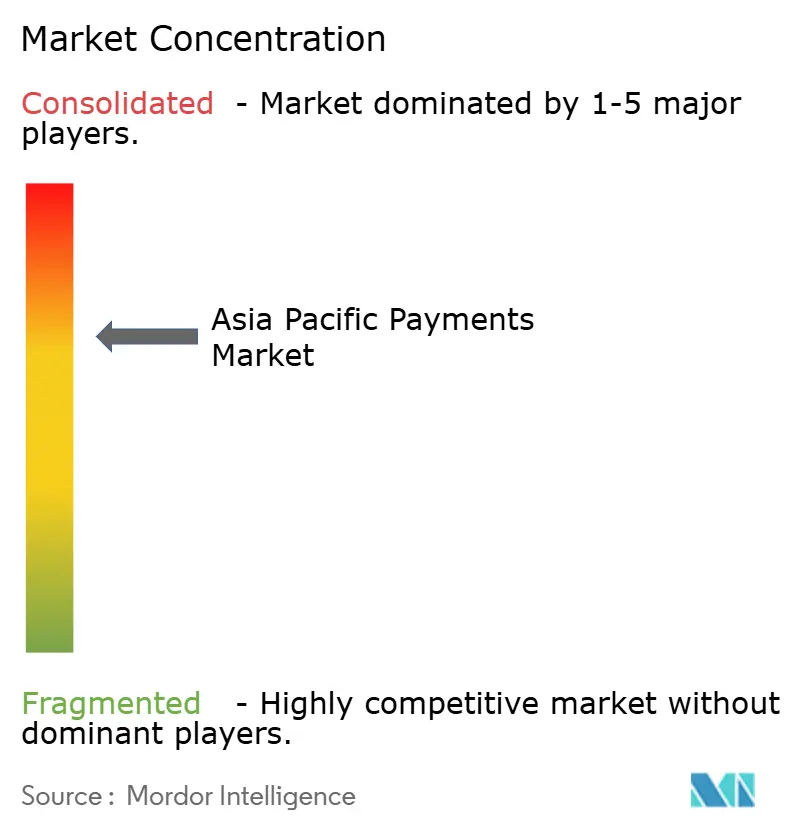
| Market Concentration | Medium |
Major Players*Disclaimer: Major Players sorted in no particular order Image © Mordor Intelligence. Reuse requires attribution under CC BY 4.0. | |
Asia Pacific Payments Market Analysis by Mordor Intelligence
The Asia-Pacific payments market size was valued at USD 15.79 trillion in 2025 and estimated to grow from USD 17.86 trillion in 2026 to reach USD 33.08 trillion by 2031, at a CAGR of 13.11% during the forecast period (2026-2031). Rapid digitization, large-scale smartphone adoption, and government-backed real-time payment rails anchor this growth trajectory. Super-app ecosystems extend financial services far beyond traditional card products, while cross-border QR and account-to-account linkages shorten settlement cycles and cut operating costs for merchants. Incumbent card networks respond by embedding tokenization and partnering with local wallets, preserving their data insights even as plastic card usage declines. At the same time, rising payment-fraud sophistication pushes processors and merchants to invest in artificial-intelligence risk engines that can respond to evolving threat vectors without dampening user experience.
Key Report Takeaways
- By mode of payment, digital wallets led with 65.12% of the Asia Pacific payments market share in 2025, and Buy-Now-Pay-Later is advancing at a 14.35% CAGR through 2031.
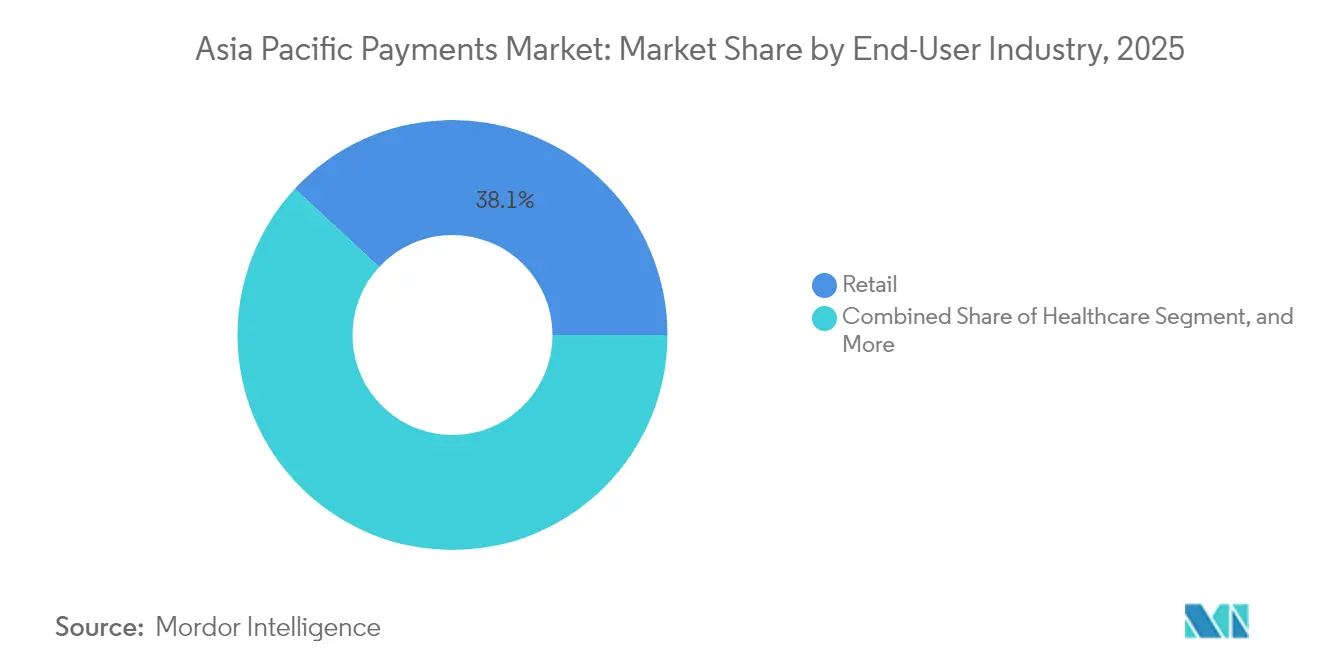
- By end-user industry, retail accounted for 38.10% of 2025 payment volumes in the Asia Pacific payments market, while healthcare is projected to expand at a 13.42% CAGR to 2031.
- By country, China captured 43.05% revenue in 2025 in the Asia Pacific payments market, whereas India records the highest forecast CAGR at 14.05% through 2031.
Note: Market size and forecast figures in this report are generated using Mordor Intelligence’s proprietary estimation framework, updated with the latest available data and insights as of 2026.
Asia Pacific Payments Market Trends and Insights
Driver Impact Analysis*
| Driver | (~) % Impact on CAGR Forecast | Geographic Relevance | Impact Timeline |
|---|---|---|---|
| Rapid e-commerce and m-commerce expansion | +3.3% | Global, with concentration in China, India, Southeast Asia | Medium term (2-4 years) |
| Government real-time rails and digitization programs | +2.7% | India, Thailand, Singapore, Malaysia, Philippines | Short term (≤ 2 years) |
| Rising smartphone and internet penetration | +2.0% | Indonesia, Vietnam, Philippines, rural China and India | Long term (≥ 4 years) |
| Accelerating Buy-Now-Pay-Later (BNPL) uptake | +2.4% | Australia, Singapore, Malaysia, Thailand, urban markets | Medium term (2-4 years) |
| Cross-border QR and real-time linkages | +1.6% | ASEAN core, spill-over to South Asia | Medium term (2-4 years) |
| Tokenization boosts card-in-wallet security | +1.1% | Global, early adoption in Singapore, Hong Kong | Short term (≤ 2 years) |
| Source: Mordor Intelligence | |||
Rapid E-commerce and M-commerce Expansion
Asia-Pacific online retail sales surged during 2024, and mobile transactions already account for more than 70% of total digital commerce in China and India. Escalating cross-border shopping forces merchants to support multi-currency checkout, real-time FX, and orchestrated routing that bypasses costly correspondent banking corridors. Payment-orchestration platforms roll out unified APIs, letting retailers dynamically switch acquirers or payment methods to maximize authorization rates and minimize fees. Social commerce features embedded in super-apps commoditize checkout and place renewed emphasis on loyalty programs, cashback, and personalized offers that keep users inside closed ecosystems. Regulatory sandboxes attempt to balance consumer protection with innovation velocity, yet uneven implementation across markets creates temporary arbitrage opportunities for agile fintechs.
Government Real-time Rails and Digitization Programs
Public-sector infrastructure shapes the Asia-Pacific payments market by standardizing instant settlement, reducing transaction fees, and asserting data sovereignty. India’s UPI processed 131 billion transactions in 2024, while Thailand’s PromptPay crossed 15 billion, proving that government rails can scale in a fraction of the time historically required by private networks. Programmable-money pilots such as Singapore’s Project Orchid explore automated tax collection, escrow, and compliance triggers that fire within the payment itself, shrinking reconciliation cycles from days to seconds. Central-bank oversight of core rails lowers systemic-risk concerns and increases competitive pressure on incumbents who must now differentiate through value-added services rather than proprietary switching. The expanded visibility into domestic flows also sharpens monetary-policy tools, enabling regulators to identify stress pockets early and intervene with targeted liquidity measures.
Rising Smartphone and Internet Penetration
Annual growth of 8-12% in mobile broadband access opens new micro-merchant and peer-to-peer revenue pools for the Asia-Pacific payments market. In Indonesia and Vietnam, many users experience their first formal financial service through a mobile wallet rather than a bank branch, creating brand loyalty that sidesteps legacy card adoption paths. Network upgrades to 5G improve biometric authentication response times, lowering abandonment in high-risk remote areas where latency has historically increased false declines. Telecommunications regulators grow influential as mobile network operators extend into payments, often holding e-money licenses or partnering with deposit-taking institutions. Fragmented infrastructure still creates reliability gaps in rural zones, but satellite backhaul initiatives in the Philippines and India promise broader coverage that can vault digital payments into areas previously limited to cash.
Accelerating Buy-Now-Pay-Later Uptake
BNPL regulation matured quickly during 2024, with Malaysia, Thailand, and Singapore introducing licensing, capital, and disclosure requirements.[1]Australian Securities and Investments Commission, “ASIC releases report on buy now pay later sector,” asic.gov.au Clear rules reassure merchants and lenders, fueling double-digit BNPL volume growth even as global interest rates rise. Australian pioneers Afterpay and Zip export underwriting models focused on transparent fees rather than revolving interest, an approach resonating with Gen-Z demographics wary of traditional credit cards. Integration into e-commerce shopping carts and digital wallets enables one-click installment offers at the point of intent, boosting average order values for categories such as fashion, electronics, and travel. Risk models leverage alternative data, ranging from mobile top-ups to ride-hailing histories, to assess affordability, although regulators insist on strict consumer-protection disclosures to curb over-extension.
Restraints Impact Analysis*
| Restraint | (~) % Impact on CAGR Forecast | Geographic Relevance | Impact Timeline |
|---|---|---|---|
| Fragmented cross-border regulations | -0.8% | Global, particularly affecting smaller markets and cross-border corridors | Long term (≥ 4 years) |
| Escalating payment-fraud sophistication | -0.5% | High-volume markets: China, India, Australia, Singapore | Short term (≤ 2 years) |
| Merchant-fee and interchange compression | -0.4% | Developed markets: Australia, Japan, South Korea, Singapore | Medium term (2-4 years) |
| Zero-fee instant rails eroding bank revenues | -0.3% | India, Thailand, Malaysia, Philippines with government-backed systems | Medium term (2-4 years) |
| Source: Mordor Intelligence | |||
Fragmented Cross-border Regulations
Payment providers navigating the Asia-Pacific payments market face multiple licensing regimes that seldom recognize each other’s approvals. Anti-money-laundering thresholds, foreign-exchange caps, and data-localization demands differ by jurisdiction, raising compliance costs and delaying new-product rollouts. Smaller fintechs often restrict initial expansion to two or three markets, ceding broader regional opportunities to incumbents with existing compliance frameworks. The ASEAN Payment Connectivity roadmap aims to harmonize rules by 2027, yet stakeholders indicate extended timelines as individual governments prioritize domestic financial-stability concerns. Until policy alignment materializes, scale advantages accrue to platforms large enough to maintain redundant regulatory reporting across a dozen jurisdictions.
Escalating Payment-fraud Sophistication
Synthetic-identity creation and account takeover tactics grew 35% year over year, particularly within instant-payment ecosystems that settle irrevocably in seconds. India recorded 95,000 UPI fraud attempts in 2024, leading to new tokenization and device-binding mandates that add friction to low-value transactions. Fraud rings exploit seamless cross-border flows to dissipate stolen funds across multiple wallets before detection, challenging law enforcement that relies on slow mutual-assistance requests. Processors therefore embed machine learning that flags behavioral anomalies, such as impossible device location jumps, within milliseconds, but the constant algorithm-training raises operating expenses. Merchants lacking dedicated fraud teams risk chargeback surges, driving demand for managed-service models that bundle acceptance, risk, and recovery under one SLA.
*Our updated forecasts treat driver/restraint impacts as directional, not additive. The revised impact forecasts reflect baseline growth, mix effects, and variable interactions.
Segment Analysis
By Mode of Payment: Digital Wallets Drive Tokenization
Digital wallets captured 65.12% of the Asia-Pacific payments market in 2025, reflecting consumer appetite for a unified interface that merges loyalty, lending, and lifestyle services into a single tap. The segment’s dominance is underpinned by QR-code ubiquity, near-field communication upgrades, and OEM wallets pre-installed on low-cost smartphones that penetrate rural markets. Card networks respond by pushing tokenization, and Visa’s Token Service alone generated USD 2 billion in incremental volume across the region in 2024. This security layer lets cards remain relevant within wallets even as physical plastic recedes, illustrating how infrastructure adaptation, rather than direct competition, can preserve legacy revenue streams. BNPL sits inside this ecosystem, with one-click installments surfacing contextually at checkout, creating a seamless blend of payments and credit that users perceive as a single service rather than two separate verticals. Contactless point-of-sale solutions stay important for transit and quick-service restaurants, where speed trumps richer in-app experiences. Account-to-account real-time payments, meanwhile, grow fastest where cost-sensitive merchants prefer zero-interchange models, notably in Singapore and Australia.
Regulatory mandates for multifactor authentication sharpen the competitive field, because only platforms with deep engineering resources can maintain frictionless user experience while meeting token-life-cycle management rules. The Asia-Pacific payments market size for digital-wallet transactions is projected to reach USD 21.15 trillion by 2031, underlining the continued primacy of wallet rails in both peer-to-peer and retail settings. Smaller e-money apps often white-label token services from global schemes, but they retain frontend branding and customer relationships, ensuring data harvesting stays local. Cash still circulates in rural economies, though its share of overall consumer spending falls each year, suggesting a dual-track evolution that calls for hybrid acceptance hardware capable of processing both QR and contactless card taps in a single device.


By End-User Industry: Healthcare Digitization Accelerates
Retail held 38.10% of 2025 transaction volumes, reflecting the scale of grocery, apparel, and electronics spending across e-commerce and brick-and-mortar outlets. Healthcare, however, emerges as the fastest-growing end-user at a 13.42% CAGR through 2031, making it a critical contributor to future Asia-Pacific payments market size expansion. Telemedicine platforms introduced during pandemic years remain sticky, and governments now embed co-payment and subsidy disbursement directly into wallets, promoting transparent billing and reduced administrative overhead. Singapore’s universal QR code program across 27 public hospitals showcases operational benefits: shorter queues, automatic insurance adjudication, and instant receipts to patient apps. These efficiencies cascade to private clinics that adopt the same tech stack to streamline claims with insurers eager for real-time visibility.
The healthcare payment opportunity extends into wearables that monitor chronic-disease patients and trigger micropayments for compliance milestones, thereby aligning incentives among payer, provider, and patient. Yet this data intensity raises privacy obligations, encouraging specialized processors that can store health information compartmentalized from payment credentials. Retail meanwhile reinforces dominance through omnichannel strategies connecting livestream shopping, social-media flash sales, and in-store scan-and-go lanes that bypass checkout counters altogether. Entertainment and hospitality rebound as travel restrictions ease, leveraging tokenized stored credentials to support subscription bundles for streaming, gaming, and loyalty-linked hotel stays. Transportation payments tie into ride-hailing super-apps, which stitch together ordering, insurance, and micro-investment features, turning each ride into a cross-sell opportunity.
Geography Analysis
China retained 43.05% of 2025 transaction value, anchored by super-apps that integrate e-commerce, ride-hailing, food delivery, and personal finance in one experience. Regulators now prioritize financial-system stability, capping wallet fee structures and curbing monopolistic positioning, which modestly tempers the segment’s expansion pace. In contrast, India’s 14.05% forecast CAGR propels the Asia-Pacific payments market ahead of global peers, driven by the government’s zero-cost UPI framework that levels the playing field between large banks and small fintechs. Rural inclusion efforts, such as feature-phone-based sound-wave payments, extend reach to populations that lack internet yet own basic handsets.
South Korea, Taiwan, and Singapore maintain high transaction values per capita by layering cross-border instant-payment features on top of already sophisticated domestic rails, capturing a disproportionate share of travel and tuition flows. Japan and Australia focus on interoperability among domestic card schemes, account-to-account transfers, and CBDC pilots that test offline settlement. Indonesia, Vietnam, and the Philippines chart steep adoption curves, but infrastructure gaps in power and connectivity occasionally disrupt service continuity, pushing operators to invest in edge-computing nodes and redundant network backhaul. Malaysia and Thailand exploit geographic positioning to act as payment hubs, connecting ASEAN settlement systems to India, China, and eventually the Middle East, thereby monetizing FX spreads and treasury services.
Competitive Landscape
Competitive intensity in the Asia-Pacific payments market remains moderate, with wallet operators, card networks, banks, and pure-play processors each claiming differentiated territory. Card schemes offset slowing physical-card growth by embedding network tokens in super-apps, allowing them to maintain interchange while relinquishing direct control over user interface. Mastercard’s Pay Local and Visa’s cross-border QR pilots illustrate how global brands stay relevant by riding on top of domestic wallet ubiquity rather than forcing card acceptance hardware.[3]Mastercard, “Mastercard launches Pay Local,” mastercard.com Banks increasingly outsource acquiring to processors specializing in real-time risk scoring, freeing internal resources to focus on wealth management and SME lending where margins remain higher.
Domestic wallets leverage captive ecosystems, ride-hailing in Indonesia, social media in China, food delivery in Thailand, to gather behavioral data that underpins credit-scoring models unavailable to international competitors due to data-sovereignty laws. Processors differentiate on uptime and geographic reach, offering merchants one contract that spans 50+ currencies and real-time tax calculation. Fintech upstarts target underserved niches like creator-economy payouts, building lightweight APIs that plug into video platforms needing instant settlement across multiple jurisdictions. Strategic partnerships, rather than outright acquisitions, dominate because foreign-ownership caps and national-interest policies restrict M&A in critical payment infrastructure.
Government experimentation with CBDCs introduces a new competitive layer, as central banks consider wholesale settlement solutions that bypass correspondent banking altogether. Should these pilots convert to production, processors must repoint back-office systems to new clearing mechanisms, potentially compressing fee margins unless value-added monitoring and analytics can justify premium pricing. Cyber-resilience also becomes a market-entry determinant; operators unable to demonstrate sub-second fail-over and ISO 27001 alignment risk exclusion from critical domestic rails. As a result, competitive advantage gravitates toward firms combining regulatory credibility, API agility, and balance-sheet capacity to absorb compliance and fraud-loss costs.
Asia Pacific Payments Industry Leaders
American Express Company
Naver Corporation (Naver Pay)
Mastercard Incorporated
Visa Inc.
Samsung Electronics Co., Ltd. (Samsung Pay)
- *Disclaimer: Major Players sorted in no particular order

Recent Industry Developments
- March 2025: Nium expanded operations across Australia and New Zealand, tripling monthly payment volume in Oceania on rising institutional adoption.
- January 2025: Thunes and Hyperwallet enabled real-time merchant payouts to six additional Asia-Pacific markets through Thunes’ direct network.
- January 2025: Banked and National Australia Bank launched Pay by Bank on Amazon Australia, introducing PayTo direct-account checkout.
- December 2024: Deutsche Bank rolled out Merchant Solutions across four Asia-Pacific countries, adding local payment method acceptance.


Asia Pacific Payments Market Report Scope
The scope of the study tracks transactions generated at offline (POS) physical stores and online (E-commerce/digital) channels in Asia-Pacific. Online payments include online purchases of goods and services, such as purchases on e-commerce websites and online bookings for travel and accommodation. However, they do not include online purchases of motor vehicles, real estate, utility bills (such as water, heating, and electricity), mortgage payments, loans, credit card bills, or purchases of shares and bonds. In the offline segment, all transactions at the physical point of sale are included in the market scope. It includes traditional in-store and face-to-face transactions, regardless of where they occur. Cash is also considered for both cases (cash on delivery for e-commerce sales).
The Asia-Pacific Payments Market is Segmented by Mode of Payment (Offline/Point of Sale (Card Payments, Digital Wallets, Cash), Online Sale/E-commerce (Card Payments, Digital Wallet)), End-user Industries (Retail, Entertainment, Healthcare, Hospitality), and Country (China, India, South Korea, Taiwan, Singapore, Philippines, Malaysia, Indonesia, Vietnam, Australia, and Japan).
The market sizes and forecasts are provided in terms of value (USD) for all the above segments.
Mode of Payment
| Point of Sale | Debit Card Payments |
| Credit Card Payments | |
| A2A Payments | |
| Digital Wallet | |
| Cash | |
| Other Point-of-Sale Payment Mode | |
| Online Sale | Debit Card Payments |
| Credit Card Payments | |
| A2A Payments | |
| Digital Wallet | |
| Cash-on-Delivery | |
| Other Online-Sale Payment Mode |
End-User Industry
| Retail |
| Entertainment |
| Hospitality |
| Healthcare |
| Transportation and Logistics |
| Other End-User Industries |
By Country
| China |
| India |
| South Korea |
| Taiwan |
| Singapore |
| Philippines |
| Malaysia |
| Indonesia |
| Vietnam |
| Australia |
| Japan |
| Other Countries |
| Mode of Payment | Point of Sale | Debit Card Payments |
| Credit Card Payments | ||
| A2A Payments | ||
| Digital Wallet | ||
| Cash | ||
| Other Point-of-Sale Payment Mode | ||
| Online Sale | Debit Card Payments | |
| Credit Card Payments | ||
| A2A Payments | ||
| Digital Wallet | ||
| Cash-on-Delivery | ||
| Other Online-Sale Payment Mode | ||
| End-User Industry | Retail | |
| Entertainment | ||
| Hospitality | ||
| Healthcare | ||
| Transportation and Logistics | ||
| Other End-User Industries | ||
| By Country | China | |
| India | ||
| South Korea | ||
| Taiwan | ||
| Singapore | ||
| Philippines | ||
| Malaysia | ||
| Indonesia | ||
| Vietnam | ||
| Australia | ||
| Japan | ||
| Other Countries | ||


Key Questions Answered in the Report
How big is the Asia-Pacific payments market in 2026?
The Asia-Pacific payments market size is USD 17.86 trillion in 2026 and is forecast to reach USD 33.08 trillion by 2031 at a 13.11% CAGR.
Which payment mode dominates consumer spending?
Digital wallets lead with 65.12% share in 2025, supported by QR ubiquity, embedded loyalty, and super-app ecosystems.
Which country will add the most new transaction value by 2031?
India is expected to post the fastest country-level growth at a 14.05% CAGR, driven by UPI expansion and rural smartphone adoption.
What end-user segment is growing quickest?
Healthcare payments are advancing at a 13.42% CAGR to 2031 as telemedicine and universal QR programs digitize billing.
How are global card networks staying relevant?
Networks like Mastercard and Visa embed tokenization and partner with local wallets through initiatives such as Pay Local and cross-border QR pilots.
Page last updated on:


