
Market Overview
| Study Period | 2020 - 2031 |
|---|---|
| Forecast Data Period | 2026 - 2031 |
| Base Year Market Size (2025) | USD 184.43 Billion |
| Market Size (2026) | USD 193.09 Billion |
| Market Size (2031) | USD 240.43 Billion |
| Growth Rate (2026 - 2031) | 4.48 % |
| Market Concentration | Low |
Major Players *Disclaimer: Major Players sorted in no particular order Image © Mordor Intelligence. Reuse requires attribution under CC BY 4.0. | |
Asia Pacific Paper Packaging Market Analysis by Mordor Intelligence
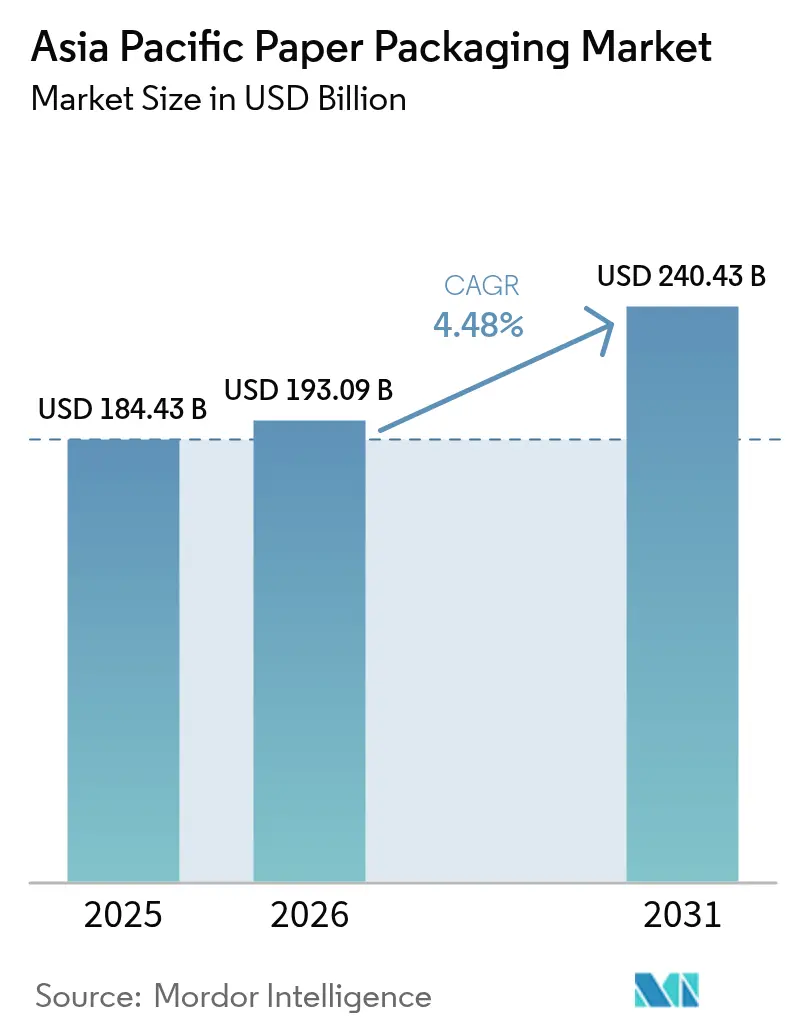
The Asia Pacific paper packaging market size is projected to be USD 184.43 billion in 2025, USD 193.09 billion in 2026, and reach USD 240.43 billion by 2031, growing at a CAGR of 4.48% from 2026 to 2031. Sustained urbanization, e-commerce penetration, and food delivery proliferation continue to stimulate corrugated-box demand, while premium brands push carton board adoption for shelf differentiation. Regulatory recycled-content mandates are tightening fiber supply, leading mills to integrate collection networks and upgrade de-inking capacity. Generative-AI design tools are shortening product-development cycles and trimming material waste, unlocking margin headroom for converters that invest early. Despite pulp-price swings and port congestion, capital flows into high-barrier coated substrates and bamboo-fiber grades indicate confidence in long-term growth.
Key Report Takeaways
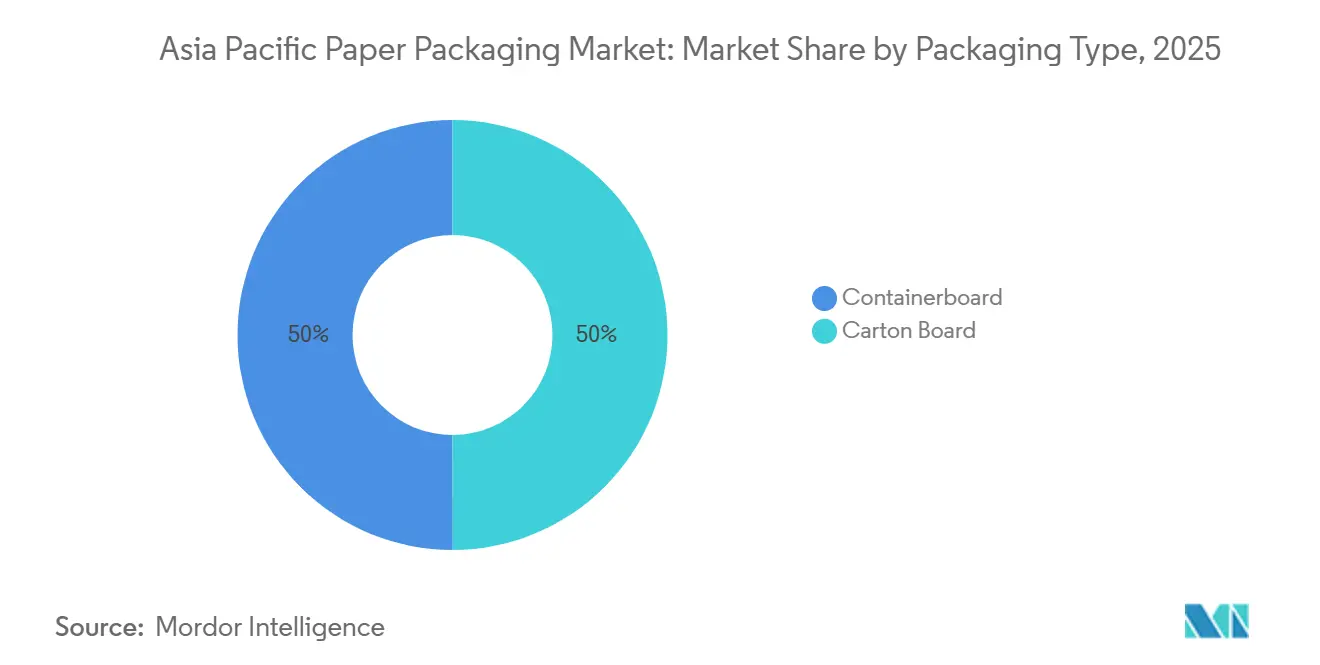
- By packaging type, containerboard commanded 50.01% revenue share in 2025, whereas carton board is advancing at a 5.84% CAGR through 2031.
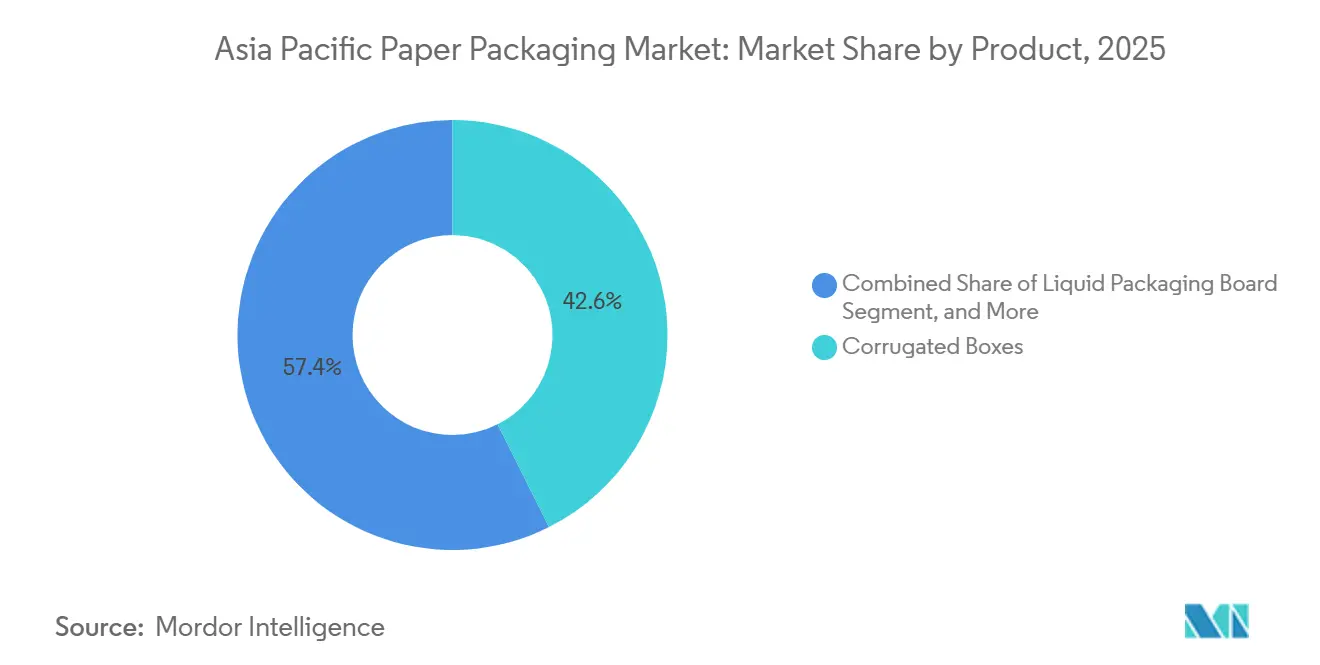
- By product, corrugated boxes led with 42.59% of the Asia Pacific paper packaging market share in 2025; liquid packaging board is projected to expand at a 5.31% CAGR to 2031.
- By grade, folding boxboard held 32.38% share of the Asia Pacific paper packaging market size in 2025, while solid unbleached sulfate is accelerating at a 5.98% CAGR through 2031.
- By geography, China accounted for 48.84% of 2025 revenue and Vietnam is growing at a 5.22% CAGR to 2031.
Note: Market size and forecast figures in this report are generated using Mordor Intelligence’s proprietary estimation framework, updated with the latest available data and insights as of 2026.
Market Trends and Insights
Drivers Impact Analysis of Asia Pacific Paper Packaging Market*
| Driver | (~) % Impact on CAGR Forecast | Geographic Relevance | Impact Timeline |
|---|---|---|---|
| Surge in E-commerce Packaging Demand | +1.20% | China, India, Southeast Asia core; spillover to Japan, Australia | Short term (≤ 2 years) |
| Rapid Shift Toward Recycled Paper Grades | +0.90% | Global, with early adoption in Japan, Australia, New Zealand; regulatory push in ASEAN | Medium term (2-4 years) |
| Expansion of Food, Beverage and Healthcare Sectors | +0.80% | India, Indonesia, Vietnam, Thailand; urban clusters in China | Medium term (2-4 years) |
| High-Barrier Coated Paper Replacing Plastics | +0.70% | Japan, South Korea, Singapore; premium segments in China, India | Medium term (2-4 years) |
| EPR and Content-Mandate Regulations Across Asia-Pacific | +0.60% | Vietnam, Thailand, Singapore, Australia; phased rollout in Indonesia, Philippines | Long term (≥ 4 years) |
| Generative AI-Enabled Design and Short-Run Printing | +0.40% | Japan, South Korea, Australia; pilot deployments in China, India | Long term (≥ 4 years) |
| Adoption of Bamboo and Agricultural-Residue Fibre | +0.30% | China, India, Vietnam, Thailand; niche applications in Indonesia | Long term (≥ 4 years) |
| Source: Mordor Intelligence | |||
Surge in E-commerce Packaging Demand
Online retail penetration in China climbed to 27.6% of total retail sales during 2025, and India’s e-commerce orders increased 21%.[1]National Bureau of Statistics of China, “Online Retail Sales Data 2025,” stats.gov.cn Parcel-volume spikes are fragmenting order sizes, so logistics providers prefer lighter, stronger containerboard grades. Parcel hubs across Southeast Asia now standardize corrugated dimensions, driving bulk orders for high-compression single-wall boxes. Digitally printed, short-run folding cartons enable direct-to-consumer brands to personalize unboxing experiences, which fuels additional substrate demand.
Rapid Shift Toward Recycled Paper Grades
Japan’s 60% recycling-rate target for paper packaging by 2030 and Australia’s 50% recycled-content mandate for 2025 are prompting mills to retrofit de-inking lines and secure domestic waste streams.[2]Ministry of the Environment Japan, “Plastic Resource Circulation Act Implementation Guidelines,” env.go.jp Vietnam’s 25% recycled-content rule for corrugated boxes in export zones accelerates investment in local collection cooperatives. Recovered-paper imports into Southeast Asia fell 12% year on year in 2025, signalling improved self-sufficiency and premium pricing for certified sustainable grades.
Expansion of Food, Beverage and Healthcare Sectors
India’s 8.7% growth in food processing and Indonesia’s 6.3% beverage expansion in 2025 enlarged the addressable base for folding cartons and liquid packaging board. Thailand’s 9.1% uptick in pharmaceutical exports spurred demand for tamper-evident cartons compliant with ASEAN serialization. These shifts steer converters toward higher value substrates with moisture, grease, and tamper-proof coatings.[3]Ministry of Food Processing Industries India, “Annual Report 2024-25,” mofpi.gov.in
High-Barrier Coated Paper Replacing Plastics
Aluminium-free aseptic cartons, water-based mineral coatings, and bio-based grease barriers launched in 2024-2025 have matched, or in some niches surpassed, plastic laminates on oxygen and moisture impermeability. Quick-service restaurant chains in Japan swapped plastic wraps for coated paper, eliminating 18,000 t of plastic annually. Premium cosmetics brands in South Korea now source mono-material cartons that maintain product integrity without multi-layer films.
Restraints Impact Analysis of Asia Pacific Paper Packaging Market*
| Restraint | (~) % Impact on CAGR Forecast | Geographic Relevance | Impact Timeline |
|---|---|---|---|
| Pulp Price Volatility and Supply Shocks | -0.80% | Global, acute in import-dependent markets (Japan, South Korea, Thailand) | Short term (≤ 2 years) |
| Cost-Competitive Flexible Plastic Alternatives | -0.60% | India, Indonesia, Vietnam; price-sensitive consumer segments | Medium term (2-4 years) |
| Carbon-Intensity Pressure on Paper Mills | -0.50% | China, Japan, Australia; export-oriented producers facing EU CBAM | Medium term (2-4 years) |
| Chinese Over-Capacity Driving Price Wars | -0.40% | China domestic; spillover to Southeast Asia via exports | Short term (≤ 2 years) |
| Logistics Bottlenecks from Emerging APAC Ports | -0.30% | Vietnam, Indonesia, Philippines; congestion at secondary ports | Short term (≤ 2 years) |
| Source: Mordor Intelligence | |||
*Our forecasts treat driver/restraint impacts as directional, not additive. The impact forecasts reflect baseline growth, mix effects, and variable interactions.
Asia Pacific Paper Packaging Market Segment Analysis
By Packaging Type:
Carton Board Gains on Premium FormatsContainerboard held a 50.01% share in 2025, buoyed by e-commerce corrugated-box volumes, yet carton board is forecast to outpace the Asia Pacific paper packaging market by 130 bp with a 5.84% CAGR through 2031. Rising demand for high-definition printing and tactile finishes in premium food and cosmetics supports folding-carton uptake.
Generative-AI structural design trims material weight, widening cost gaps with plastic while preserving integrity. Meanwhile, ultra-lightweight containerboard below 100 g m-2 aims to sustain share in logistics as reusable plastic totes nibble at automotive and electronics transport.


By Product:
Liquid Packaging Board Rides Dairy ExpansionIn 2025, folding boxboard commanded a leading share of 32.38% in terms of volume, driven by its widespread use in packaging applications such as food, cosmetics, and pharmaceuticals due to its lightweight and high-stiffness properties. However, solid unbleached sulfate, with a 5.98% CAGR, emerged as the fastest-growing segment. This growth is fueled by the increasing demand for grease-resistant takeaway formats in the quick-service food sector, where durability and resistance to oil and moisture are critical. Coated recycled boards are also witnessing significant gains, particularly in regions with mature waste-paper systems, such as Japan and Australia.
These regions benefit from well-established recycling infrastructure, which supports the production of high-quality coated recycled boards for various packaging needs, including food and beverage cartons. On the containerboard front, white-top kraftliner is increasingly catering to exports of moisture-sensitive electronics, where its superior strength and moisture resistance are essential for protecting high-value goods during transit. Meanwhile, white-top testliner is predominantly used domestically in India and China, where it capitalizes on the cost advantages of recycled furnish economics. The growing e-commerce sector in these countries further drives the demand for white-top testliner, as it is widely used in the production of corrugated boxes for packaging and shipping. This trend highlights the importance of sustainable and cost-effective materials in meeting the rising demand for packaging solutions in both domestic and export markets.

By End-User Industry:
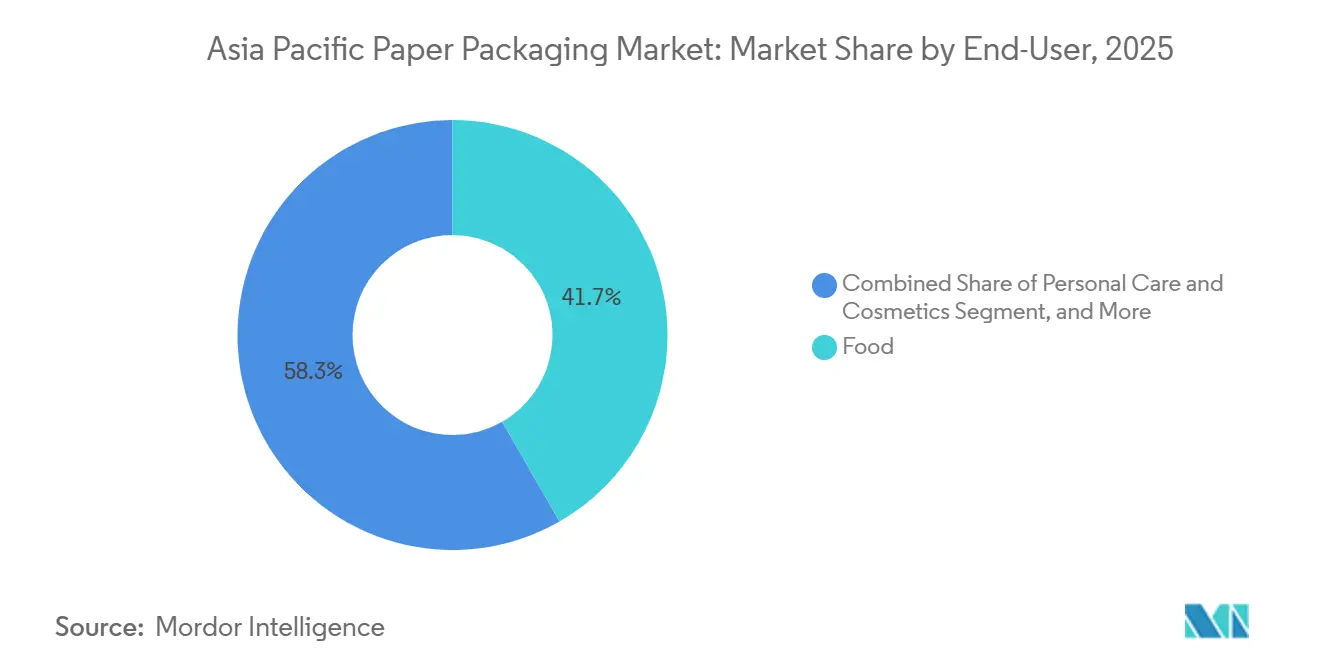
Personal Care Accelerates on Refill ModelsIn 2025, food applications made up 41.71% of the demand, yet personal care and cosmetics are set to experience the fastest growth, projected at a 5.08% CAGR. This growth in the personal care and cosmetics market is driven by increasing consumer awareness of sustainable packaging and eco-friendly products. Beauty giants from Korea and Japan introduced paper-based refills, slashing virgin plastic usage by 40%. This initiative aligns with global sustainability goals and has prompted converters to provide precision-moulded cartons equipped with snap-fit closures, ensuring both functionality and environmental responsibility.
The beverage sector is expanding in tandem with the rising popularity of plant-based milks, as consumers increasingly seek healthier and more sustainable alternatives to traditional dairy products. This trend is further supported by innovations in plant-based formulations and packaging solutions that cater to environmentally conscious buyers. Meanwhile, the healthcare industry sees a consistent uptick in demand, driven by serialization mandates aimed at improving supply chain transparency and combating counterfeit products. These mandates are encouraging manufacturers to adopt advanced packaging technologies and traceability solutions to ensure compliance and enhance patient safety.
Geography Analysis
China Paper Packaging Market
In 2025, China accounted for 48.84% of the revenue, driven by its vast domestic consumption and robust export flows of corrugated boxes. While an oversupply has led to price competition, the demand for urban deliveries has sustained the volume. This balance between domestic consumption and export demand highlights China's pivotal role in the regional market. However, the oversupply issue continues to temper the pace of growth, requiring strategic adjustments to maintain competitiveness in the market.
India, Japan and ASEAN Paper Packaging Market
India, buoyed by food processing and deeper penetration of tier-3 e-commerce, saw a 6.8% growth in fiscal 2025. Despite this growth, gaps in rural logistics are hindering faster acceleration, presenting a challenge for the market to fully capitalize on its potential. Vietnam stands out in the region, with a projected 5.22% CAGR growth rate until 2031. The country's growth is fueled by foreign direct investment (FDI) in electronics and stringent recycled-content regulations, which are prompting upgrades in mills. These factors position Vietnam as a key player in the Asia Pacific market, leveraging its regulatory framework and investment inflows to drive sustained growth. Japan's mature market is making slow strides, focusing on coated-paper niches, even as the rise of reusable totes impacts containerboard demand. Both Indonesia and Thailand are experiencing mid-single-digit growth, although this is being somewhat counterbalanced by imports from China.
Australia and New Zealand Paper Packaging Market
Australia and New Zealand, which together represent 5% of the regional revenue, are capitalizing on stringent recycling targets, allowing them to command premium prices for substrates. Other markets in the Asia Pacific are aligning with regional averages, buoyed by a resurgence in food services driven by tourism. This recovery in tourism-led food services is playing a crucial role in stabilizing and supporting growth across the region.
Regulatory Landscape
Regulation across Asia Pacific is shifting from plastics-focused waste rules toward integrated EPR and recycled-content requirements that cover paper packaging, increasing compliance documentation needs and the requirement for verified recycled-fiber supply. In April 2026, India operationalized Central Pollution Control Board (CPCB) EPR guidelines for paper packaging, including category-wise obligations and periodic reporting. In Vietnam, Decree No. 110/2026/ND-CP introduced recycling responsibility for paper packaging, with an initial 20% mandatory recycling rate.
Regional trade and standardization initiatives are also affecting specification choices for exporters and multinational brand owners. From June 1, 2026, a Green Packaging Mutual Recognition Arrangement under RCEP commenced for participating markets (including China, Australia, New Zealand, Japan, and South Korea), allowing recognized certifications to be accepted without repeat testing. This supports cross-border shipments of compliant paper-based packs and increases the value of converters that can meet recognized eco-packaging standards at scale.
Competitive Landscape
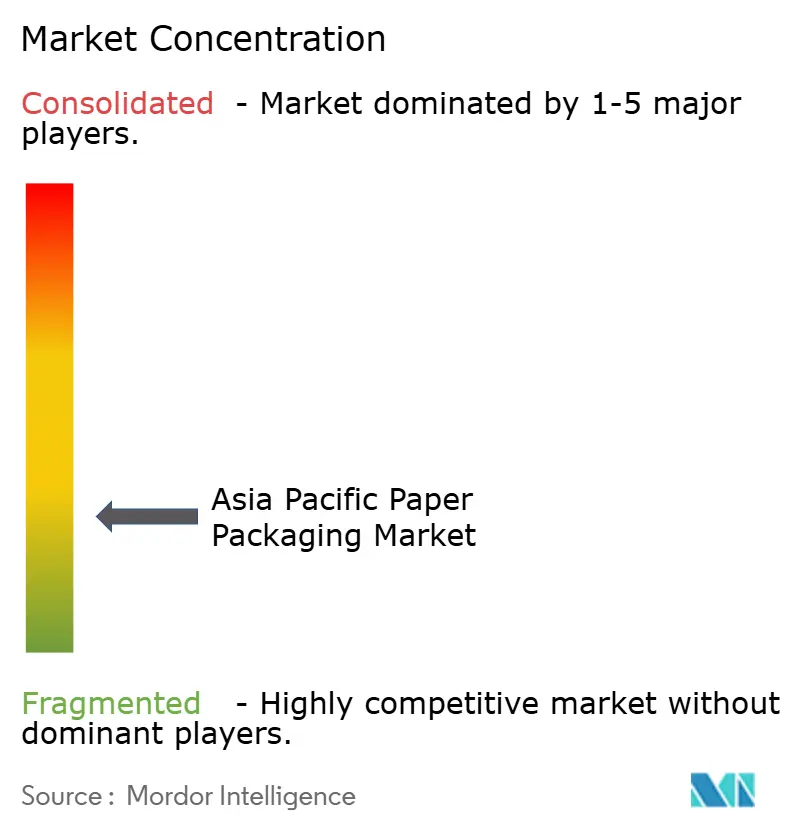
In the Asia Pacific paper packaging market, the landscape is moderately fragmented, with the top five players collectively holding around 35% of the installed capacity. Nine Dragons Paper and Lee and Man, leveraging their cost leadership through recovered-paper integration, opted to halt their expansion in 2025 to mitigate oversupply concerns. Meanwhile, international giants like Mondi, International Paper, and the newly merged Smurfit WestRock are shifting their focus towards AI-assisted carton designs and barrier-coated grades, allowing them to command price premiums of 15-20%.
Investments in high-barrier projects are evident with APP's 250 kt/year liquid-board line in Indonesia and Mondi's EUR 120 million (USD 128 million) upgrade to FunctionalBarrier Paper. Disruptors in the market, specializing in digital short-run printing, are capturing the attention of e-commerce brands, particularly those requiring orders under 5,000 units. Patent filings, especially for water-based coatings and bio-adhesives, saw an 18% surge in 2025, predominantly driven by firms from Japan and Korea.
While competitive tensions are heightened in the containerboard segment due to Chinese dumping practices, the liquid packaging board segment remains insulated from intense rivalry, thanks to prevailing technical challenges.
Asia Pacific Paper Packaging Industry Leaders
SCG Packaging PCL
International Paper Company
Oji Holdings Corporation
Sarnti Packaging Co., Ltd.
Mondi Group
- *Disclaimer: Major Players sorted in no particular order
Asia Pacific Paper Packaging Market Companies Covered in this Report
- Nine Dragons Paper (Holdings) Ltd
- Oji Holdings Corporation
- SCG Packaging PCL
- International Paper Company
- Mondi PLc
- Smurfit WestRock plc
- Huhtamaki Oyj
- Rengo Co., Ltd
- DS Smith plc
- Pratt Industries, Inc.
- Stora Enso Oyj
- Nippon Paper Industries Co., Ltd.
- APP (Asia Pulp & Paper) Group
- Visy Industries Holdings Pty Ltd
- Harta Packaging Industries
- Sarnti Packaging Co. Ltd
- Hong Thai Packaging Co. Ltd
- New Asia Industries Co. Ltd
- C&H Paperbox (Thailand) Co. Ltd
- Continental Packaging (Thailand) Co. Ltd
- Lee & Man Paper Manufacturing Ltd
- Thai Containers Group Co., Ltd
- Shandong Sun Paper Industry Joint Stock Co., Ltd
- Greatview Aseptic Packaging Co., Ltd

Market Opportunities and Future Outlook
Compliance-driven upgrades and regional localization are creating whitespace in recycled-content-ready grades, traceable chain-of-custody systems, and capacity built close to high-growth consumption and export manufacturing clusters. India’s CPCB EPR framework for paper packaging, effective in 2026, formalizes recycled-fiber content targets for FY 2026-27 and pushes converters toward de-inking access, certified recovered paper, and tighter reporting, which tends to favor integrated players and specialist recyclers able to provide audited inputs.
A second opportunity area is intra-Asia trade simplification and faster qualification cycles for green paper packaging used by e-commerce, food service, and industrial goods. The RCEP Green Packaging Mutual Recognition guidelines, effective June 1, 2026, reduce redundant testing across key markets, supporting exporters that standardize substrates and inks or coatings to recognized specifications. On the supply side, new and announced investments show where capacity is being added: Hoi Fu Paper Packaging broke ground in April 2026 on a USD 64.6 million plant in Indonesia’s Kendal SEZ, and SCG Packaging announced a Vietnam corrugated expansion in May 2026 to add 26,800 tons per year, reinforcing Southeast Asia as a manufacturing and conversion hub for regional brand and export demand.
Recent Industry Developments in Asia Pacific Paper Packaging Market
- June 2026: International Paper completed the USD 360 million acquisition of North Pacific Paper Company (NORPAC), adding containerboard capacity and strengthening its supply position on the US West Coast. The acquisition increases optionality for global packaging networks serving Asia-Pacific trade lanes and raises competitive pressure on cost and service for containerboard-linked export packaging.
- May 2026: SCG Packaging announced an investment of about Baht 748 million to expand corrugated container capacity in Ho Chi Minh City, Vietnam, adding 26,800 tons per year with start-up targeted for September 2027. The expansion strengthens SCGP’s local footprint in a fast-growing conversion market tied to export manufacturing and e-commerce fulfillment requirements.
- November 2025: Nine Dragons Paper idled 400 kt of containerboard capacity in Guangdong to stabilize domestic pricing amid oversupply conditions. The curtailment reflects tighter operating discipline in China’s containerboard segment and influences regional pricing dynamics given China’s role in exporting paper-based packaging materials.


Asia Pacific Paper Packaging Market Report Scope and Research Methodology
Market Definition and Coverage
For this study, the market includes paper-based packaging materials and finished packaging used across Asia-Pacific, counted in value terms across common paperboard and containerboard uses and the converted packaging products sold into end users.
Scope exclusions: We exclude packaging made mainly from plastics, glass, or metals, and we do not count machinery, printing equipment, or recycling services as part of the market value.
Segments Covered in This Report
- By Packaging Type
- Carton Board
- Solid Bleached Sulfate (SBS)
- Solid Unbleached Sulfate (SUS)
- Folding Boxboard (FBB)
- Coated Recycled Board (CRB)
- Uncoated Recycled Board (URB)
- Containerboard
- White-top Kraftliner
- Other Kraftliners
- White-top Testliner
- Other Testliners
- Semi-chemical Fluting
- Recycled Fluting
- Carton Board
- By Product
- Folding Cartons
- Corrugated Boxes
- Liquid Packaging Board
- Paper Bags and Sacks
- By End-User Industry
- Food
- Beverage
- Healthcare and Pharmaceuticals
- Personal Care and Cosmetics
- Household Care
- Electrical and Electronics
- Other End-User Industry
- By Geography
- China
- India
- Japan
- Indonesia
- Thailand
- Vietnam
- Australia and New Zealand
- Rest of Asia-Pacific
Data Sources, Market Sizing, and Validation
Desk Research
Desk research was used to frame demand signals, supply-side capacity context, and policy-led shifts that affect paper packaging consumption in Asia-Pacific. We reviewed public sources such as national statistics offices, UN Comtrade trade flows, World Bank macro indicators, and FAO forestry and pulpwood datasets to understand fiber availability and trade intensity. Standards and regulatory references (for example, packaging waste rules and recycled-content guidance published by governments) were also used to interpret how material choices can move between grades over time.
To ground the packaging end-use picture, we relied on company annual reports, investor presentations, and industry press covering food, beverage, and e-commerce packaging trends in the region. In a few places, paid subscription datasets that track company financials, shipment-level import and export records, and patent filings were used to cross-check capacity additions and technology shifts, before those assumptions were carried into the model. The sources listed here are illustrative only, and many other public references were consulted for data collection, validation, and clarification.
Primary Interviews and Surveys
Primary work focused on checking what is actually being bought and converted in key Asia-Pacific countries, and then confirming pricing behavior by grade and product during the base year. We spoke with a mix of paperboard producers, converters, distributors, and large packaging buyers so gaps from desk research could be filled, and assumptions on mix shifts, demand cycles, and margins could be stress-tested across regions.
Distribution of primary research fieldwork respondents
| Company type | Respondent position |
|---|---|
| Top tier: 35% | CXOs: 13% |
| Mid tier: 46% | Functional/Unit leaders: 28% |
| Smaller Players: 19% | Managers: 59% |
Market-Sizing & Forecasting
The core sizing logic is a top-down build where packaging demand is reconstructed from end-use activity and packaging intensity, and then split into paperboard and containerboard driven products that fit the defined scope. Once the totals are formed, they are corroborated with selective bottom-up approximations like sampled ASP times volume checks for corrugated boxes and folding cartons, along with converter revenue checkpoints, which are then used to tune the final totals when gaps show up.
Inputs used in the model include paperboard and containerboard output indicators, packaging mix shifts between corrugated boxes, folding cartons, liquid packaging board, and paper bags, and the movement in average selling prices by grade (including recycled versus virgin and coated versus uncoated behavior). We also track country-level e-commerce shipping growth, packaged food and beverage production signals, and import or export movements for key paper and paperboard categories to detect supply tightness that can lift pricing. Where bottom-up checks are incomplete for smaller countries, scaling factors are applied using macro and industry proxies, and then revisited after interviews.
For forecasting, scenario analysis was used so we could test base, conservative, and faster-adoption paths for sustainability-led substitution, while staying anchored to the agreed demand drivers from experts. Assumptions were updated by country to reflect differences in recycled fiber availability, policy enforcement, and the pace of capacity additions.
Data Validation & Update Cycle
Validation is done through triangulation across multiple checkpoints, so the final numbers are not dependent on a single data series or one set of interviews. We run variance checks year over year, compare implied per-capita packaging consumption against independent signals, and then review outliers by country, grade, or product before sign-off.
Reports are refreshed annually, and interim updates are triggered when material events occur, such as major capacity startups, sharp movements in pulp or recovered paper prices, or new packaging rules that change the material mix. Before delivery, a final analyst pass is completed so clients receive the latest view that matches the most recent public updates and field feedback.
Mordor Intelligence's Asia Pacific Paper Packaging Market Size Measured Against Other Published Estimates
Published estimates for Asia-Pacific paper packaging do not always match because the market boundary can shift based on what is counted as paper packaging, and how paperboard grades and converted products are treated. Differences also come from whether the estimate is anchored to base-year pricing realities or built using forward-looking price assumptions that can overstate or understate current value.
By tracking grade-level price movement and country mix shifts, and then refreshing the conversion from paper and paperboard volumes into packaging value with periodic interview checks, Mordor Intelligence keeps the estimate tied to cartonboard and containerboard based products like folding cartons, corrugated boxes, liquid packaging board, and paper bags within Asia-Pacific.
Benchmark comparison
| Source | Market Size | Gaps in Research Methodology |
|---|---|---|
| Mordor Intelligence | USD 193.09 B (2026) | |
| Industry Publisher A | USD 181.94 B (2025) | The year differs and the longer forecast window can change how base-year pricing is treated, and some versions lean more on packaged-use segmentation that may not align perfectly with grade and product mapping used here. |
| Industry Publisher B | USD 85.28 B (2024) | The value appears to reflect a narrower paper-based subset and a different segmentation lens (for example, emphasizing only selected materials or formats), which can leave out major paperboard converted categories that drive total market value. |
The spread in the table mainly comes from scope boundaries and the base year chosen, followed by how pricing and mix are carried into the value build. When the model is kept traceable to clear product mapping, country demand signals, and repeatable price checks, the resulting market size is easier to reconcile and update year after year.


Key Questions Answered in the Report
How fast is carton board growing relative to containerboard in Asia Pacific paper packaging?
Carton board is advancing at a 5.84% CAGR through 2031, outpacing containerboard and the overall market by about 130 bp.
Which product segment is expanding the quickest?
Liquid packaging board posts the highest growth at a 5.31% CAGR due to rising aseptic dairy and juice adoption.
What recycled-content mandates influence purchasing decisions?
Vietnam requires 25% recycled fiber in containerboard by 2028, while Australia achieved 50% recycled content across all packaging in 2025.
Why is solid unbleached sulfate in demand?
Quick-service restaurants favor grease-resistant, unbleached kraft takeaway formats, driving SUS’s 5.98% CAGR outlook.
Which country is the fastest-growing market?
Vietnam leads with a projected 5.22% CAGR through 2031, propelled by FDI manufacturing and strict EPR rules.
How are converters leveraging AI?
Generative-AI design tools reduce material waste by up to 12% and cut folding-carton design cycles from weeks to days.
Page last updated on:





