Market Overview
| Study Period | 2020 - 2031 |
|---|---|
| Forecast Data Period | 2026 - 2031 |
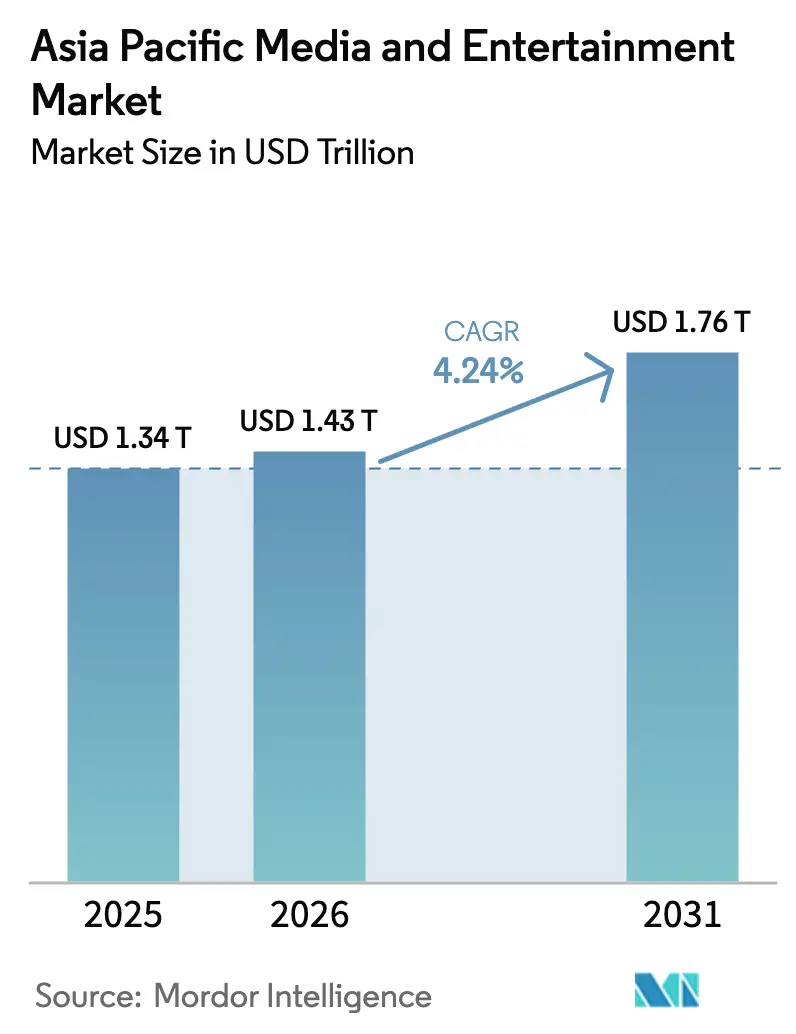
| Base Year Market Size (2025) | USD 1.34 Trillion |
| Market Size (2026) | USD 1.43 Trillion |
| Market Size (2031) | USD 1.76 Trillion |
| Growth Rate (2026 - 2031) | 4.24% CAGR |
| Market Concentration | Medium |
Major Players *Disclaimer: Major Players sorted in no particular order Image © Mordor Intelligence. Reuse requires attribution under CC BY 4.0. | |
Asia Pacific Media And Entertainment Market Analysis by Mordor Intelligence
The Asia Pacific Media And Entertainment Market size is projected to expand from USD 1.34 trillion in 2025 and USD 1.43 trillion in 2026 to USD 1.76 trillion by 2031, registering a CAGR of 4.24% between 2026 to 2031. Mobile-first habits, accelerating 5G rollouts, and localized streaming libraries are steering consumer time and advertiser spend toward digital channels, placing pressure on legacy television and print formats. Gaming platforms benefit from the region’s youthful demographic and smartphone ubiquity, while subscription video services gain traction through regional-language content that boosts stickiness and curbs churn. Advertisers are shifting budget toward programmatic video and connected-TV placements that deliver measurable outcomes, prompting broadcasters to bundle ad-supported tiers with premium packages. Consolidation among studios and distributors signals a pivot from geographic expansion toward vertical integration as firms seek end-to-end control of creation, curation, and monetization.
Key Report Takeaways
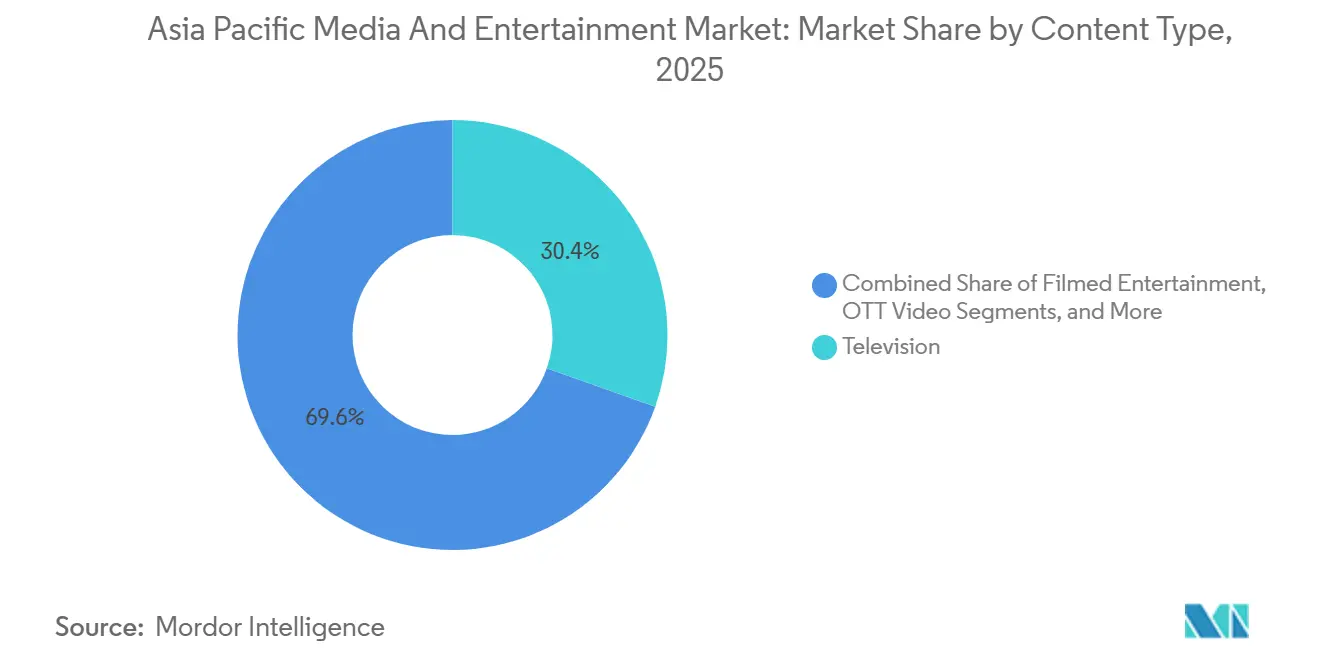
- By content type, television commanded the largest 34.64% slice of Asia Pacific media and entertainment market share in 2025 while OTT video registered the top growth at a 5.42% CAGR through 2031.
- By platform, mobile held a 41.23% share of the Asia Pacific media and entertainment market size in 2025, whereas smart-television and connected devices delivered the quickest 6.21% CAGR for 2026-2031.
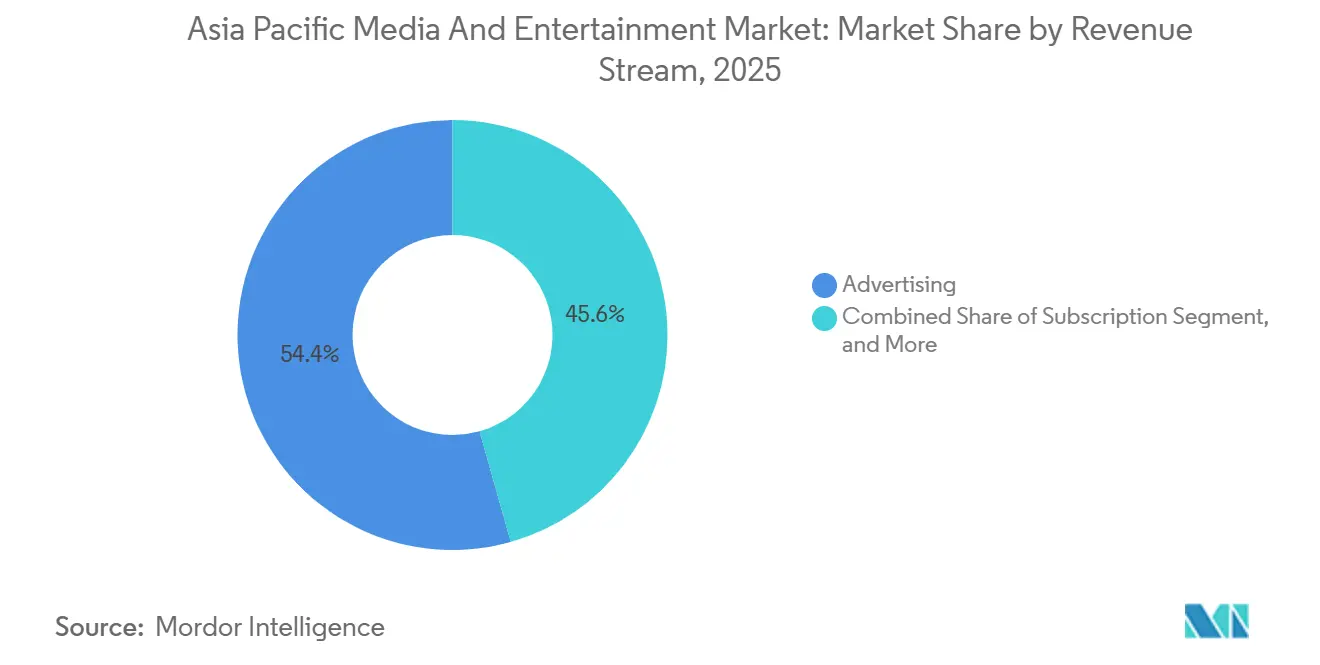
- By revenue stream, advertising generated a dominant 54.37% share in 2025 but subscription revenue expanded the fastest, rising at a 5.21% CAGR over the forecast period.
- By geography, China contributed 44.81% of 2025 regional revenue, yet India outpaced all peers with a 4.92% CAGR projected for 2026-2031.
Note: Market size and forecast figures in this report are generated using Mordor Intelligence’s proprietary estimation framework, updated with the latest available data and insights as of 2026.
Asia Pacific Media And Entertainment Market Trends and Insights
Drivers Impact Analysis*
| Driver | (~) % Impact on CAGR Forecast | Geographic Relevance | Impact Timeline |
|---|---|---|---|
| Rising Smartphone Penetration and Cheap Data | 1.2% | India, Indonesia, Vietnam, Philippines | Short term (≤ 2 years) |
| Surging OTT Investment in Regional-Language Content | 1.0% | India, Indonesia, Thailand, Malaysia | Medium term (2-4 years) |
| Expansion of 5G-Fuelled e-Sports and Cloud Gaming | 0.8% | China, South Korea, Japan, urban APAC | Medium term (2-4 years) |
| Shift of Ad Spend from TV to Digital Performance Channels | 0.7% | Global APAC, with early gains in China, India, Australia | Short term (≤ 2 years) |
| AI-Based Hyperlocal Content Localisation and Dubbing | 0.4% | Southeast Asia core, spill-over to South Asia | Long term (≥ 4 years) |
| Volumetric Capture Studios Enabling Immersive Live Events | 0.3% | Japan, South Korea, Singapore, Australia | Long term (≥ 4 years) |
| Source: Mordor Intelligence | |||
Rising Smartphone Penetration And Cheap Data
More than 1.2 billion smartphones circulated across the region in 2025, putting adoption above 75% in cities and 55% in rural districts. Indian data tariffs plummeted to USD 0.26 per GB following Reliance Jio’s price war with Bharti Airtel and Vodafone Idea, collapsing the historical reach-versus-revenue trade-off. The cost reset opened Tier-2 markets such as Lucknow, Coimbatore, and Visakhapatnam, which cable networks could not previously serve profitably. Indonesia shipped 38 million units in 2024, up 12% year-over-year, with sub-USD 150 models capturing 68% share.[1]Organisation for Economic Co-operation and Development, “OECD Economic Surveys Indonesia,” oecd.org Vietnam’s mobile-internet users climbed to 72 million in 2025 as 4G coverage reached 95% of the population. Content economics shifted accordingly, as platforms now commission short-form vertical videos that cut episode budgets by 30-40% yet raise output velocity, exemplified by Douyin’s 10 million creators and 750 million daily users.
Surging OTT Investment In Regional-Language Content
Platforms poured more than USD 4 billion into Tamil, Telugu, Kannada, Bengali, Bahasa Indonesia, and Thai originals between 2023 and 2025, with Reliance allocating INR 4,000 crore (USD 480 million) to JioHotstar and Zee Entertainment commissioning 72 regional titles in 2024. Regional dialects reach 600 million Indians whose average revenue per user trails urban benchmarks by 40% but whose acquisition costs are one-third lower. Vidio and True Digital followed suit across Southeast Asia, targeting the 85% of users preferring native-language content. Lower artist fees allow three regional series to be produced for the cost of one national blockbuster, while recommendation engines surface these shows to diaspora viewers, unlocking export revenues. Compliance with India’s 2021 IT rules adds roughly USD 2-3 million in annual governance expense per service, but operators accept the trade-off for deeper engagement.
Expansion Of 5G-Fuelled E-Sports And Cloud Gaming
Fifth-generation networks covered 45% of Asia Pacific residents by end-2025, slashing latency to 15-20 milliseconds.[2]Hyun-Woo Kim, “Asia Pacific 5G Coverage Mobility Report 2025,” Ericsson, ericsson.com Tencent’s cloud-gaming pilots in Guangdong and Shanghai let mid-range phones stream console-quality titles, while its mobile hits Honor of Kings and Peacekeeper Elite generated CNY 51.8 billion (USD 7.1 billion) in Q3 2024. South Korea attracted 28 million unique e-sports viewers in 2024, and Japan’s Nippon Professional Baseball used 5G edge computing for real-time stat overlays, luring younger fans. The model flips console economics: server capacity and libraries rather than hardware now dictate competitive edge, giving leverage to cloud providers like Amazon Web Services and Alibaba Cloud that handled 34% more gaming workloads in 2024. Regulatory gating remains: China caps new game approvals and limits minors to three hours weekly, favoring incumbents with licensing teams.
Shift Of Ad Spend From TV To Digital Performance Channels
Digital captured 72% of 2025 Asia Pacific media ad outlays, up from 68% in 2023, while linear TV revenue fell 6% in India, 4% in Australia, and 3% in Japan. Brands flock to programmatic video and social commerce for measurable return on ad spend; Douyin alone handled USD 270 billion in gross merchandise value via live commerce, charging 8-12% commissions. India’s USD 13.5 billion ad market grew 5.8% in 2024, yet television’s slice slid to 28% as FMCG marketers redeployed budgets to Meta, Google, and Amazon. Premium scripted producers feel the pinch because ad dollars flow to user-generated video with lower costs. Studios respond by elevating subscription pricing, seen in Netflix’s 10-15% Japan and South Korea increases that saw minimal churn.
Restraints Impact Analysis*
| Restraint | (~) % Impact on CAGR Forecast | Geographic Relevance | Impact Timeline |
|---|---|---|---|
| Endemic Digital Piracy and Content Leakage | -0.6% | India, Indonesia, Vietnam, China | Short term (≤ 2 years) |
| Fragmented Cross-Border Regulatory Regimes | -0.5% | APAC-wide, acute in China, India, Indonesia | Medium term (2-4 years) |
| Escalating VFX/Animation Talent Costs | -0.3% | India, China, South Korea, Japan | Medium term (2-4 years) |
| Synthetic Media Deepfake-Induced Brand Safety Concerns | -0.2% | Singapore, Australia, Japan, urban APAC | Long term (≥ 4 years) |
| Source: Mordor Intelligence | |||
Endemic Digital Piracy And Content Leakage
Piracy drains an estimated USD 2.8 billion a year, with India responsible for 38% of global traffic and Indonesia ranking fourth. India blocked 18 sites in August 2024, but mirror domains resurfaced within 72 hours, often hosted in low-enforcement jurisdictions. In Indonesia, illegal platforms priced at USD 1-2 per month undercut legal services costing USD 3-5, contributing to a 42% theatrical revenue slide since 2019. Rights-holders now budget 8-12% of distribution expense for watermarking and automated takedowns, squeezing margins where ARPU already sits below USD 3. China’s 2024 Operation Sword Net seized USD 340 million in assets, yet 15-20% of premium releases still surface on piracy sites within a day.
Fragmented Cross-Border Regulatory Regimes
Eleven major Asia Pacific jurisdictions maintain unique content-rating, data-localization, and ownership statutes, lifting operating costs 25-35% versus homogeneous blocks such as the European Union. China demands on-shore data storage and joint ventures with licensed state entities, blocking Netflix and YouTube, while India’s 2021 IT rules force platforms to appoint grievance officers and delete flagged content inside 72 hours. Indonesia requires 60% prime-time local content, and Singapore mandated AI watermarking of synthetic media from March 2025, adding USD 0.5-1 million in integration spend per service. Platforms often domicile in Singapore or Hong Kong for tax efficiency, then serve Southeast Asia via content-delivery networks, but the tactic risks exposure to abrupt policy shifts like Thailand’s proposed 7% VAT on foreign streaming. Malaysia restricts programming offensive to Islam, and Australia’s eSafety Commissioner wields takedown power, together deterring smaller entrants.
*Our forecasts treat driver/restraint impacts as directional, not additive. The impact forecasts reflect baseline growth, mix effects, and variable interactions.
Segment Analysis
By Content Type: OTT Video Extends Lead Over Legacy Formats
Television generated the biggest slice of 2025 revenue at 34.64%, but subscriber leakage accelerated as India shed 8 million cable viewers and Japan’s NHK collected 5% fewer license fees than in 2024. OTT video, expanding at a 5.42% CAGR, captured rising time-spent metrics as Netflix committed USD 2.5 billion to Korean titles and Amazon advanced regional-language investments. The Asia Pacific media and entertainment market size for OTT services is forecast to grow more than twice as fast as filmed entertainment, which only rebounded to 85% of pre-pandemic levels. OTT providers combine day-and-date releases, binge drops, and mobile-first editing that shortens episodes yet boosts watch-through. Content boundaries blur as live sports and user-generated clips converge within single subscriptions, forcing broadcasters to accelerate digital pivots or risk share losses.
Filmed entertainment, music streaming, and video games remain meaningful but slower-growing pillars. China’s USD 7.2 billion 2024 box office underscores lingering cinema demand, though studios now shorten theatrical windows to 45 days, reducing exhibitors’ exclusivity. Music and audio platforms grew 7% annually on Spotify’s South Asia rollout and Tencent Music’s 580 million Chinese listeners. Video games and e-sports tallied USD 48 billion in 2024, with mobile commanding 68% share; 5G and cloud streaming will likely push this higher. Live events surpassed 2019 turnover by 2025, powered by blended in-person and virtual concerts that monetize beyond venue capacity.


By Platform: Smart-TV Ecosystems Race Ahead
Mobile retained 41.23% distribution share in 2025 as commuters in megacities consume short-form video, but smart-TVs and connected devices will post the briskest 6.21% CAGR through 2031. Manufacturers preload operating systems such as Samsung Tizen, LG webOS, and Xiaomi PatchWall, shifting power from cable operators to hardware-software stacks that harvest viewing data for targeted advertising. The Asia Pacific media and entertainment market share for cable and satellite slipped to 28% as Dish TV India lost 12% of actives and Australia’s Foxtel shed 180,000 customers. Cinema’s 9% slice recovered yet faces lower occupancy; exhibitors respond by rolling out IMAX and 4DX screens priced up to 100% above standard. Desktop streaming eroded to 18% as users prefer mobile apps offering offline downloads and personalized feeds.
Retail bundling changes the economics. Consumers now pay for an average of 2.8 subscriptions, spurring telecom-led packages that meld multiple platforms under one bill, a tactic Reliance Jio uses to lock in 18 million bundled customers. Licensing frameworks embedded in India’s Telecommunication Act 2023 and Singapore’s Broadcasting Act impose additional compliance layers that newcomers must navigate, adding both cost and defensive moat for incumbents.
By Revenue Stream: Subscription Momentum Builds
Advertising supplied 54.37% of 2025 turnover, powered by programmatic video whose CPMs run USD 2-4 compared with USD 8-12 on TV. Yet subscription is forecast to climb fastest at a 5.21% CAGR as platforms transition from land-grab to monetization. The Asia Pacific media and entertainment market size for subscription services expanded when Netflix lifted prices in Japan and South Korea by 10-15% without provoking churn, signaling latent pricing power in affluent segments.
Transactional pay-per-view occupies 12% of revenue, focused on premium sports and live concerts charging USD 15-30 per event. Licensing and merchandising supply 8% thanks to Japan’s USD 16.1 billion anime exports, half of which stem from overseas streaming sales. Hybrid monetization strategies Disney+ Hotstar’s dual ad and ad-free tiers at USD 2 and USD 10 maximize lifetime value while buffering cyclical ad dips.
Geography Analysis
China’s 44.81% share in 2025 originates from Tencent Video, iQIYI, and state-owned China Media Group, which together reach 1 billion viewers, but the nation’s 3.8% CAGR lags regional peers due to content quotas and strict gaming approvals. Domestic films captured 84% of 2024 box-office receipts as foreign releases maxed out the 34-title annual quota. Private players increasingly look offshore; Tencent’s 2024 international gaming sales rose 34% year-over-year to CNY 14.5 billion (USD 2 billion).
India’s 4.92% CAGR stems from Reliance-Disney’s 64 million-subscriber behemoth plus regional platforms such as Hoichoi, Aha, and SunNXT, which together added 22 million users in 2024. Telecom bundling, abundant youth demographics, and vernacular content catalyze growth unmatched by mature markets.
Japan and South Korea jointly supply 23% of revenue. Japan anchors global anime exports worth USD 16.1 billion, while South Korea’s CJ ENM sold 28 dramas abroad in 2024 for USD 680 million. Both nations post sub-3% growth amid high penetration but compensate through overseas licensing.
Southeast Asia delivers 12% share yet high velocity, highlighted by Indonesia’s Vidio at 48 million monthly actives and Thailand’s True Digital originals slate. Australia contributes 7%, with Nine Entertainment’s 9Now at 6.2 million MAU. Emerging markets such as the Philippines, Pakistan, and Bangladesh add 5% but expand subscribers 18% annually on falling data costs and surging smartphone uptake.
Competitive Landscape
The Asia Pacific media and entertainment market retains a moderate structure in which the five largest companies, Tencent Holdings, Sony Group, ByteDance, Walt Disney, and Netflix collectively controlled major share of regional revenue in 2025, leaving ample headroom for national broadcasters and speciality streamers to carve out defensible niches. Tencent deepened its ecosystem moat by piloting cloud-gaming services in Guangdong and Shanghai that stream console-quality titles to mid-range smartphones, a move that ties its gaming IP more tightly to its video and social platforms. Sony diversified beyond consoles by investing USD 300 million in India’s Nodwin Gaming and Mayhem Studios, positioning PlayStation Network to tap a 450 million-strong mobile-gamer base. ByteDance leveraged Douyin’s 750 million daily users and USD 270 billion live-commerce gross merchandise value to integrate entertainment, advertising, and payments in one funnel, compressing the customer journey and siphoning spend from traditional agencies.
Vertical integration has become the prevailing strategic pattern. Reliance Industries and Walt Disney closed an USD 8.5 billion joint venture in January 2025 that bundled 120-plus television networks, two streaming platforms, and India’s largest telecom pipe into a single demand-generation flywheel. Netflix followed a content-scale strategy, committing an additional USD 500 million to South Korean titles for 2025-2026 after Squid Game and The Glory delivered more than 2 billion global viewing hours. CJ ENM’s Studio Dragon signed a multiyear pact with Apple TV+ to co-produce six K-dramas, ensuring international distribution and raising per-series budgets to USD 12-18 million. These arrangements demonstrate how control over both production and distribution data increasingly defines bargaining power across the region.
Technology adoption distinguishes winners from followers. Platforms that deploy machine-learning recommendation engines, dynamic ad insertion, and edge-based content delivery have logged 20-30% higher average engagement and 15-20% lower churn than broadcasters tied to linear schedules. AI-driven dubbing services like Papercup and Deepdub cut localization expense by up to 70%, enabling simultaneous releases in 12-15 languages and accelerating payback periods. Volumetric-capture studios in Seoul and Tokyo transform concerts into immersive pay-per-view streams unconstrained by physical capacity, adding a fresh revenue leg for labels facing plateauing album sales. As a result, scale alone no longer guarantees advantage; sustained edge now rests on the speed at which companies absorb emerging technologies into customer-facing products.
Asia Pacific Media And Entertainment Industry Leaders
Tencent Holdings Ltd.
Sony Group Corporation
ByteDance Ltd.
The Walt Disney Company
Netflix Inc.
- *Disclaimer: Major Players sorted in no particular order


Recent Industry Developments
- August 2025: Paramount completed its USD 8 billion merger with Skydance Media, positioning the entity as a technology-centric studio.
- March 2025: Singapore’s Infocomm Media Development Authority issued mandatory watermarking rules for generative-AI content, setting a July 2025 compliance deadline.
- February 2025: Kakao Entertainment purchased a 40% stake in Kadokawa’s anime division for USD 180 million, expanding its webtoon-to-anime pipeline across Asia Pacific.
- January 2025: Reliance Industries and Walt Disney completed an USD 8.5 billion joint venture, creating India’s largest integrated media conglomerate with 64 million streaming subscribers.


Asia Pacific Media And Entertainment Market Report Scope
The Asia Pacific Media and Entertainment Market Report is Segmented by Content Type (Filmed Entertainment, Television, Music and Audio Streaming, Publishing, Video Games and e-Sports, OTT Video, Live and Experiential Entertainment), Platform (Cable and Satellite, Cinema Screens, Online/Desktop, Mobile, Smart-TV and Connected Devices), Revenue Stream (Advertising, Subscription, Pay-per-View/Transactional, Licensing and Merchandising, Box-Office and Ticketing), and Geography (China, India, Japan, South Korea, Australia, Indonesia, Thailand, Malaysia, Singapore, Vietnam, Rest of Asia Pacific). The Market Forecasts are Provided in Terms of Value (USD).
By Content Type
| Filmed Entertainment |
| Television |
| Music and Audio Streaming |
| Publishing (Books, Magazines, Newspapers) |
| Video Games and e-Sports |
| OTT Video |
| Live and Experiential Entertainment |
By Platform
| Cable and Satellite |
| Cinema Screens |
| Online/Desktop |
| Mobile |
| Smart-TV and Connected Devices |
By Revenue Stream
| Advertising |
| Subscription |
| Pay-per-View / Transactional |
| Licensing and Merchandising |
| Box-Office and Ticketing |
By Country
| China |
| India |
| Japan |
| South Korea |
| Australia |
| Indonesia |
| Thailand |
| Malaysia |
| Singapore |
| Vietnam |
| Rest of Asia Pacific |
| By Content Type | Filmed Entertainment |
| Television | |
| Music and Audio Streaming | |
| Publishing (Books, Magazines, Newspapers) | |
| Video Games and e-Sports | |
| OTT Video | |
| Live and Experiential Entertainment | |
| By Platform | Cable and Satellite |
| Cinema Screens | |
| Online/Desktop | |
| Mobile | |
| Smart-TV and Connected Devices | |
| By Revenue Stream | Advertising |
| Subscription | |
| Pay-per-View / Transactional | |
| Licensing and Merchandising | |
| Box-Office and Ticketing | |
| By Country | China |
| India | |
| Japan | |
| South Korea | |
| Australia | |
| Indonesia | |
| Thailand | |
| Malaysia | |
| Singapore | |
| Vietnam | |
| Rest of Asia Pacific |


Key Questions Answered in the Report
How large will Asia Pacific media and entertainment spending be by 2031?
Regional revenue is projected to reach USD 1.76 Trillion in 2031, reflecting a 4.24% CAGR from 2026.
Which country is expected to expand the fastest between 2026 and 2031?
India is forecast to grow at a 4.92% CAGR, outpacing all other Asia Pacific territories.
What content format is seeing the quickest growth?
OTT video is advancing at a 5.42% annual rate, steadily taking share from broadcast television.
Why are smart-TV and connected devices gaining traction so quickly?
Sub-USD 30 streaming sticks and pre-installed apps on Xiaomi, Samsung, and LG sets are driving a 6.21% CAGR for this platform group.
How are companies countering Asia Pacific’s high piracy levels?
Rights-holders now invest an extra 8-12% of distribution budgets in watermarking, forensic tracking, and automated takedowns to protect content.
What strategic move highlights the region’s push toward vertical integration?
Reliance Industries and Walt Disney’s USD 8.5 billion joint venture combined content production, streaming distribution, and telecom infrastructure into a single entity in January 2025.
Page last updated on:


