Asia Pacific Fungicide Market Size and Share
Market Overview
| Study Period | 2018 - 2031 |
|---|---|
| Forecast Data Period | 2026 - 2031 |
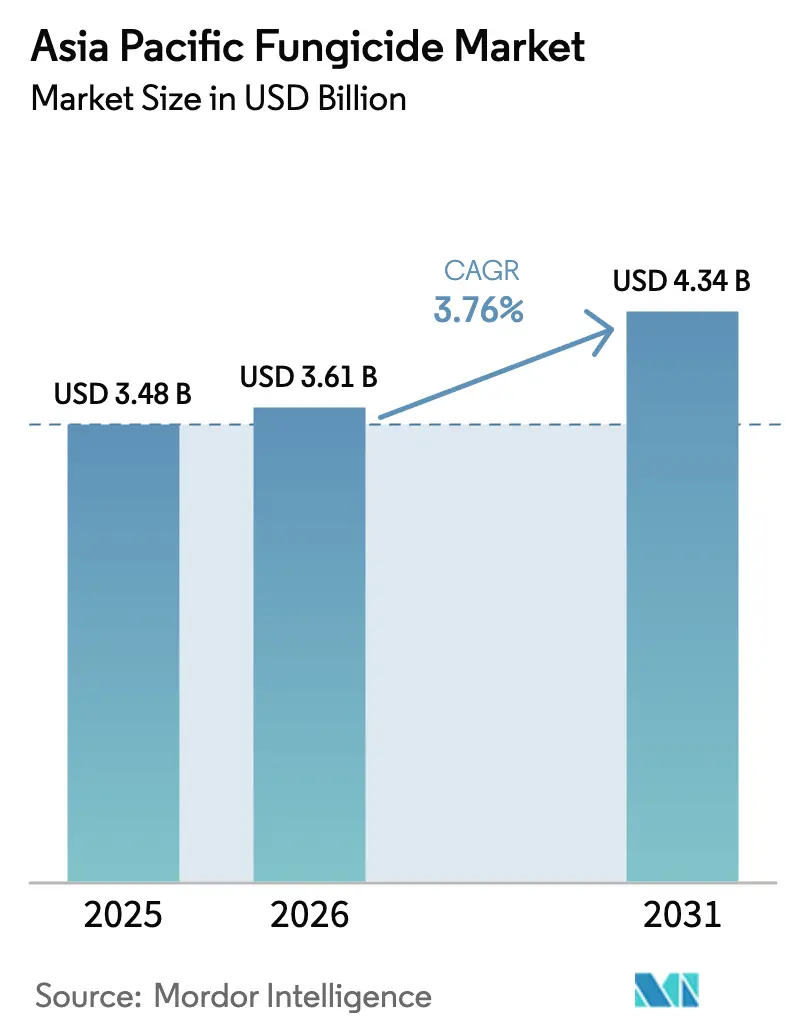
| Base Year Market Size (2025) | USD 3.48 Billion |
| Market Size (2026) | USD 3.61 Billion |
| Market Size (2031) | USD 4.34 Billion |
| Growth Rate (2026 - 2031) | 3.76% CAGR |
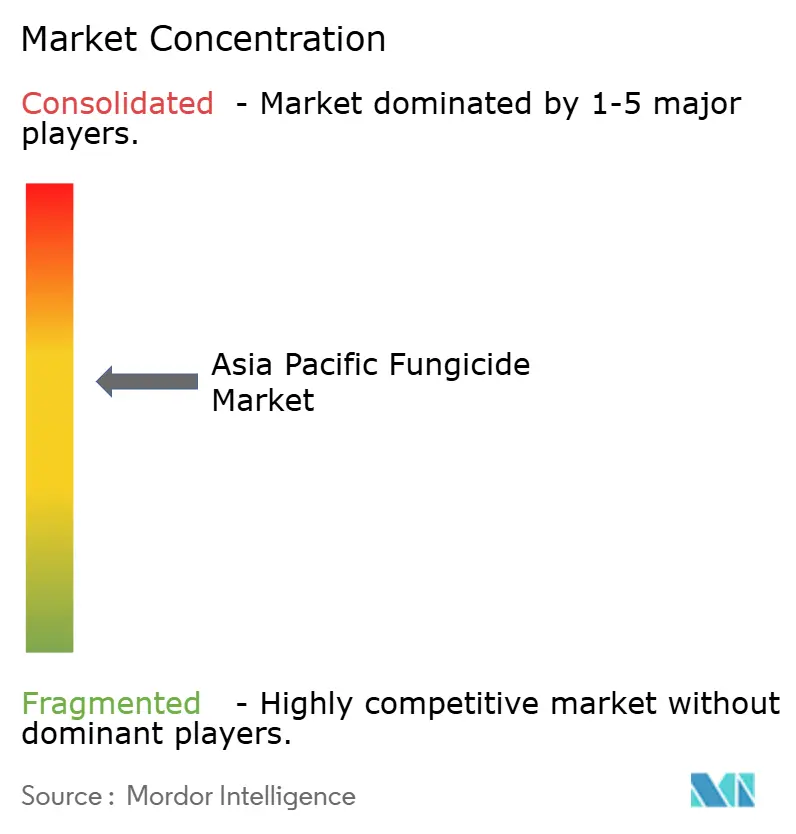
| Market Concentration | Medium |
Major Players *Disclaimer: Major Players sorted in no particular order Image © Mordor Intelligence. Reuse requires attribution under CC BY 4.0. | |
Asia Pacific Fungicide Market Analysis by Mordor Intelligence
The Asia Pacific Fungicide market size was valued at USD 3.48 billion in 2025 and estimated to grow from USD 3.61 billion in 2026 to reach USD 4.34 billion by 2031, at a CAGR of 3.76% during the forecast period (2026-2031). Sustained growth rests on climate-induced disease escalation, export residue compliance, and rapid deployment of precision spray technologies. Widespread adoption of unmanned aerial vehicles and electrostatic sprayers is improving coverage efficiency, which, in turn, is accelerating the replacement of high-volume commodity products with targeted premium formulations. Local SDHI manufacturing clusters in China and India supply low-cost active ingredients, helping smallholders upgrade to combinations once considered premium. Stricter maximum residue limits in Japan, Australia, and the European Union favor low-dose mixtures that meet international thresholds and reduce harvest-to-shipment intervals. Heightened resistance pressure in cereal pathogens also drives uptake of next-generation modes of action that preserve yields in an increasingly variable climate.
Key Report Takeaways
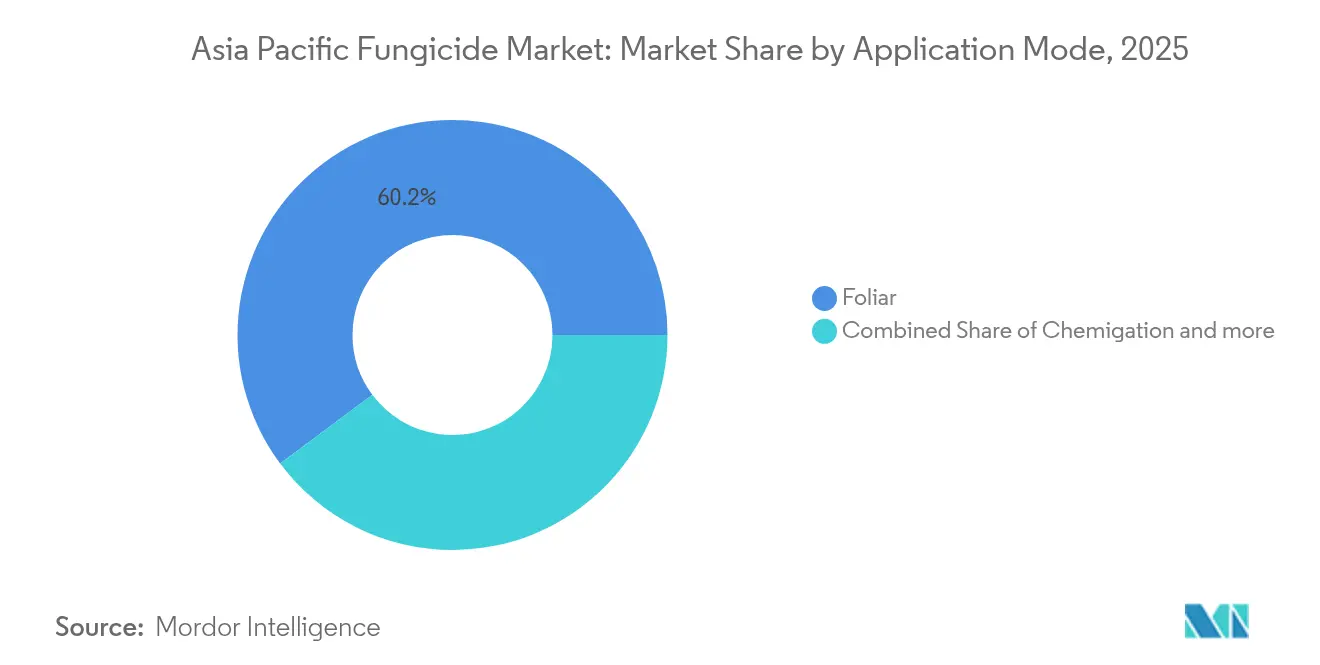
- By Application Mode, foliar treatments led with a 60.20% revenue share in 2025, and is forecast to post the fastest 3.82% CAGR to 2031.
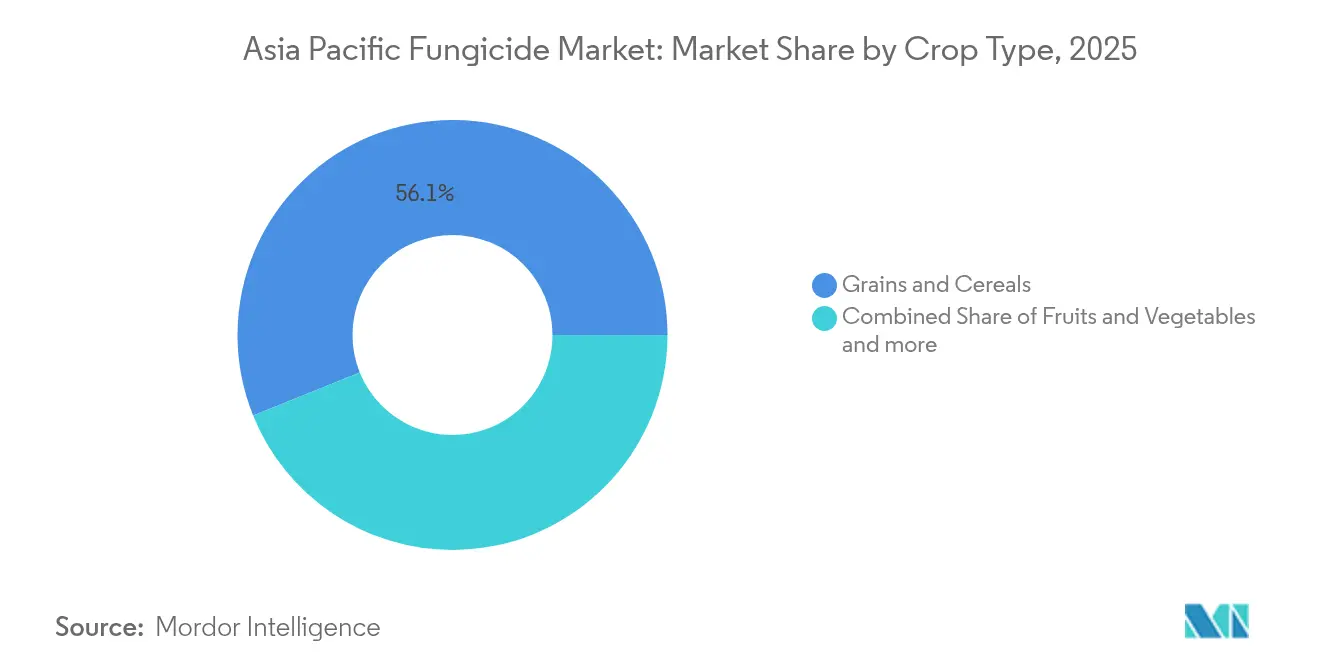
- By Crop Type, grains and cereals commanded 56.10% of the Asia Pacific Fungicide market share in 2025, while fruits and vegetables are advancing at a 3.95% CAGR through 2031.
- By Geography, China accounted for 38.10% of the Asia Pacific Fungicide market size in 2025, and Thailand is projected to be the fastest-growing country at a 4.55% CAGR to 2031.
Note: Market size and forecast figures in this report are generated using Mordor Intelligence’s proprietary estimation framework, updated with the latest available data and insights as of 2026.
Asia Pacific Fungicide Market Trends and Insights
Drivers Impact Analysis*
| Driver | (~) % Impact on CAGR Forecast | Geographic Relevance | Impact Timeline |
|---|---|---|---|
| Climate-driven surge in fungal outbreaks | +1.2% | Monsoon-affected areas across Asia Pacific | Medium term (2-4 years) |
| High-value fruit and vegetable acreage expansion | +0.9% | China, India, Thailand | Long term (≥4 years) |
| Wider adoption of foliar-spray technologies | +0.7% | Japan, South Korea, China | Short term (≤2 years) |
| Digital field-monitoring platforms | +0.6% | ASEAN region | Medium term (2-4 years) |
| Export residue-compliance pressures | +0.8% | China, Thailand, Vietnam | Medium term (2-4 years) |
| Local generic SDHI manufacturing cost advantage | +1.0% | China, India | Short term (≤2 years) |
| Source: Mordor Intelligence | |||


Climate-Driven Surge in Fungal Outbreaks
Erratic precipitation and steadily rising temperatures lengthen humid periods that favor spore germination, resulting in more frequent and severe outbreaks in key rice, wheat, and vegetable belts. The Intergovernmental Panel on Climate Change notes that monsoon variability in South and Southeast Asia increased by 23% since 2020, creating extended leaf-wetness intervals [1]Intergovernmental Panel on Climate Change, “Climate Change 2023: Synthesis Report,” ipcc.ch. Rice blast incidence across China, India, and Vietnam rose 31% over historical baselines, prompting growers to increase protective spray rounds from two or three to as many as five per season. Late blight pressure in highland potatoes now requires additional systemic applications to prevent tuber infection. These weather-driven challenges raise demand for multi-site protectants and SDHI mixtures that retain activity under variable conditions. Foliar programs see greater frequency, which boosts sales volumes even as formulation rates per hectare decline due to improved application precision. Policymakers highlight the need for climate-resilient chemistry in national food-security plans, adding institutional momentum to market expansion.
High-Value Fruit and Vegetable Acreage Expansion
China’s fruit area reached 13.8 million hectares in 2024, up 4.2% year on year, while vegetable production covered 24.6 million hectares [2]National Bureau of Statistics of China, “China Statistical Yearbook 2024 – Agriculture,” stats.gov.cn. India’s National Horticulture Mission allocated USD 1.8 billion to protected cultivation, targeting 2.1 million hectares of new greenhouse and net-house structures. Export-oriented horticulture imposes strict cosmetic standards and residue limits, encouraging pre-harvest programs based on SDHI and biological products with short re-entry and pre-harvest intervals. Growers in Thailand and Vietnam cite premium price realizations of 15-20% for produce certified under GLOBAL G.A.P., reinforcing willingness to spend more on compliant fungicides. Expansion of drip irrigation further enables chemigation-based disease control, although foliar remains dominant. Higher income per hectare in fruits and vegetables offsets the added cost of premium formulations, sustaining double-digit value growth even where treated acreage grows modestly.
Wider Adoption of Foliar-Spray Technologies
Agricultural drone registrations hit 178,000 units in China during 2024, a 67% jump over 2023. Electrostatic nozzles and variable-rate algorithms cut spray volumes by 30-40% while maintaining uniform coverage, which lowers per-hectare chemical expenditure but expands user adoption. Japan, South Korea, and Australia provide subsidies covering up to 40% of drone purchase costs, accelerating penetration among small and mid-sized farms. Precision placement allows growers to rely more heavily on systemic fungicides with translaminar movement, such as SDHI-QoI blends, that perform best when finely atomized. Spray automation also addresses labor shortages by reducing field time requirements. Manufacturers tailor packaging to smaller tank capacities common in drone applications, and some launch water-soluble granules that dissolve quickly in unmanned systems. Distributors report double-digit sales growth in products labeled “drone-ready,” signaling a durable shift in fungicide demand dynamics.
Digital Field-Monitoring Platforms Boosting Premium Formulations
Thailand’s Smart Farmer application served more than 280,000 users by late 2024, delivering micro-dose recommendations tied to weather data, canopy imagery, and disease models. Vietnam’s VietGAP platform reduced overall fungicide sprays by 22% while maintaining control levels, thereby illustrating cost savings that fund upgrades to higher-priced, longer-lasting chemistries. These systems usually prescribe SDHI or QoI combinations because their rainfastness and longer residuals fit predictive application windows. Governments see digital extension as a cost-effective method to spread integrated pest management; they invest in server capacity, farmer training, and mobile data subsidies. Multinationals integrate decision-support tools into loyalty programs, offering discounts for in-app purchases. Over time, algorithm-driven scheduling should reduce indiscriminate spraying and raise the market share of premium products adapted to tighter, knowledge-based timings.
Restraints Impact Analysis*
| Restraint | (~) % Impact on CAGR Forecast | Geographic Relevance | Impact Timeline |
|---|---|---|---|
| Stringent active-ingredient bans and lower MRLs | –0.8% | Japan, Australia, South Korea | Medium term (2-4 years) |
| Pathogen resistance to strobilurins in rice and wheat | –0.6% | China, India, Vietnam | Long term (≥4 years) |
| Farm-labor shortages delaying spray windows | –0.4% | Japan, South Korea, China | Short term (≤2 years) |
| Higher inland-waterway hazmat logistics premiums | –0.3% | China, selected ASEAN corridors | Medium term (2-4 years) |
| Source: Mordor Intelligence | |||
Stringent Active-Ingredient Bans and Lower MRLs
Australia’s regulator cancelled registrations for 18 fungicide actives in 2024, including several triazoles and benzimidazoles, citing environmental persistence. Japan reduced copper compound allowances in citrus by 50%, while South Korea restricted strobilurins in rice under resistance-management guidelines. Manufacturers must invest in reformulation or face market exit, incurring costly toxicology and field-trial programs. Growers need alternate products that often come at premium prices, raising production costs. Smaller distributors struggle to manage inventory of compliant alternatives, constraining availability in remote areas. Exporters risk detention if residues exceed tighter limits, so they pre-emptively phase out older chemistries, speeding market erosion. The cumulative effect reduces overall fungicide volumes, tempering Asia Pacific Fungicide market growth despite opportunities for new entrants.
Pathogen Resistance to Strobilurins in Rice and Wheat
Monitoring data from China’s Yangtze River valley records 73% azoxystrobin resistance in rice blast isolates, and India’s Punjab shows similar frequencies in wheat stripe rust. Farmers relying on affordable strobilurin generics now face yield penalties when treatments fail. Transitioning to SDHI or triazole alternation schemes adds 35–50% to per-hectare protection costs. Extension services promote integrated resistance management, but adoption lags among resource-constrained smallholders. Some growers resort to higher dose rates, accelerating resistance cycles. The loss of a trusted chemistry class forces complex tank mixes, raising application errors. Aggregated, these challenges slow replacement cycles and restrain value growth because price-elastic segments reduce treated acreage rather than pay for premium solutions.
*Our forecasts treat driver/restraint impacts as directional, not additive. The impact forecasts reflect baseline growth, mix effects, and variable interactions.
Segment Analysis
By Application Mode: Foliar Applications Sustain Leadership
Foliar spraying commanded 60.20% of revenue in 2025 and is projected to grow at a 3.82% CAGR to 2031, underpinned by continuous upgrades in nozzle design, electrostatic charge modulation, and drone deployment that ensure targeted deposition while limiting drift. Seed treatment, though smaller, is projected to grow at a significant growth rate because SDHI-based coatings protect seedlings during critical establishment phases while reducing field-spray frequency. Chemigation application is particularly useful in greenhouse vegetables, where closed-loop fertigation combines irrigation and protection for labor savings. Soil treatments and fumigants remain niche, but adoption holds steady in high-value orchard blocks dealing with soil-borne pathogens.
The regulatory shift toward drift-reduction zones near water bodies pushes growers to invest in precision application hardware, an evolution that aligns with value migration toward premium formulations. Manufacturers focus R&D on water-dispersible granules compatible with drone tanks and electrostatic sprayers. Subsidy programs in Japan and South Korea that reimburse part of drone acquisition costs further entrench foliar dominance while enhancing efficiency. Accordingly, Asia Pacific Fungicide market share within application modes tilts steadily toward high-coverage, low-volume technologies that integrate seamlessly with data-driven advisory platforms.


By Crop Type: Cereals Remain the Anchor While Horticulture Accelerates
Grains and cereals accounted for 56.10% of usage in 2025, representing a segment value of USD 1.95 billion in the Asia-Pacific fungicide market. Rice, wheat, and corn rely on multi-site protectants and systemic combinations to manage blast, rust, and blight under monsoon volatility. Fruits and vegetables, though smaller, are expanding at a 3.95% CAGR as export-oriented growers demand spotless produce with residue profiles acceptable to high-income importers. Enhanced greenhouse penetration in China and India amplifies disease pressure, requiring prophylactic schedule adherence that naturally favors premium, low-dose mixtures.
Pulses and oilseeds, led by chickpea, soybean, and peanut acreage, are vulnerable to rust and root rot. Commercial crops such as cotton, sugarcane, and tea contribute a significant share, with region-specific peaks such as sugarcane in Thailand and tea in India’s northeast. Turf and ornamentals remain a niche but show steady urban-driven growth thanks to golf course and landscaping investments across ASEAN capitals. Overall, shifting dietary preferences toward fruit and vegetable consumption, combined with higher export returns, accelerate value migration even though cereal acreages remain the bedrock of volume demand.
Geography Analysis
China held 38.10% of the Asia Pacific Fungicide market revenue in 2025, reflecting the world’s largest crop area and integrated domestic supply chains that manufacture most active ingredients locally. Adoption of precision spraying and digital extension platforms enables premium product uptake. India followed, supported by integrated pest-management funding of USD 1.2 billion in 2024 that emphasizes biological alternatives and resistance stewardship. Thailand, although a smaller market, is the fastest-growing at 4.55% CAGR through 2031, driven by mobile-based advisory services and fruit export gains.
Japan and Australia together captured a significant share due to intensive farming systems and strict regulatory oversight favoring high-value fungicides with strong environmental profiles. Vietnam, Indonesia, and the Philippines, buoyed by palm oil, rice, and tropical fruit expansion. Myanmar and Pakistan remain emerging opportunities where modernization of chemical use is in its infancy. Regulatory heterogeneity shapes product mix across countries; stricter residue regimes in developed markets incentivize SDHI and biological adoption, whereas cost sensitivity in emerging economies supports generic multi-site fungicides. Nevertheless, across all geographies, climate variability and digitization foster convergence toward targeted, low-dose strategies that raise value per treated hectare.
Competitive Landscape
The Asia Pacific Fungicide market exhibits moderate concentration, with the top five players, such as Syngenta, UPL, BASF, Bayer, and Corteva, controlling the majority of the revenue. These companies maintain diverse portfolios covering SDHI, QoI, triazole, and biological classes, backed by robust R&D and regulatory expertise. Chinese producers such as Limin Group, Zhejiang Xinan, and Zhejiang Hisun aggressively expand share through cost-competitive generics, especially in cereal segments. Strategic alliances between multinationals and local firms are increasing; examples include FMC’s co-development pact with Jiangsu Yangnong in August 2024 to pair proprietary actives with low-cost manufacturing.
Recent investments accent strategic priorities: Syngenta’s USD 280 million expansion in Nantong will add SDHI and biological capacity by 2026, while Corteva’s USD 120 million R&D center in Hyderabad focuses on tropical disease solutions. Digital platforms such as Bayer’s FarmRise and BASF’s xarvio integrate weather, imagery, and resistance data to cement customer loyalty. Biologicals stand out as a growth frontier; UPL’s acquisition of Zhejiang Yongnong brings microbial technologies into its APAC portfolio. Localized production capabilities coupled with digital advisory services form the core competitive battleground for the next five years.
Asia Pacific Fungicide Industry Leaders
BASF SE
Bayer AG
Syngenta Group
UPL Limited
Corteva Agriscience
- *Disclaimer: Major Players sorted in no particular order

Recent Industry Developments
- September 2025: Corteva Agriscience announced the launch of Zorvec Entecta in India, targeting the grape and potato segments. The product combines two active ingredients (amisulbrom + oxathiapiprolin) with dual modes of action (FRAC groups 21 and 49) to manage resistance and protect against key oomycete diseases such as downy mildew in grapes and late blight in potatoes.
- June 2024: Syngenta Group laid the foundation for a new production base in the Nantong Economic & Technological Development Zone (Jiangsu, China), with a total investment of USD 112 million. The facility is scheduled to commence operations in 2026 and will manufacture high-value plant protection products, including advanced fungicide formulations.
- June 2024: BASF launched its new rice fungicide Cevya (400 g/L mefentrifluconazole) in China via its Agricultural Solutions division. This product is notable as the first new isopropanol-triazole fungicide registered for rice in China in nearly 20 years, offering growers a fresh tool to combat disease resistance in rice production.


Asia Pacific Fungicide Market Report Scope
The Asia Pacific Fungicide Market Report is Segmented by Application Mode (Chemigation, Foliar, Fumigation, Soil Treatment, and Seed Treatment), by Crop Type (Commercial Crops, Fruits and Vegetables, Grains and Cereals, and More), and by Geography (Australia, China, India, Indonesia, Japan, Myanmar, Pakistan, Philippines, and More). The Report Offers the Market Size and Forecasts in Terms of Value (USD) and Volume (Metric Tons).
| Chemigation |
| Foliar |
| Fumigation |
| Seed Treatment |
| Soil Treatment |
| Commercial Crops |
| Fruits and Vegetables |
| Grains and Cereals |
| Pulses and Oilseeds |
| Turf and Ornamental |
| Australia |
| China |
| India |
| Indonesia |
| Japan |
| Myanmar |
| Pakistan |
| Philippines |
| Thailand |
| Vietnam |
| Rest of Asia-Pacific |
| Application Mode | Chemigation |
| Foliar | |
| Fumigation | |
| Seed Treatment | |
| Soil Treatment | |
| Crop Type | Commercial Crops |
| Fruits and Vegetables | |
| Grains and Cereals | |
| Pulses and Oilseeds | |
| Turf and Ornamental | |
| Country | Australia |
| China | |
| India | |
| Indonesia | |
| Japan | |
| Myanmar | |
| Pakistan | |
| Philippines | |
| Thailand | |
| Vietnam | |
| Rest of Asia-Pacific |


Market Definition
- Function - Fungicides are chemicals used to control or prevent fungi from damaging the crop and prevent yield loss.
- Application Mode - Foliar, Seed Treatment, Soil Treatment, Chemigation, and Fumigation are the different type of application modes through which crop protection chemicals are applied to the crops.
- Crop Type - This represents the consumption of crop protection chemicals by Cereals, Pulses, Oilseeds, Fruits, Vegetables, Turf, and Ornamental crops.
| Keyword | Definition |
|---|---|
| IWM | Integrated weed management (IWM) is an approach to incorporate multiple weed control techniques throughout the growing season to give producers the best opportunity to control problematic weeds. |
| Host | Hosts are the plants that form relationships with beneficial microorganisms and help them colonize. |
| Pathogen | A disease-causing organism. |
| Herbigation | Herbigation is an effective method of applying herbicides through irrigation systems. |
| Maximum residue levels (MRL) | Maximum Residue Limit (MRL) is the maximum allowed limit of pesticide residue in food or feed obtained from plants and animals. |
| IoT | The Internet of Things (IoT) is a network of interconnected devices that connect and exchange data with other IoT devices and the cloud. |
| Herbicide-tolerant varieties (HTVs) | Herbicide-tolerant varieties are plant species that have been genetically engineered to be resistant to herbicides used on crops. |
| Chemigation | Chemigation is a method of applying pesticides to crops through an irrigation system. |
| Crop Protection | Crop protection is a method of protecting crop yields from different pests, including insects, weeds, plant diseases, and others that cause damage to agricultural crops. |
| Seed Treatment | Seed treatment helps to disinfect seeds or seedlings from seed-borne or soil-borne pests. Crop protection chemicals, such as fungicides, insecticides, or nematicides, are commonly used for seed treatment. |
| Fumigation | Fumigation is the application of crop protection chemicals in gaseous form to control pests. |
| Bait | A bait is a food or other material used to lure a pest and kill it through various methods, including poisoning. |
| Contact Fungicide | Contact pesticides prevent crop contamination and combat fungal pathogens. They act on pests (fungi) only when they come in contact with the pests. |
| Systemic Fungicide | A systemic fungicide is a compound taken up by a plant and then translocated within the plant, thus protecting the plant from attack by pathogens. |
| Mass Drug Administration (MDA) | Mass drug administration is the strategy to control or eliminate many neglected tropical diseases. |
| Mollusks | Mollusks are pests that feed on crops, causing crop damage and yield loss. Mollusks include octopi, squid, snails, and slugs. |
| Pre-emergence Herbicide | Preemergence herbicides are a form of chemical weed control that prevents germinated weed seedlings from becoming established. |
| Post-emergence Herbicide | Postemergence herbicides are applied to the agricultural field to control weeds after emergence (germination) of seeds or seedlings. |
| Active Ingredients | Active ingredients are the chemicals in pesticide products that kill, control, or repel pests. |
| United States Department of Agriculture (USDA) | The Department of Agriculture provides leadership on food, agriculture, natural resources, and related issues. |
| Weed Science Society of America (WSSA) | The WSSA, a non-profit professional society, promotes research, education, and extension outreach activities related to weeds. |
| Suspension concentrate | Suspension concentrate (SC) is one of the formulations of crop protection chemicals with solid active ingredients dispersed in water. |
| Wettable powder | A wettable powder (WP) is a powder formulation that forms a suspension when mixed with water prior to spraying. |
| Emulsifiable concentrate | Emulsifiable concentrate (EC) is a concentrated liquid formulation of pesticide that needs to be diluted with water to create a spray solution. |
| Plant-parasitic nematodes | Parasitic Nematodes feed on the roots of crops, causing damage to the roots. These damages allow for easy plant infestation by soil-borne pathogens, which results in crop or yield loss. |
| Australian Weeds Strategy (AWS) | The Australian Weeds Strategy, owned by the Environment and Invasives Committee, provides national guidance on weed management. |
| Weed Science Society of Japan (WSSJ) | WSSJ aims to contribute to the prevention of weed damage and the utilization of weed value by providing the chance for research presentation and information exchange. |


Research Methodology
Mordor Intelligence follows a four-step methodology in all our reports.
- Step-1: Identify Key Variables: In order to build a robust forecasting methodology, the variables and factors identified in Step-1 are tested against available historical market numbers. Through an iterative process, the variables required for market forecast are set and the model is built on the basis of these variables.
- Step-2: Build a Market Model: Market-size estimations for the forecast years are in nominal terms. Inflation is not a part of the pricing, and the average selling price (ASP) is kept constant throughout the forecast period.
- Step-3: Validate and Finalize: In this important step, all market numbers, variables and analyst calls are validated through an extensive network of primary research experts from the market studied. The respondents are selected across levels and functions to generate a holistic picture of the market studied.
- Step-4: Research Outputs: Syndicated Reports, Custom Consulting Assignments, Databases & Subscription Platforms


