US Fungicide Market Size and Share
Market Overview
| Study Period | 2018 - 2031 |
|---|---|
| Forecast Data Period | 2026 - 2031 |
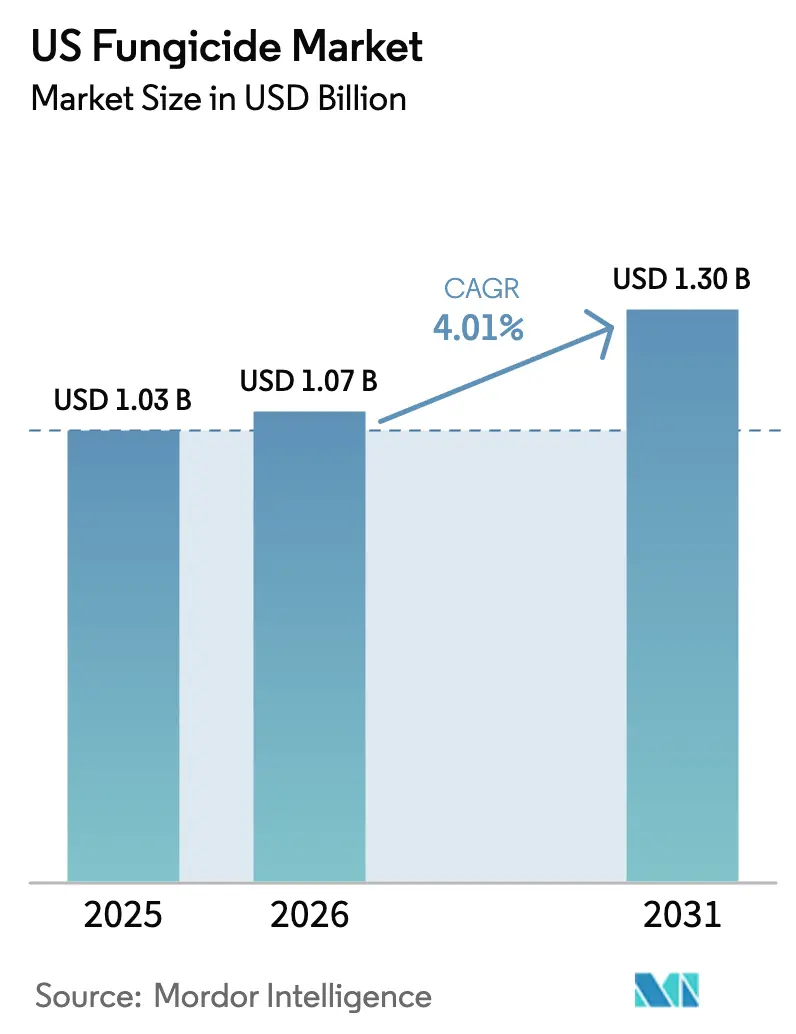
| Base Year Market Size (2025) | USD 1.03 Billion |
| Market Size (2026) | USD 1.07 Billion |
| Market Size (2031) | USD 1.3 Billion |
| Growth Rate (2026 - 2031) | 4.01% CAGR |
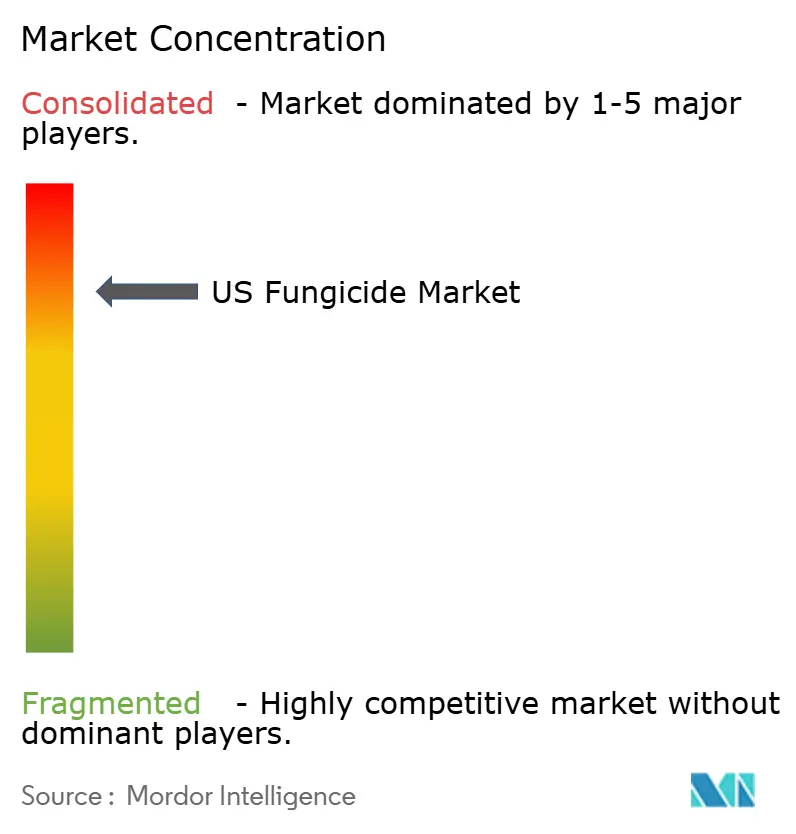
| Market Concentration | High |
Major Players *Disclaimer: Major Players sorted in no particular order Image © Mordor Intelligence. Reuse requires attribution under CC BY 4.0. | |
US Fungicide Market Analysis by Mordor Intelligence
The US fungicide market size is expected to grow from USD 1.03 billion in 2025 to USD 1.07 billion in 2026 and is forecast to reach USD 1.30 billion by 2031 at 4.01% CAGR over 2026-2031. Growth is propelled by intensified corn and soybean acreage, rapid diffusion of SDHI–azole premixes, and precision application technologies that improve return on investment for growers. Higher regulatory scrutiny around residues and runoff is steering demand toward reduced-risk biological formulations, while private-label programs from large retailers are exerting price pressure on branded synthetic products. Venture capital flows into biofungicide start-ups signal confidence in hybrid disease-control solutions, and carbon-credit incentives for no-till practices are encouraging targeted fungicide use. Together, these forces are shaping a market that balances agronomic efficacy, environmental compliance, and cost discipline in equal measure.
Key Report Takeaways
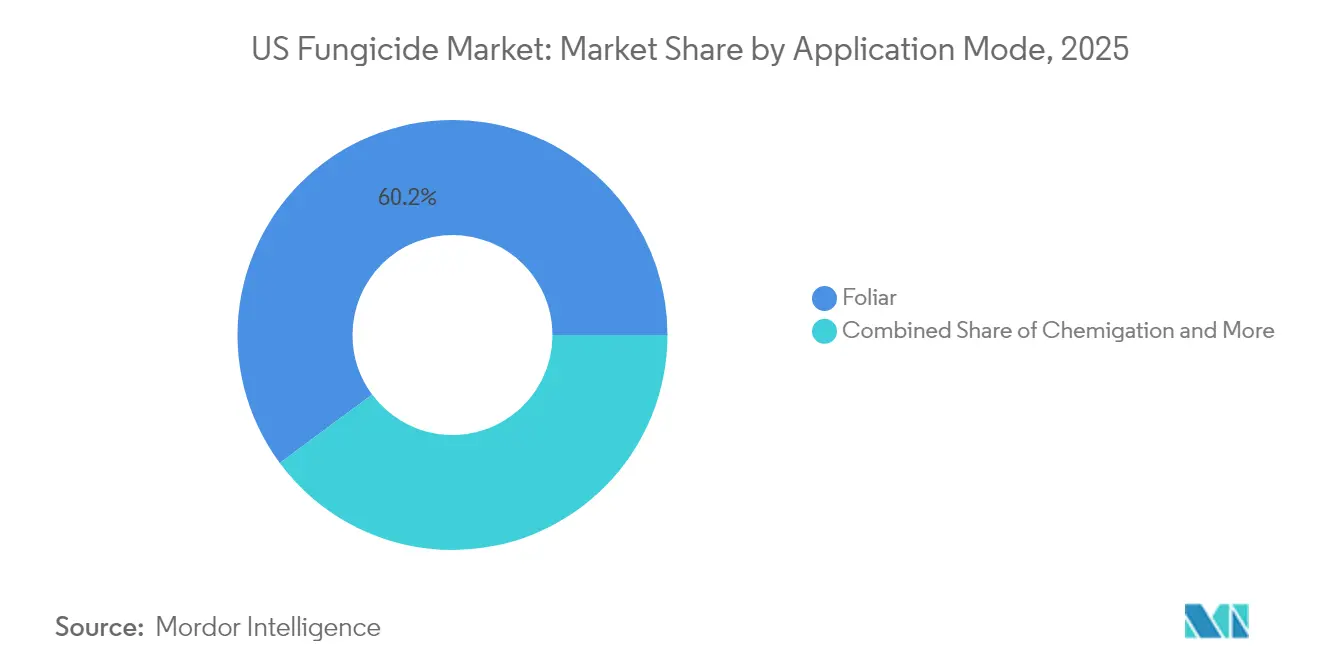
- By application mode, foliar applications led with 60.15% of the US fungicide market share in 2025 and are advancing at a 4.28% CAGR through 2031.
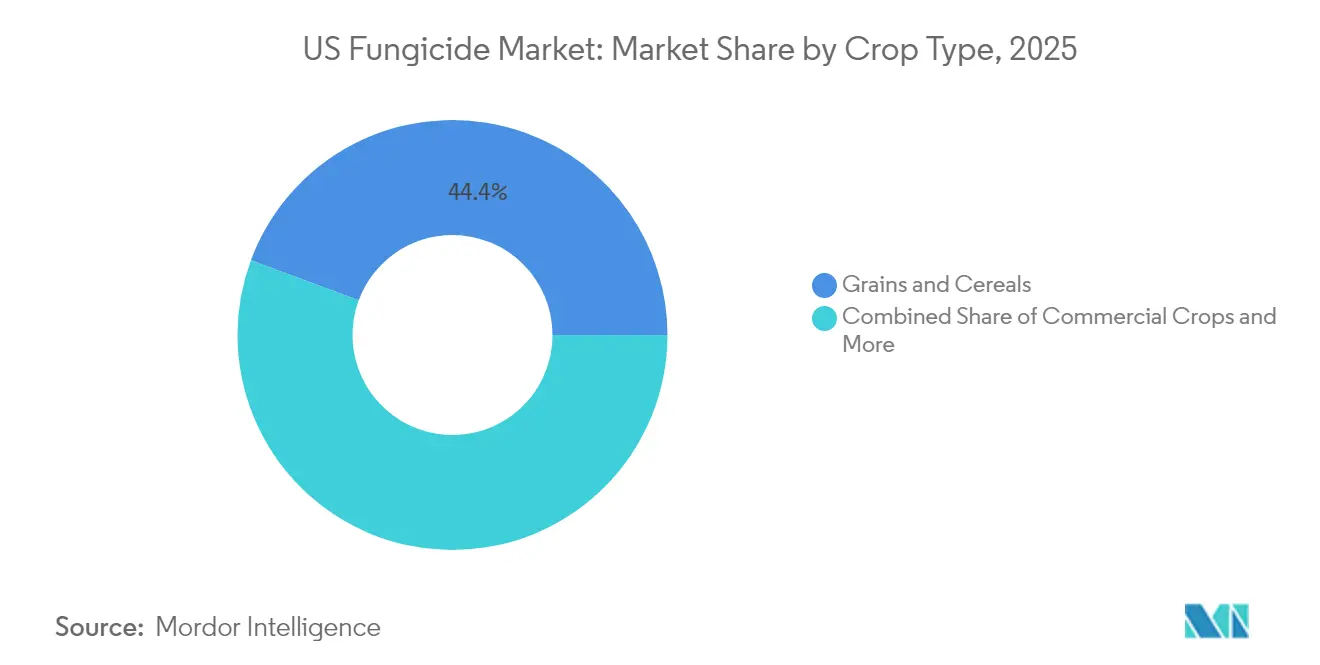
- By crop type, grains and cereals accounted for a 44.35% share of the US fungicide market size in 2025 and are projected to expand at a 4.31% CAGR through 2031
Note: Market size and forecast figures in this report are generated using Mordor Intelligence’s proprietary estimation framework, updated with the latest available data and insights as of 2026.
US Fungicide Market Trends and Insights
Drivers Impact Analysis*
| DRIVER | (~) % IMPACT ON CAGR FORECAST | GEOGRAPHIC RELEVANCE | IMPACT TIMELINE |
|---|---|---|---|
| Mainstream surge in soybean and corn acreage treated with SDHI–azole premixes | +1.2% | Midwest core expanding to Eastern Corn Belt | Medium term (2-4 years) |
| Rising incidence of QoI-resistant pathogens in specialty crops | +0.8% | California Central Valley, Florida citrus belt, Pacific Northwest | Long term (≥ 4 years) |
| Accelerated EPA approval cycle for reduced-risk biopesticides | +0.6% | National, with early adoption in CA, NY, FL high-value crop regions | Short term (≤ 2 years) |
| Surge in private-label fungicide programs by large ag-retail chains | +0.5% | National, concentrated in the Midwest and Great Plains distribution networks | Medium term (2-4 years) |
| Carbon-credit incentives for no-till plus targeted fungicide usage | +0.4% | Midwest and Great Plains, pilot programs in Iowa, Illinois, and Nebraska | Long term (≥ 4 years) |
| Venture-capital–backed indoor farming is creating new high-frequency spray windows | +0.3% | Urban corridors, controlled environment agriculture clusters | Long term (≥ 4 years) |
| Source: Mordor Intelligence | |||
Mainstream surge in soybean and corn acreage treated with SDHI-azole premixes
Adoption of SDHI–azole combination fungicides has transformed disease-management programs across the Corn Belt. Corteva’s Adastrio and FMC’s Forcivo collectively covered more than 15 million acres in 2024, offering improved control of tar spot in corn and frogeye leaf spot in soybeans[1]Source: Penn State Extension, “Updated 2025 Fungicide Efficacy Tables,” extension.psu.edu. Growers are willing to pay premium prices because these returns offset tight margin pressures. Retailers report a shift from single-mode to multiple-mode products as resistance concerns rise, and aerial applicators have retooled fleets to handle higher-volume premix demand. The trend is anticipated to sustain momentum as more EPA registrations for combination products enter the market.
Rising incidence of QoI-resistant pathogens in specialty crops
Field surveys confirm QoI resistance exceeding 80% in powdery mildew populations affecting California grapes, while similar resistance levels have emerged in Florida citrus pathogens[2]Source: California Department of Pesticide Regulation, “Pesticide Use Annual Report 2022 Data Summary,” cdpr.ca.gov. Growers are moving toward rotational programs that blend multi-site fungicides such as mancozeb with DMI and SDHI chemistry. The switch raises cost per acre yet preserves marketable yield in high-value crops. Extension services recommend shortened spray intervals and diversified chemistry, and distributors now bundle resistance-management training with product sales. Demand for premixes and tank-mix adjuvants is growing in tandem, and manufacturers are fast-tracking novel AI combinations that can overcome QoI resistance without triggering new regulatory hurdles.
Accelerated EPA approval cycle for reduced-risk biopesticides
EPA’s streamlined pathway has cut registration time from 36 to 18 months for qualifying products. AgroSpheres received a federal label for a thyme-oil biofungicide after venture funding, and Micropep Technologies closed funds to advance peptide-based formulations. Speedier approvals are lowering barriers to entry, inspiring joint development deals between chemical majors and start-ups[3]Source: Environmental Protection Agency, “Registration for Reduced-Risk Pesticides,” epa.gov. Distributors observe rising interest from fruit and vegetable growers eager to comply with residue-free retail programs. The shift is anticipated to redirect R&D budgets toward hybrid biological-synthetic solutions that can satisfy both efficacy and sustainability criteria.
Surge in private-label fungicide programs by large ag-retail chains
Nationwide retail platforms such as FBN Direct report price spreads between branded and generic fungicides. Helena Agri-Enterprises and Nutrien are rolling out proprietary blends that match performance benchmarks of older branded formulations. Growers, faced with elevated input costs, are opting for these lower-priced alternatives, and retailers leverage data platforms to highlight savings alongside agronomic fit. Branded suppliers respond by bundling stewardship tools and digital monitoring services, yet the margin compression persists. The phenomenon is anticipated to keep average selling prices in check even as product innovations continue.
Restraints Impact Analysis*
| Restraint | (~) % Impact on CAGR Forecast | Geographic Relevance | Impact Timeline |
|---|---|---|---|
| Stricter re-entry interval rules for aerial applicators | -0.7% | National, especially large corn and soybean farms | Short term (≤ 2 years) |
| Growing consumer push-back on synthetic residues in fresh produce | -0.5% | California specialty crops, Florida vegetables, Northeast fresh markets | Medium term (2-4 years) |
| Localized copper-runoff limits in Chesapeake Bay watershed | -0.3% | Maryland, Virginia, Pennsylvania agricultural watersheds | Medium term (2-4 years) |
| Rising insurance premiums for drift incidents near hemp farms | -0.2% | States with legal hemp production | Short term (≤ 2 years) |
| Source: Mordor Intelligence | |||
Stricter re-entry interval rules for aerial applicators
EPA’s 2024 worker-protection update extended re-entry intervals from 12 to 24-48 hours for several fungicide classes. This revision complicates scheduling during the critical VT–R3 growth stages in corn. Applicators face higher labor costs because longer intervals reduce daily capacity. Growers report occasional yield losses when windows close before disease-pressure peaks. Technology providers are responding with GPS-verified spray logs that help document compliance and reduce liability, yet initial adoption costs dampen short-term demand. Insurance carriers have lifted premiums by up to 25%, further raising operating expenses.
Growing consumer push-back on synthetic residues in fresh produce
USDA’s Pesticide Data Program detected fungicide residues in fresh produce samples in 2023, sparking heightened media attention. Retail chains serving premium markets now request residue-free certifications that exceed federal tolerances. Specialty crop growers in California and Florida are lengthening pre-harvest intervals or shifting toward biofungicides to maintain shelf-space access. The transition introduces yield risk, especially under high disease pressure. Industry associations are funding outreach campaigns to contextualize residue data, yet consumer perception remains a powerful demand constraint for several high-visibility synthetic actives.
*Our forecasts treat driver/restraint impacts as directional, not additive. The impact forecasts reflect baseline growth, mix effects, and variable interactions.
Segment Analysis
By Application Mode: Foliar applications sustain leadership through precision timing
Foliar programs captured 60.15% of the US fungicide market share in 2025 and are projected to grow at 4.28% through 2031, reflecting widespread use on corn, soybean, and specialty crops. The segment benefits from GPS-enabled boom control and drone-assisted scouting that shorten detection-to-treatment cycles. Growers value the flexibility to coincide sprays with disease alerts, and suppliers continue to launch three-way premixes that streamline multiple modes of action. Higher oilseed and pulse acreage in Northern states further widens the foliar footprint as farmers confront white mold and anthracnose. The US fungicide market shows incremental gains from chemigation integration, yet foliar will remain dominant because of its adaptability across crop phenology.
Seed-treatment demand is rising fastest on a percentage basis, supported by EPA approvals of multi-pathogen mixtures such as Syngenta’s Victrato. Although volume per acre is modest, nearly every corn and soybean seed unit now carries a fungicide component, boosting cumulative sales. Soil-treatment and fumigation programs hold niche positions in high-value fruit and vegetable systems, constrained by stricter buffer requirements and label restrictions. Chemigation adoption is strongest in irrigated pivots across Nebraska and Kansas, where variable-rate application aligns with water conservation objectives. In the future, synergy between predictive analytics and on-demand foliar spraying is likely to solidify foliar’s position while enabling complementary modes.


By Crop Type: Grains and cereals anchor volume while specialty crops drive value
Grains and cereals accounted for 44.35% of fungicide volume in 2025 and are advancing at a 4.31% CAGR, anchored by expansive corn acreage in the Midwest. The US fungicide market size associated with corn alone exceeded in 2024, and further gains are anticipated as more farmers adopt two-pass programs. Wheat adoption is rising in the Great Plains, where SDHI-based premixes protect yield and quality under stripe rust pressure. Soybean demand accelerates in Northern states confronting sudden death syndrome.
Fruits and vegetables deliver the highest per-acre spend, often surpassing grapes and almonds, even though their acreage share is smaller. Copper, mancozeb, and biologicals rotate in intensive schedules to satisfy residue-free retail contracts. Pulses and oilseeds broaden market exposure beyond the Corn Belt, with white mold risk pushing early adoption of peptide and microbial fungicides. Turf and ornamental markets, serving golf courses and landscape contractors, maintain steady demand despite regulatory scrutiny of broad-spectrum chemistries. Over the forecast horizon, value growth will hinge on specialty crop intensification, whereas volume growth will trail acreage changes in commodity grains.
Geography Analysis
The Midwest remains the epicenter of fungicide consumption, owing to dense corn and soybean plantings across Illinois, Iowa, Indiana, and Nebraska. Disease incidence of tar spot has climbed steadily, encouraging dual-mode sprays that raised revenue per acre. State cost-share programs that subsidize aerial scouting further bolstered adoption. The US fungicide market has also expanded in Minnesota and Wisconsin as Northern soybean growers confront white mold outbreaks.
California represents the highest-value region because wine grapes, almonds, and strawberries demand frequent applications of premium formulations. Specialty growers applied pounds of sulfur in 2022, alongside rising volumes of biofungicides that align with retailer residue limits. Water scarcity pressures are driving chemigation installations that favor reduced-rate liquid sulfur and potassium bicarbonate products. Regulatory incentives for reduced-risk labels accelerate biological uptake, making California the test bed for next-generation hybrids.
The Southeast, led by Florida citrus and vegetable acreage, stands as a consistent volume consumer despite weather-driven application disruptions. Citrus greening pressures heighten reliance on copper and DMI rotation, although runoff restrictions push growers toward lower-load synthetic alternatives. Georgia and South Carolina vegetable farms increasingly adopt greenhouse propagation that requires seedling fungicide dips before transplanting.
Competitive Landscape
The US fungicide market is concentrated, with the top multinational companies BASF SE, Bayer AG, Syngenta Group, UPL Limited, and Corteva Agriscience commanding a significant share through extensive portfolios and entrenched distribution channels. They invest heavily in SDHI and DMI innovation while supporting digital platforms that optimize spray timing and dosage. Portfolio management strategies include reformulating legacy actives into three-way blends and pairing chemical offers with satellite-based disease-forecast tools.
Private-label players intensify competition by offering price-advantaged generics backed by robust university data. Helena Agri-Enterprises and Nutrien leverage nationwide retail footprints and custom-blending capabilities to match branded performance at lower cost. FBN Direct amplifies transparency on price spreads, accelerating brand substitution among cost-conscious growers. The trend erodes average selling prices yet broadens product access, especially for smaller operations.
Biological innovators draw increasing venture funding as reduced-risk regulations favor their pipelines. AgroSpheres secured an amount to commercialize thyme-oil formulations, while Micropep Technologies amassed an amount to scale peptide-based fungicides. Strategic collaborations between chemical majors and start-ups diversify portfolios and mitigate regulatory risk. Syngenta’s acquisition of microbial assets and BASF’s investment in AgroSpheres illustrate a convergence toward integrated pest-management platforms that bundle synthetic precision and biological sustainability.
US Fungicide Industry Leaders
BASF SE
Bayer AG
Corteva Agriscience
Syngenta Group
UPL Limited
- *Disclaimer: Major Players sorted in no particular order

Recent Industry Developments
- September 2024: AgroSpheres received EPA registration approval for thyme oil-based biofungicide following venture capital investment from BASF Venture Capital and other institutional investors, targeting organic and reduced-risk market segments.
- July 2024: Micropep Technologies completed USD 29 million Series B funding round led by Sofinnova Partners to advance peptide-based biofungicide development targeting specialty crop markets, with commercial launch planned for 2026 growing season.


US Fungicide Market Report Scope
Chemigation, Foliar, Fumigation, Seed Treatment, Soil Treatment are covered as segments by Application Mode. Commercial Crops, Fruits & Vegetables, Grains & Cereals, Pulses & Oilseeds, Turf & Ornamental are covered as segments by Crop Type.| Chemigation |
| Foliar |
| Fumigation |
| Seed Treatment |
| Soil Treatment |
| Commercial Crops |
| Fruits and Vegetables |
| Grains and Cereals |
| Pulses and Oilseeds |
| Turf and Ornamental |
| Application Mode | Chemigation |
| Foliar | |
| Fumigation | |
| Seed Treatment | |
| Soil Treatment | |
| Crop Type | Commercial Crops |
| Fruits and Vegetables | |
| Grains and Cereals | |
| Pulses and Oilseeds | |
| Turf and Ornamental |


Market Definition
- Function - Fungicides are chemicals used to control or prevent fungi from damaging the crop and prevent yield loss.
- Application Mode - Foliar, Seed Treatment, Soil Treatment, Chemigation, and Fumigation are the different type of application modes through which crop protection chemicals are applied to the crops.
- Crop Type - This represents the consumption of crop protection chemicals by Cereals, Pulses, Oilseeds, Fruits, Vegetables, Turf, and Ornamental crops.
| Keyword | Definition |
|---|---|
| IWM | Integrated weed management (IWM) is an approach to incorporate multiple weed control techniques throughout the growing season to give producers the best opportunity to control problematic weeds. |
| Host | Hosts are the plants that form relationships with beneficial microorganisms and help them colonize. |
| Pathogen | A disease-causing organism. |
| Herbigation | Herbigation is an effective method of applying herbicides through irrigation systems. |
| Maximum residue levels (MRL) | Maximum Residue Limit (MRL) is the maximum allowed limit of pesticide residue in food or feed obtained from plants and animals. |
| IoT | The Internet of Things (IoT) is a network of interconnected devices that connect and exchange data with other IoT devices and the cloud. |
| Herbicide-tolerant varieties (HTVs) | Herbicide-tolerant varieties are plant species that have been genetically engineered to be resistant to herbicides used on crops. |
| Chemigation | Chemigation is a method of applying pesticides to crops through an irrigation system. |
| Crop Protection | Crop protection is a method of protecting crop yields from different pests, including insects, weeds, plant diseases, and others that cause damage to agricultural crops. |
| Seed Treatment | Seed treatment helps to disinfect seeds or seedlings from seed-borne or soil-borne pests. Crop protection chemicals, such as fungicides, insecticides, or nematicides, are commonly used for seed treatment. |
| Fumigation | Fumigation is the application of crop protection chemicals in gaseous form to control pests. |
| Bait | A bait is a food or other material used to lure a pest and kill it through various methods, including poisoning. |
| Contact Fungicide | Contact pesticides prevent crop contamination and combat fungal pathogens. They act on pests (fungi) only when they come in contact with the pests. |
| Systemic Fungicide | A systemic fungicide is a compound taken up by a plant and then translocated within the plant, thus protecting the plant from attack by pathogens. |
| Mass Drug Administration (MDA) | Mass drug administration is the strategy to control or eliminate many neglected tropical diseases. |
| Mollusks | Mollusks are pests that feed on crops, causing crop damage and yield loss. Mollusks include octopi, squid, snails, and slugs. |
| Pre-emergence Herbicide | Preemergence herbicides are a form of chemical weed control that prevents germinated weed seedlings from becoming established. |
| Post-emergence Herbicide | Postemergence herbicides are applied to the agricultural field to control weeds after emergence (germination) of seeds or seedlings. |
| Active Ingredients | Active ingredients are the chemicals in pesticide products that kill, control, or repel pests. |
| United States Department of Agriculture (USDA) | The Department of Agriculture provides leadership on food, agriculture, natural resources, and related issues. |
| Weed Science Society of America (WSSA) | The WSSA, a non-profit professional society, promotes research, education, and extension outreach activities related to weeds. |
| Suspension concentrate | Suspension concentrate (SC) is one of the formulations of crop protection chemicals with solid active ingredients dispersed in water. |
| Wettable powder | A wettable powder (WP) is a powder formulation that forms a suspension when mixed with water prior to spraying. |
| Emulsifiable concentrate | Emulsifiable concentrate (EC) is a concentrated liquid formulation of pesticide that needs to be diluted with water to create a spray solution. |
| Plant-parasitic nematodes | Parasitic Nematodes feed on the roots of crops, causing damage to the roots. These damages allow for easy plant infestation by soil-borne pathogens, which results in crop or yield loss. |
| Australian Weeds Strategy (AWS) | The Australian Weeds Strategy, owned by the Environment and Invasives Committee, provides national guidance on weed management. |
| Weed Science Society of Japan (WSSJ) | WSSJ aims to contribute to the prevention of weed damage and the utilization of weed value by providing the chance for research presentation and information exchange. |


Research Methodology
Mordor Intelligence follows a four-step methodology in all our reports.
- Step-1: Identify Key Variables: In order to build a robust forecasting methodology, the variables and factors identified in Step-1 are tested against available historical market numbers. Through an iterative process, the variables required for market forecast are set and the model is built on the basis of these variables.
- Step-2: Build a Market Model: Market-size estimations for the forecast years are in nominal terms. Inflation is not a part of the pricing, and the average selling price (ASP) is kept constant throughout the forecast period.
- Step-3: Validate and Finalize: In this important step, all market numbers, variables and analyst calls are validated through an extensive network of primary research experts from the market studied. The respondents are selected across levels and functions to generate a holistic picture of the market studied.
- Step-4: Research Outputs: Syndicated Reports, Custom Consulting Assignments, Databases & Subscription Platforms


