Market Overview
| Study Period | 2018 - 2031 |
|---|---|
| Forecast Data Period | 2026 - 2031 |
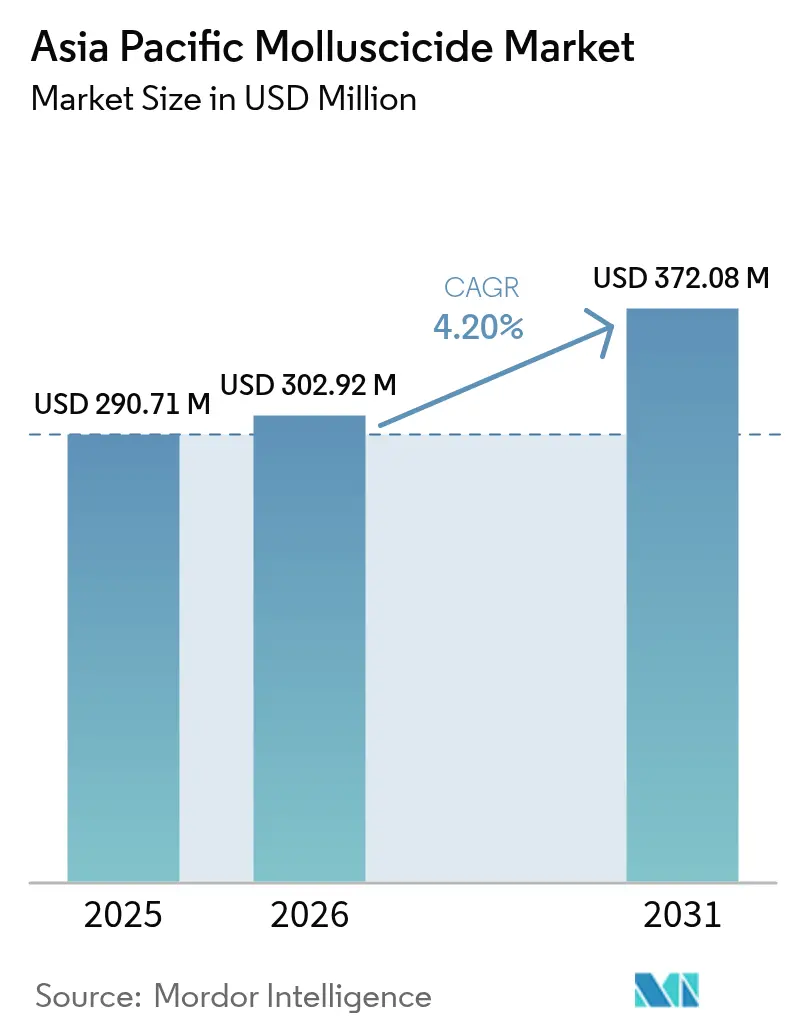
| Base Year Market Size (2025) | USD 290.71 Million |
| Market Size (2026) | USD 302.92 Million |
| Market Size (2031) | USD 372.08 Million |
| Growth Rate (2026 - 2031) | 4.20% CAGR |
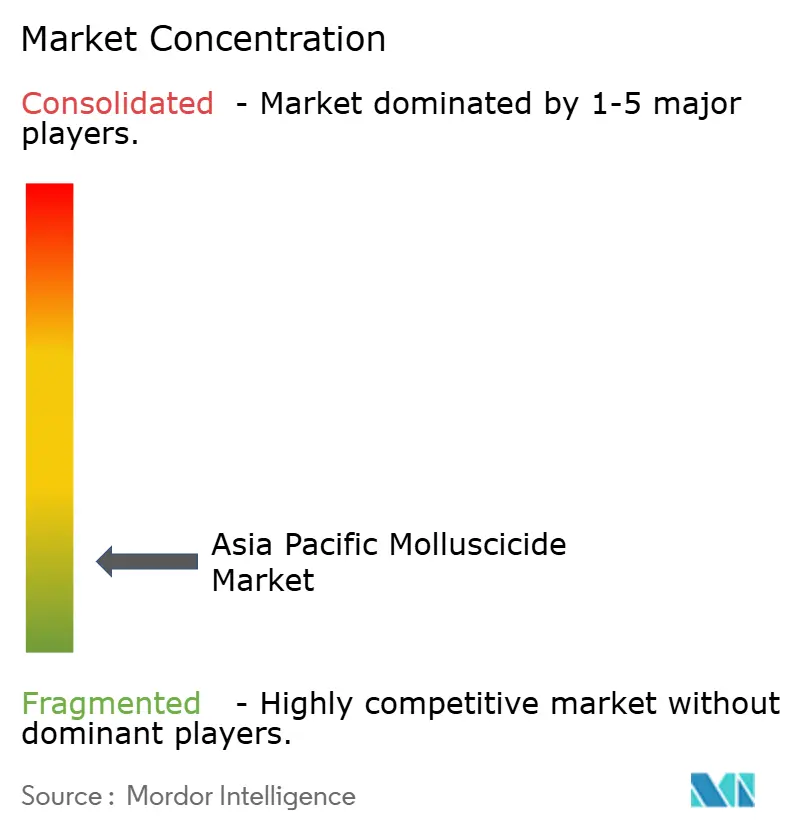
| Market Concentration | Low |
Major Players *Disclaimer: Major Players sorted in no particular order Image © Mordor Intelligence. Reuse requires attribution under CC BY 4.0. | |
Asia Pacific Molluscicide Market Analysis by Mordor Intelligence
The Asia Pacific molluscicide market size was valued at USD 290.71 million in 2025 and estimated to grow from USD 302.92 million in 2026 to reach USD 372.08 million by 2031, at a CAGR of 4.20% during the forecast period (2026-2031). This trajectory is based on the resurgence of golden apple snail infestations in rice paddies, the rapid growth in demand for biological formulations, and the increasing adoption of precision farming. Regulatory scrutiny of metaldehyde accelerates the pivot toward ferric phosphate and botanical solutions, while protected cultivation systems amplify humidity and pest pressure. Suppliers compete on efficacy, residue compliance, and digital-ag integration, creating headroom for innovators that bundle precision application hardware with eco-friendly active ingredients. The Asia Pacific molluscicide market continues to benefit from government subsidies that lower input costs, particularly among smallholders, thereby sustaining volume gains despite fluctuations in commodity prices.
Key Report Takeaways
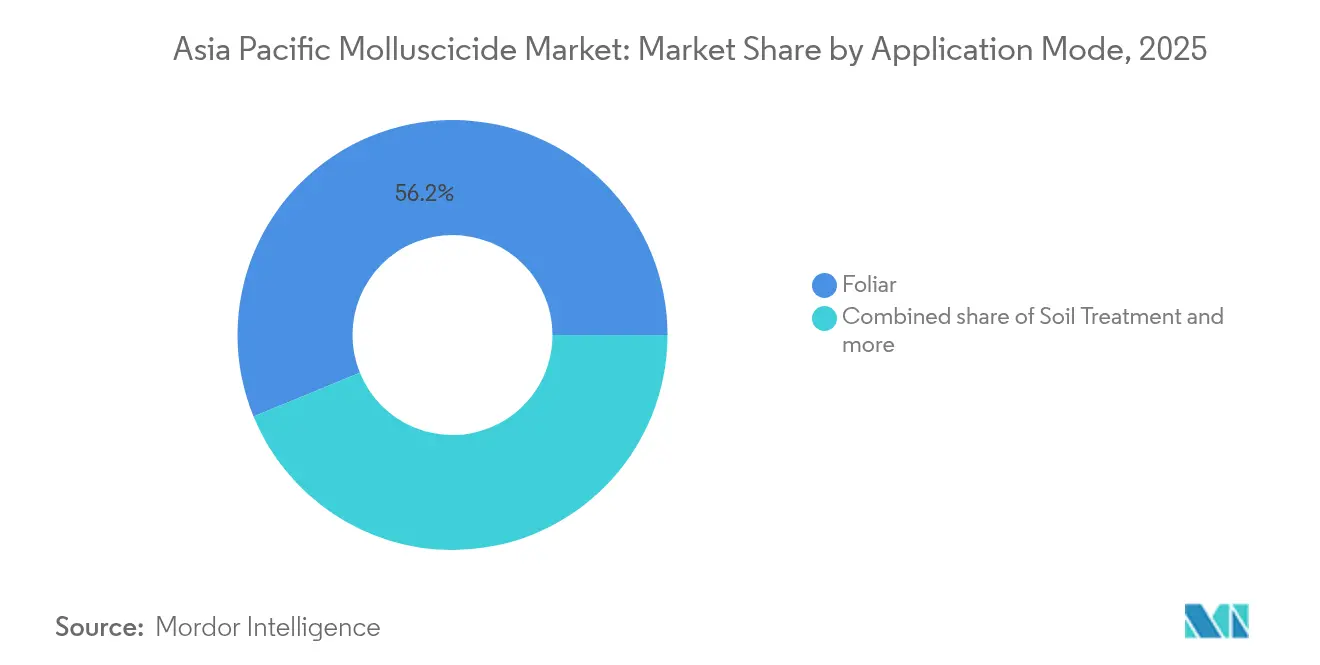
- By application mode, foliar treatments accounted for 56.18% of the Asia Pacific molluscicide market share in 2025, while foliar treatments posted the fastest CAGR of 4.28% through 2031.
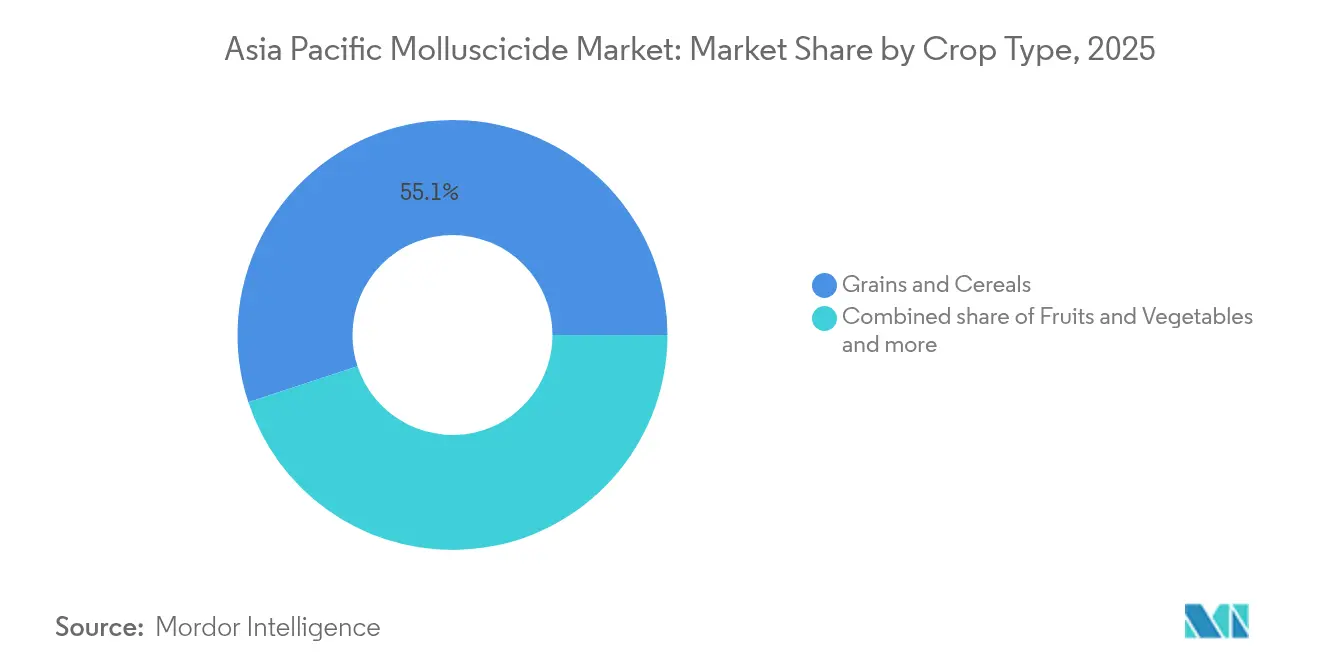
- By crop type, grains and cereals captured 55.07% of the Asia Pacific molluscicide market size in 2025, whereas fruits and vegetables are anticipated to expand at a 4.26% CAGR through 2031.
- By geography, China led with 31.95% revenue share in 2025, and Vietnam is forecast to grow at 6.62% CAGR through 2031
Note: Market size and forecast figures in this report are generated using Mordor Intelligence’s proprietary estimation framework, updated with the latest available data and insights as of 2026.
Asia Pacific Molluscicide Market Trends and Insights
Drivers Impact Analysis*
| Driver | (~) % Impact on CAGR Forecast | Geographic Relevance | Impact Timeline |
|---|---|---|---|
| Golden apple snail resurgence in rice paddies | +0.8% | China, Vietnam, Thailand, Philippines, and Indonesia | Medium term (2–4 years) |
| Government crop-protection subsidy schemes | +0.7% | India, Indonesia, Vietnam, and Myanmar | Short term (≤2 years) |
| Expansion of high-value horticulture acreage | +0.6% | China, India, Australia, and Japan | Long term (≥4 years) |
| Rapid ag-chem adoption by smallholders | +0.5% | India, Indonesia, Philippines, and Myanmar | Medium term (2–4 years) |
| Climate-driven rise in protected cultivation humidity | +0.4% | Japan, Australia, China, and India | Long term (≥4 years) |
| Mollusc-vector control demand from aquaculture | +0.3% | Vietnam, Thailand, Indonesia, and China | Medium term (2–4 years) |
| Source: Mordor Intelligence | |||


Golden Apple Snail Resurgence in Rice Paddies
The golden apple snail (Pomacea canaliculata) outbreak across Asia Pacific rice systems represents the most significant biological driver reshaping molluscicide demand patterns. Rice yield losses of 20-80% in heavily infested areas have prompted emergency chemical interventions, with Vietnam reporting over 100,000 hectares affected in 2024[1]Source: Vietnam Plant Protection Department, “Golden Apple Snail Management Guidelines,” ppd.gov.vn. The snail's rapid reproduction rate and resistance to traditional control methods creates sustained demand for specialized molluscicides, particularly in regions where manual removal proves economically unviable. The snail's expansion into previously unaffected regions, aided by climate change and water management practices, ensures continued market growth beyond traditional pest control cycles.
Government Crop-Protection Subsidy Schemes
Agricultural input subsidies across developing Asia Pacific economies have fundamentally altered the economics of molluscicide adoption, particularly among smallholder farmers who previously relied on manual control methods. India's Pradhan Mantri Fasal Bima Yojana provides crop insurance coverage that includes pest control inputs, effectively reducing farmers' risk and encouraging the adoption of chemical inputs. Vietnam's National Target Program for New Rural Development allocates funds annually for agricultural modernization, with a significant portion of this funding directed toward crop protection technologies. Because reimbursement frameworks often tie payouts to registered active ingredients, manufacturers that secure regulatory listing gain an advantage over informal competitors. These policies collectively lift baseline demand growth for the Asia Pacific molluscicide market beyond what macro commodity cycles alone would generate price sensitivity decreases and volume uptake accelerating beyond natural market conditions.
Expansion of High-Value Horticulture Acreage
The shift toward high-value horticultural crops across the Asia Pacific creates distinct molluscicide demand patterns that differ markedly from traditional field crop applications. Protected cultivation systems for vegetables and fruits generate microenvironments with elevated humidity and temperature conditions that favor mollusk proliferation, requiring more frequent and targeted chemical interventions. Japan's controlled-environment agriculture sector demonstrates how premium crop values justify higher molluscicide input costs per hectare. Because controlled environments enable year-round production, the Asia Pacific molluscicide market benefits from non-seasonal demand peaks, which stabilize factory utilization rates and support investment in regional manufacturing capacity.
Rapid Ag-Chem Adoption by Smallholders
The transition from subsistence to commercial farming among smallholders in the Asia-Pacific drives fundamental changes in molluscicide consumption patterns, shifting from traditional large-scale applications toward distributed, frequent-use scenarios. Rising disposable incomes in rural Indonesia and the Philippines enable farmers to purchase branded chemical products rather than relying on homemade solutions or manual labor. Agricultural extension programs are increasingly promoting integrated pest management approaches that incorporate chemical components, thereby creating educated demand for specific active ingredients and application methods. Because smallholder plots are contiguous, community-level adoption often occurs after one influential farmer reports success, creating word-of-mouth momentum that propels the Asia Pacific molluscicide market across entire districts.
Restraints Impact Analysis*
| Restraint | (~) % Impact on CAGR Forecast | Geographic Relevance | Impact Timeline |
|---|---|---|---|
| Tightening metaldehyde residue regulations | −0.6% | Japan, Australia, and developed Asia-Pacific markets | Short term (≤2 years) |
| Consumer pivot to organic produce | −0.4% | Export-oriented regions worldwide | Medium term (2–4 years) |
| Duck–rice integrated farming systems | −0.3% | China, Vietnam, traditional paddies | Long term (≥4 years) |
| Drone-enabled mechanical baiting alternatives | −0.2% | Japan, Australia, tech-advanced areas | Long term (≥4 years) |
| Source: Mordor Intelligence | |||
Tightening Metaldehyde Residue Regulations
Regulatory restrictions on metaldehyde-based molluscicides across developed Asia-Pacific markets necessitate fundamental shifts in product development and market positioning strategies. Japan's Ministry of Agriculture implemented maximum residue limits of 0.01 ppm for metaldehyde in 2024, effectively eliminating many traditional formulations from commercial use [2]Source: Japan Food Safety Commission, “Maximum Residue Limits for Pesticides,” fsc.go.jp. Australia's Australian Pesticides and Veterinary Medicines Authority initiated comprehensive reviews of metaldehyde products due to concerns about environmental persistence, with several registrations under suspension pending toxicological reassessment. As restrictions spread, ferric phosphate and botanical extracts gain a share foothold in the Asia Pacific molluscicide market.
Consumer Pivot to Organic Produce
The expanding organic food market across the Asia Pacific creates systematic demand destruction for synthetic molluscicides, particularly in export-oriented agricultural regions where certification requirements prohibit the use of chemical residues. Organic certification bodies are increasingly scrutinizing pest control methods, requiring detailed documentation of non-chemical alternatives and creating administrative barriers that discourage the use of synthetic products. Although biological vendors benefit, the total revenue potential is diluted when growers opt for non-chemical tactics over routine chemical sprays.
*Our forecasts treat driver/restraint impacts as directional, not additive. The impact forecasts reflect baseline growth, mix effects, and variable interactions.
Segment Analysis
By Application Mode: Foliar Dominance Driven by Precision Needs
Emerging precision agriculture technologies are reshaping application mode preferences, with foliar treatments maintaining a 56.18% market share in 2025, due to their superior targeting capabilities and immediate efficacy requirements. The segment's 4.28% forecasted CAGR through 2031 reflects the increasing adoption of drone-enabled spraying systems and climate-controlled environments, where humidity management creates optimal conditions for mollusk breeding. Foliar application is particularly effective because slugs and snails primarily feed on succulent parts, such as leaves and young stems, making this method highly efficient in targeting the plant's above-ground parts.
The segment's prominence is driven by its ability to respond quickly to pest outbreaks, providing farmers with crucial flexibility in managing various pests during crop growth cycles. Among crops, grains and cereals represent the largest application area for foliar molluscicides, followed by pulses and oilseeds, and fruits and vegetables. China leads in foliar segment utilization, followed by India and Japan, with the adoption of precision farming technologies optimizing resource efficiency and minimizing wastage while boosting yields.


By Crop Type: Premium Segments Drive Innovation
Grains and cereals maintain the largest market share at 55.07% in 2025, reflecting the scale of rice production across the Asia Pacific and the severity of golden apple snail infestations in paddy systems. This significant share is primarily driven by the extensive cultivation of rice, wheat, barley, oat, rye, corn, millet, and triticale across the region. The segment's dominance is particularly notable in countries like India, China, and Japan, where rice cultivation faces significant challenges from golden apple snails and other mollusk species.
The high humidity levels in many parts of the Asia-Pacific create favorable conditions for mollusk proliferation, making crop protection crucial for maintaining yield quality and quantity in grain and cereal production. Fruits and vegetables emerge as the fastest-growing segment, with a 4.26% CAGR through 2031, driven by expanding protected cultivation and export market quality requirements that justify premium molluscicide inputs.
Geography Analysis
China dominates the Asia Pacific molluscicide market, holding a 31.95% share in 2025, driven by its position as the world's largest rice production area and the severe infestations of the golden apple snail across southern provinces, including Guangdong, Guangxi, and Hunan. The country's agricultural modernization initiatives and government subsidies for crop protection inputs create sustained demand growth, while expanding greenhouse vegetable production in northern regions generates new application opportunities beyond traditional field crops.
Vietnam emerges as the fastest-growing market, with a 6.62% CAGR through 2031, reflecting rapid agricultural intensification and expanding aquaculture operations that require mollusk vector control for disease management. The country's National Target Program for New Rural Development allocates substantial resources toward agricultural modernization, including the adoption of crop protection technology among smallholder farmers. Rising shrimp and fish production creates a unique demand for molluscicides from parasite control applications, representing market expansion beyond traditional agricultural uses.
India, Indonesia, Thailand, and the Philippines represent substantial growth markets driven by expanding agricultural commercialization and increasing pest pressure from climate change effects. Japan and Australia maintain mature markets characterized by premium product demand and strict regulatory compliance requirements that favor innovative formulations over traditional chemical approaches .
Competitive Landscape
The Asia Pacific molluscicide market exhibits low concentration, with the top players including Upl Limited, Nufarm Ltd., PI Industries, Arxada, and American Vanguard Corporation. Global players leverage their extensive research capabilities and broad product portfolios, while regional players capitalize on their deep understanding of local agricultural conditions and established distribution networks. The market structure exhibits fragmentation, with the top players collectively holding a significant but not dominant share, thereby allowing room for smaller, specialized players to operate in specific geographic or crop segments.
Market consolidation is primarily driven by strategic acquisitions aimed at expanding geographic reach and strengthening technological capabilities. Major players are actively pursuing mergers and acquisitions to gain access to new markets and complementary product portfolios. These consolidation activities are particularly focused on acquiring companies with strong distribution networks in key agricultural regions and those possessing innovative molluscicide formulations. The trend towards consolidation is likely to continue as companies seek to achieve economies of scale and enhance their competitive positioning.
Technology adoption patterns increasingly determine competitive positioning, with companies integrating digital agriculture platforms and precision delivery systems gaining market share from traditional chemical suppliers. Patent filings in biological molluscicide formulations and targeted delivery mechanisms accelerated in 2024, indicating intensified R&D competition focused on sustainable solutions.
Asia Pacific Molluscicide Industry Leaders
Upl Limited
Nufarm Ltd.
PI Industries
Arxada
American Vanguard Corporation
- *Disclaimer: Major Players sorted in no particular order

Recent Industry Developments
- January 2022: Arxada, one of the world's leading manufacturers of specialty chemicals, launched specialty chemicals under the Axcela brand. The product is manufactured using a unique wet-extrusion process.
- December 2020: UPL Ltd. launched the opening of a state-of-the-art manufacturing facility in Jhagadia, located in the state of Gujarat, India. The facility will support the production of crop protection products, including molluscicides, which are used to control annual and perennial grasses in a wide variety of crops.


Asia Pacific Molluscicide Market Report Scope
Chemigation, Foliar, Fumigation, Soil Treatment are covered as segments by Application Mode. Commercial Crops, Fruits & Vegetables, Grains & Cereals, Pulses & Oilseeds, Turf & Ornamental are covered as segments by Crop Type. Australia, China, India, Indonesia, Japan, Myanmar, Pakistan, Philippines, Thailand, Vietnam are covered as segments by Country.Application Mode
| Chemigation |
| Foliar |
| Fumigation |
| Soil Treatment |
Crop Type
| Commercial Crops |
| Fruits and Vegetables |
| Grains and Cereals |
| Pulses and Oilseeds |
| Turf and Ornamental |
Geography
| China |
| India |
| Japan |
| Australia |
| Vietnam |
| Philippines |
| Pakistan |
| Myanmar |
| Indonesia |
| Thailand |
| Rest of Asia-Pacific |
| Application Mode | Chemigation |
| Foliar | |
| Fumigation | |
| Soil Treatment | |
| Crop Type | Commercial Crops |
| Fruits and Vegetables | |
| Grains and Cereals | |
| Pulses and Oilseeds | |
| Turf and Ornamental | |
| Geography | China |
| India | |
| Japan | |
| Australia | |
| Vietnam | |
| Philippines | |
| Pakistan | |
| Myanmar | |
| Indonesia | |
| Thailand | |
| Rest of Asia-Pacific |


Market Definition
- Function - Molluscicides are chemicals used to control or prevent mollusks from damaging the crop and prevent yield loss.
- Application Mode - Foliar, Seed Treatment, Soil Treatment, Chemigation, and Fumigation are the different type of application modes through which crop protection chemicals are applied to the crops.
- Crop Type - This represents the consumption of crop protection chemicals by Cereals, Pulses, Oilseeds, Fruits, Vegetables, Turf, and Ornamental crops.
| Keyword | Definition |
|---|---|
| IWM | Integrated weed management (IWM) is an approach to incorporate multiple weed control techniques throughout the growing season to give producers the best opportunity to control problematic weeds. |
| Host | Hosts are the plants that form relationships with beneficial microorganisms and help them colonize. |
| Pathogen | A disease-causing organism. |
| Herbigation | Herbigation is an effective method of applying herbicides through irrigation systems. |
| Maximum residue levels (MRL) | Maximum Residue Limit (MRL) is the maximum allowed limit of pesticide residue in food or feed obtained from plants and animals. |
| IoT | The Internet of Things (IoT) is a network of interconnected devices that connect and exchange data with other IoT devices and the cloud. |
| Herbicide-tolerant varieties (HTVs) | Herbicide-tolerant varieties are plant species that have been genetically engineered to be resistant to herbicides used on crops. |
| Chemigation | Chemigation is a method of applying pesticides to crops through an irrigation system. |
| Crop Protection | Crop protection is a method of protecting crop yields from different pests, including insects, weeds, plant diseases, and others that cause damage to agricultural crops. |
| Seed Treatment | Seed treatment helps to disinfect seeds or seedlings from seed-borne or soil-borne pests. Crop protection chemicals, such as fungicides, insecticides, or nematicides, are commonly used for seed treatment. |
| Fumigation | Fumigation is the application of crop protection chemicals in gaseous form to control pests. |
| Bait | A bait is a food or other material used to lure a pest and kill it through various methods, including poisoning. |
| Contact Fungicide | Contact pesticides prevent crop contamination and combat fungal pathogens. They act on pests (fungi) only when they come in contact with the pests. |
| Systemic Fungicide | A systemic fungicide is a compound taken up by a plant and then translocated within the plant, thus protecting the plant from attack by pathogens. |
| Mass Drug Administration (MDA) | Mass drug administration is the strategy to control or eliminate many neglected tropical diseases. |
| Mollusks | Mollusks are pests that feed on crops, causing crop damage and yield loss. Mollusks include octopi, squid, snails, and slugs. |
| Pre-emergence Herbicide | Preemergence herbicides are a form of chemical weed control that prevents germinated weed seedlings from becoming established. |
| Post-emergence Herbicide | Postemergence herbicides are applied to the agricultural field to control weeds after emergence (germination) of seeds or seedlings. |
| Active Ingredients | Active ingredients are the chemicals in pesticide products that kill, control, or repel pests. |
| United States Department of Agriculture (USDA) | The Department of Agriculture provides leadership on food, agriculture, natural resources, and related issues. |
| Weed Science Society of America (WSSA) | The WSSA, a non-profit professional society, promotes research, education, and extension outreach activities related to weeds. |
| Suspension concentrate | Suspension concentrate (SC) is one of the formulations of crop protection chemicals with solid active ingredients dispersed in water. |
| Wettable powder | A wettable powder (WP) is a powder formulation that forms a suspension when mixed with water prior to spraying. |
| Emulsifiable concentrate | Emulsifiable concentrate (EC) is a concentrated liquid formulation of pesticide that needs to be diluted with water to create a spray solution. |
| Plant-parasitic nematodes | Parasitic Nematodes feed on the roots of crops, causing damage to the roots. These damages allow for easy plant infestation by soil-borne pathogens, which results in crop or yield loss. |
| Australian Weeds Strategy (AWS) | The Australian Weeds Strategy, owned by the Environment and Invasives Committee, provides national guidance on weed management. |
| Weed Science Society of Japan (WSSJ) | WSSJ aims to contribute to the prevention of weed damage and the utilization of weed value by providing the chance for research presentation and information exchange. |


Research Methodology
Mordor Intelligence follows a four-step methodology in all our reports.
- Step-1: Identify Key Variables: In order to build a robust forecasting methodology, the variables and factors identified in Step-1 are tested against available historical market numbers. Through an iterative process, the variables required for market forecast are set and the model is built on the basis of these variables.
- Step-2: Build a Market Model: Market-size estimations for the forecast years are in nominal terms. Inflation is not a part of the pricing, and the average selling price (ASP) is kept constant throughout the forecast period.
- Step-3: Validate and Finalize: In this important step, all market numbers, variables and analyst calls are validated through an extensive network of primary research experts from the market studied. The respondents are selected across levels and functions to generate a holistic picture of the market studied.
- Step-4: Research Outputs: Syndicated Reports, Custom Consulting Assignments, Databases & Subscription Platforms


