ASEAN Freight Brokerage Services Market Size and Share
Market Overview
| Study Period | 2020 - 2031 |
|---|---|
| Forecast Data Period | 2026 - 2031 |
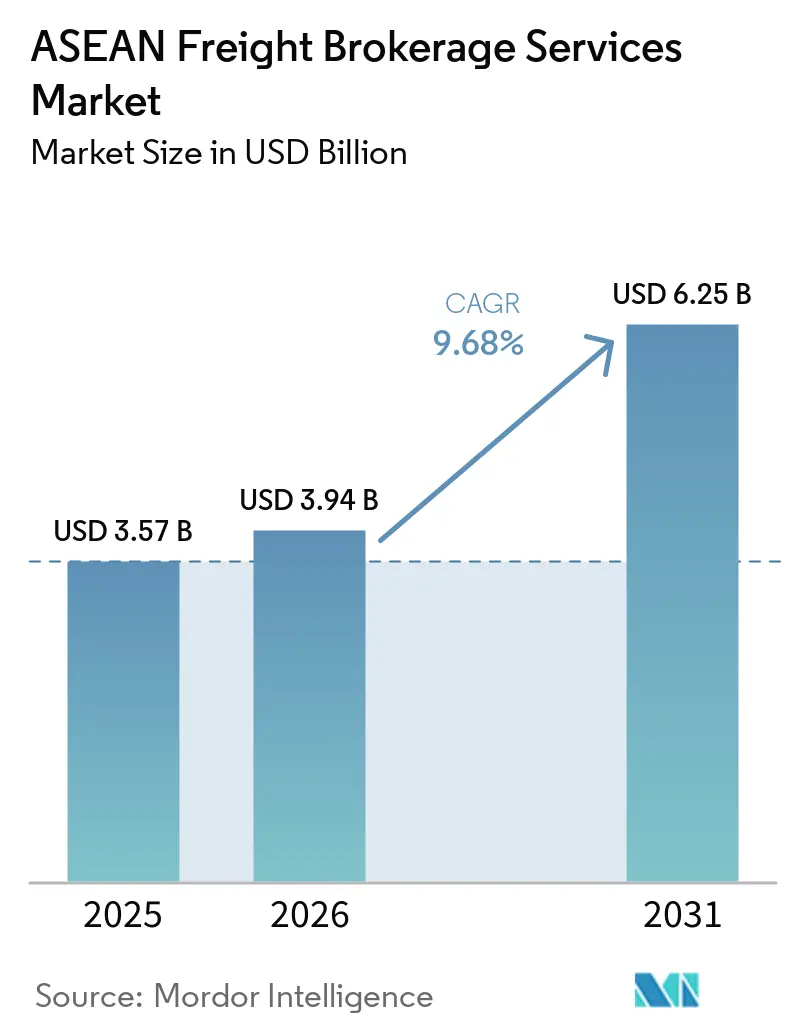
| Base Year Market Size (2025) | USD 3.57 Billion |
| Market Size (2026) | USD 3.94 Billion |
| Market Size (2031) | USD 6.25 Billion |
| Growth Rate (2026 - 2031) | 9.68% CAGR |
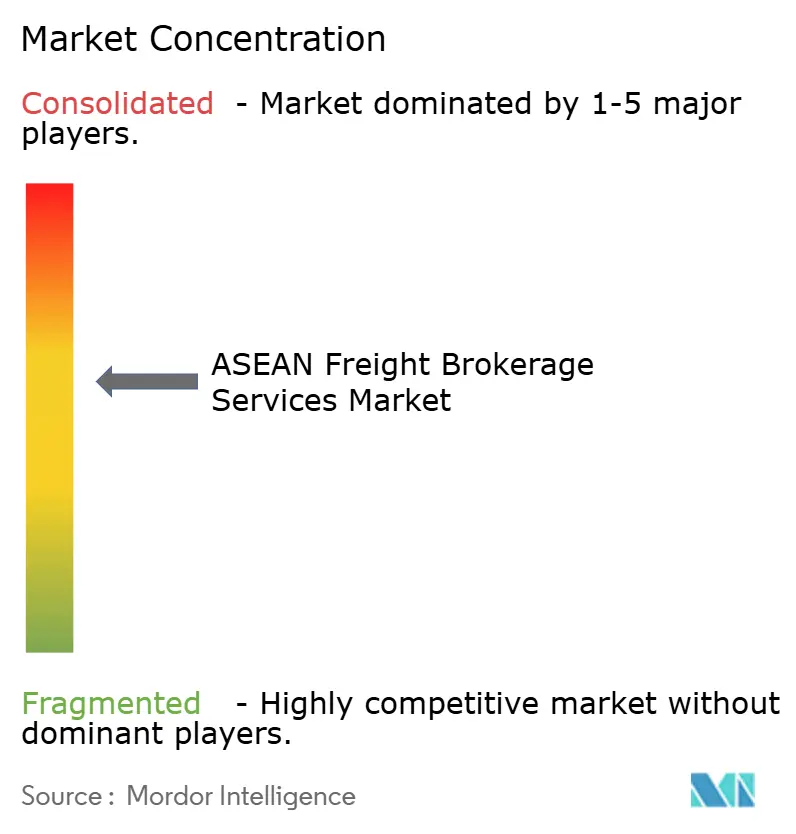
| Market Concentration | Medium |
Major Players *Disclaimer: Major Players sorted in no particular order Image © Mordor Intelligence. Reuse requires attribution under CC BY 4.0. | |
ASEAN Freight Brokerage Services Market Analysis by Mordor Intelligence
The ASEAN freight brokerage services market size is expected to grow from USD 3.57 billion in 2025 to USD 3.94 billion in 2026 and is forecast to reach USD 6.25 billion by 2031 at a 9.68% CAGR over 2026-2031. A tightening capacity environment, automated rate-discovery tools, and Phase II of the ASEAN Customs Single Window are shrinking bid-response and border-clearance times, improving asset utilization, and raising service expectations. Digital platforms already compress quote cycles from days to hours, while predictive algorithms lower empty-mile ratios by up to 18%, widening the cost gap with relationship-based brokers. Nearshoring into Vietnam and Thailand fuels less-than-containerload (LCL) consolidation, and ESG-linked finance channels capital toward low-carbon corridors, rewarding brokers that can document emissions savings. Persistent equipment imbalances and currency swings, however, shave 80-120 basis points from average margins and keep service reliability under pressure.[1]ASEAN Secretariat, “ASEAN Single Window (ASW) and Digital Trade Facilitation,” asean.org
Key Report Takeaways
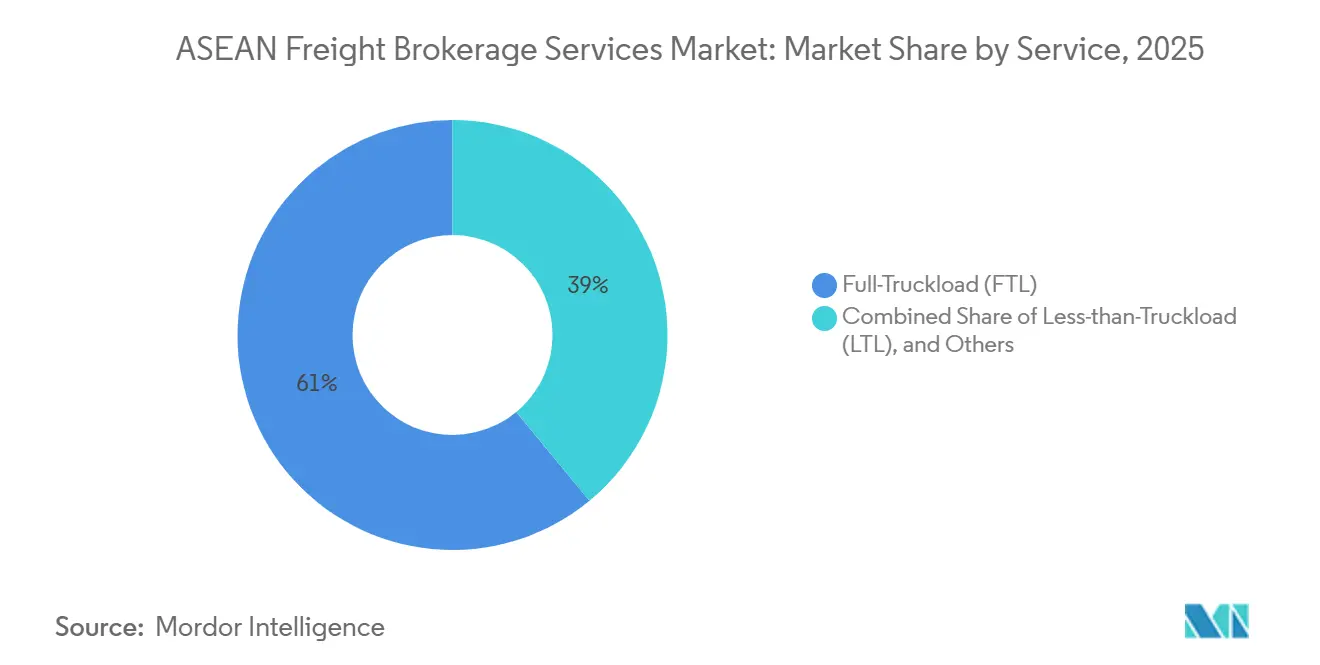
- By service, full-truckload accounted for 61.00% of the ASEAN freight brokerage services market size in 2025, and less-than-truckload is rising at a 12.20% CAGR to 2031.
- By equipment type, dry vans led with 48.94% of the ASEAN freight brokerage services market share in 2025, while refrigerated vans are projected to advance at a 13.52% CAGR through 2031.
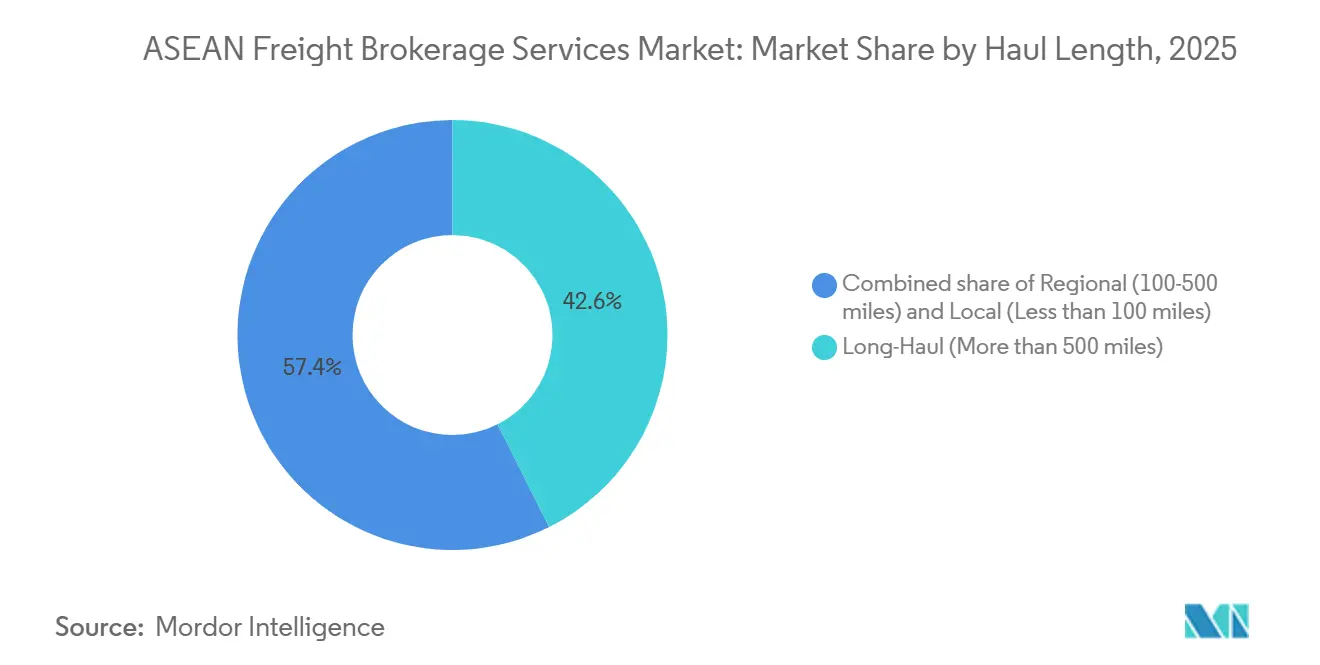
- By haul length, long-haul services held a 42.58% share of the ASEAN freight brokerage services market in 2025; local moves under 100 miles represent the fastest-growing segment, with a 13.77% CAGR to 2031.
- By business model, traditional brokers held 51.88% of the ASEAN freight brokerage services market in 2025; digital platforms recorded the fastest expansion, with a 24.33% CAGR to 2031.
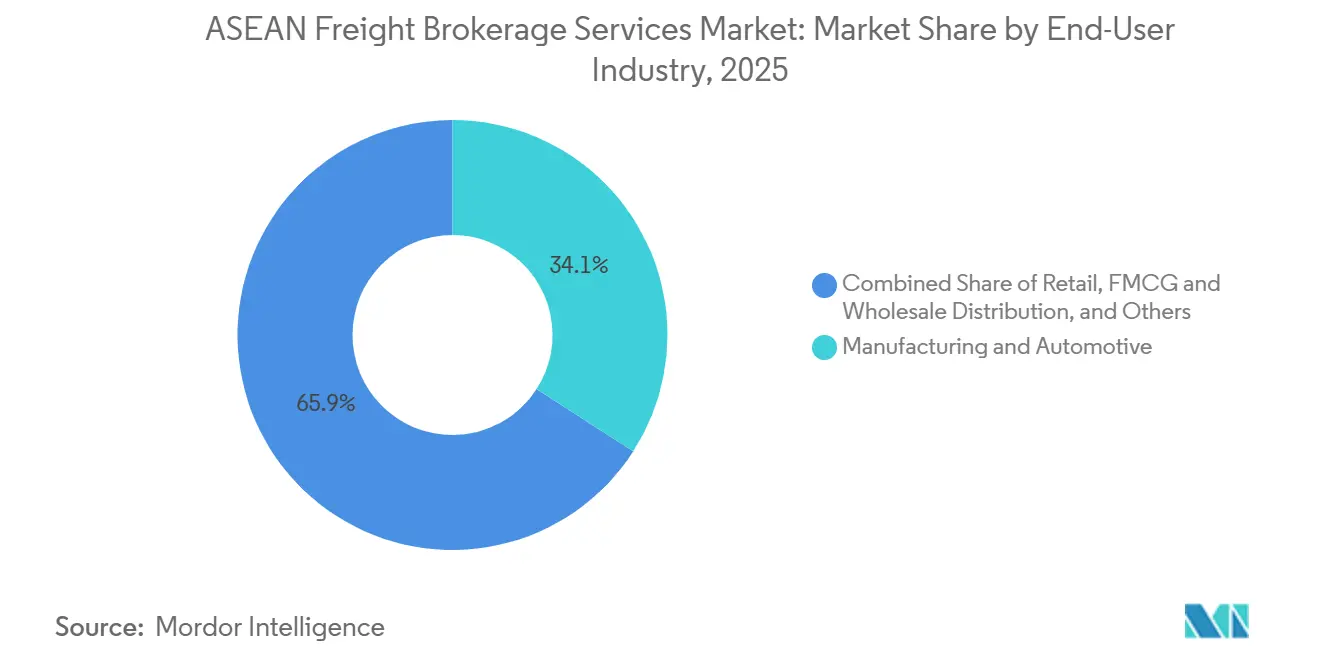
- By end-user, manufacturing & automotive led with 34.10% revenue share in 2025, while e-commerce & 3PL fulfillment is forecast to post an 18.02% CAGR through 2031.
- By customer size, enterprises above USD 100 million commanded 53.98% share of the ASEAN freight brokerage services market size in 2025, whereas firms under USD 10 million grow at a 15.51% CAGR between 2026 and 2031.
- By country, Indonesia dominated at 44.49% share in 2025, whereas Vietnam is set to grow at a 10.27% CAGR through 2031.
Note: Market size and forecast figures in this report are generated using Mordor Intelligence’s proprietary estimation framework, updated with the latest available data and insights as of January 2026.
ASEAN Freight Brokerage Services Market Trends and Insights
Drivers Impact Analysis*
| Drivers | (~) % Impact on CAGR Forecast | Geographic Relevance | Impact Timeline |
|---|---|---|---|
| Nearshoring–driven surge in LCL consolidation from “China + 1” suppliers | +2.4% | Vietnam, Thailand, Malaysia, Indonesia | Short term (≤ 2 years) |
| AI-driven predictive tendering and dynamic spot-rate automation | +2.2% | Singapore, Thailand, Malaysia, Indonesia | Short term (≤ 2 years) |
| ASEAN Customs Single Window Phase II roll-out compressing dwell times | +1.9% | All ASEAN, strongest in Vietnam, Thailand, and Malaysia | Medium term (2-4 years) |
| Emergence of green freight corridors & ESG-linked shipping finance | +1.3% | Singapore, Thailand, Vietnam, Indonesia | Long term (≥ 4 years) |
| Expansion of regional cold-chain pharma hubs | +1.1% | Singapore, Thailand, Vietnam, Malaysia | Medium term (2-4 years) |
| Shift of marine-insurance premia toward alternate SEA trans-shipment hubs | +0.7% | Vietnam, Malaysia, Thailand, Philippines | Medium term (2-4 years) |
| Source: Mordor Intelligence | |||
Nearshoring Surge in LCL Consolidation from “China + 1” Suppliers
Diversified sourcing sends single orders across several ASEAN factories, swelling sub-container loads that require skilled consolidation. Vietnam’s electronics exports to the U.S. hit record highs in 2025, with components pooled from plants in Malaysia and Thailand before trans-Pacific sailings. Digital platforms that blend fractional freight across complementary routes cut per-unit shipping costs by up to 35%. Harmonizing tariff codes and rules-of-origin paperwork adds complexity that tech-savvy brokers monetize as a premium service. Equipment shortages still pose a risk, but the volume upside outweighs the cost headwinds in high-growth lanes.
AI-Driven Predictive Tendering & Dynamic Spot-Rate Automation
Machine-learning engines predict carrier availability and ideal tender timing with up to 85% accuracy, letting platforms refresh spot quotes every four hours to reflect lane-level demand shifts and fuel movements. Empty-mile ratios have fallen 12-18% on corridors that adopt these tools, lifting brokerage margins on round trips. Singapore and Malaysia show the highest uptake because cloud infrastructure and carrier EDI integration are mature. Smaller brokers in Myanmar and Cambodia lack the capital and skills to deploy comparable systems, widening the digital divide. Continued investment signals faster consolidation as tech-enabled players undercut legacy brokers.
ASEAN Customs Single Window Phase II Roll-Out Compressing Dwell Times
Digitized documentation exchange now clears border cargo in as little as 12 hours compared with the multiday wait times prevalent before comprehensive digital integration. Thailand’s linkage with Malaysia and Vietnam cuts compliance costs by up to 40% per crossing, making guaranteed transit services commercially viable. Real-time visibility improves exception handling and lowers detention fees, especially for less-than-container-load consolidators juggling multiple HS codes. With all ten ASEAN states already integrated, current efforts are expanding the framework to the ASEAN-China Single Window, establishing a continuous digital freight corridor from Singapore to China’s Yunnan province. Brokers fluent in these advanced data-exchange protocols are already commanding premium rates for expedited clearance.
Emergence of Green Freight Corridors & ESG-Linked Shipping Finance
Banks discount interest rates by up to 40 basis points for carriers meeting ISO 14001 and Science-Based Targets, accelerating investment in low-emission trucks and intermodal options. DHL’s GoGreen Plus program shows shippers are willing to pay 8-15% premiums for traceable Scope 3 carbon cuts, especially on long-haul lanes in Thailand and Vietnam. Singapore’s Green Plan 2030 sets a template for mandatory emissions reporting, giving compliant brokers a head start. Initially, the value proposition skews toward multinationals, but rising disclosure rules will push even SMEs to demand carbon data. Brokers able to feed verifiable footprint metrics into procurement portals are poised to win volume.[2]Government of Singapore, “Singapore Green Plan 2030,” greenplan.gov.sg
Restraints Impact Analysis*
| Restraints | (~) % Impact on CAGR Forecast | Geographic Relevance | Impact Timeline |
|---|---|---|---|
| Chronic container & chassis equipment imbalance within ASEAN hinterlands | -1.7% | Indonesia, Vietnam, Thailand, Philippines | Short term (≤ 2 years) |
| Enduring port congestion at secondary gateways & inland connectivity gaps | -1.5% | Indonesia, Philippines, Vietnam, Myanmar | Medium term (2-4 years) |
| Regulatory ambiguity on digital-broker licensing & data-localization mandates | -1.2% | All ASEAN countries, especially Indonesia, Vietnam, Thailand | Medium term (2-4 years) |
| Currency-volatility-driven hedging costs compressing brokerage margins | -1.1% | All ASEAN countries, most acute in Indonesia, the Philippines, and Vietnam | Short term (≤ 2 years) |
| Source: Mordor Intelligence | |||
Chronic Container and Chassis Equipment Imbalance Within ASEAN Hinterlands
Brokers absorb USD 300-550 per move in repositioning fees when boxes pile up in export-heavy zones such as Central Vietnam and outlying Indonesian islands. Empty-mile ratios still hover near 50% on return legs, throttling asset utilization. Refrigerated and out-of-gauge equipment lead-time now stretches to a week in peak months, delaying LCL consolidations. Indonesia’s geography compounds the deficit because chassis stranded on smaller islands rarely cycle back efficiently. Without policy interventions or pooling platforms, equipment scarcity will keep trimming margins.
Enduring Port Congestion at Secondary Gateways and Inland Connectivity Gaps
Turnaround times at Indonesia’s Tanjung Priok and the Philippines’ Manila docks still exceed 72 to 96 hours on average, eroding schedule reliability promises. Inland depots lack rail links, so containers queue behind road bottlenecks that add unpredictable dwell. Brokers routing through these gateways pad transit buffers, inflating costs and dulling premium-service appeal. Planned dredging and terminal automation are underway, but will not relieve pressure before 2027. Persistent congestion undermines the value proposition of guaranteed-delivery products.[3]Ministry of Transportation of the Republic of Indonesia, “Evaluation of Dwelling Time and Port Infrastructure Capacity,” dephub.go.id
*Our forecasts treat driver/restraint impacts as directional, not additive. The impact forecasts reflect baseline growth, mix effects, and variable interactions.
Segment Analysis
By Service: LTL Consolidation Unlocks Near-Shore Agility
Full-truckload (FTL) transport held 61.00% of the overall 2025 revenue, reflecting its grip on bulk manufacturing lanes. Yet, less-than-truckload (LTL) is advancing at a 12.20% CAGR because China + 1 strategies splinter orders across multiple ASEAN plants. Digital consolidators now sweep partial pallets from Vietnam, Malaysia, and Thailand into single containers for U.S. sailings, shrinking landed costs by up to 35%. Predictive cube-planning and automated documentation prevent the margin erosion that once plagued LCL brokerage. FTL remains indispensable for heavy industry, but its share edges lower as just-in-time inventory models favor frequent, smaller moves.
Growth potential also lies in specialized add-ons. Temperature-controlled LTL lanes bundle GDP-compliant handling with blockchain lot tracking for vaccines, commanding premium rates. Same-day cross-border micro-LTL projects between Johor and Singapore target e-commerce replenishment cycles that cannot wait for full loads. Brokers equipped with dynamic routing engines stitch these opportunities into scheduled networks that run at 85-90% utilization even in off-peak weeks. The result is a resilient revenue mix less exposed to cyclical bulk-cargo swings.


By Equipment Type: Cold-Chain Capacity Redefines Value
Dry vans dominated at 48.94% share in 2025, but refrigerated vans registered a brisk 13.52% CAGR through 2031 as vaccine distribution and fresh-food exports multiply. Pharma clusters in Bangkok and Ho Chi Minh City now specify end-to-end temperature logs in tenders, obliging brokers to prove sensor integrity and driver compliance. IoT-enabled reefers transmit real-time alerts that cut spoilage claims below 0.5%, winning repeat orders from global drug makers. Dry-van demand endures for electronics and textiles, yet margins compress when spot capacity swings flood the market with extra trucks.
Flatbed and step-deck trailers ride infrastructure spending on highways and wind-farm components, while tankers support regional chemical flows. Still, the real battleground is data visibility. Brokers embedding lane-level temperature variance into rate formulas justify premiums over commodity forwarders who merely procure capacity. As investors chase ESG-aligned assets, fleets with electric refrigeration units and solar-powered monitoring draw lower financing costs, reinforcing the growth loop in cold-chain brokerage.
By Haul Length: Urban Density Spurs Short-Range Volume
Long-haul lanes still held 42.58% share in 2025, yet local moves under 100 miles grow the fastest at 13.77% CAGR as mega-cities densify. Same-day delivery windows across Jakarta, Manila, and Bangkok force brokers to micro-plan dozens of hand-offs, leveraging algorithmic route optimization to dodge congestion fines. Regional hauls between 100-500 miles feed inland depots that buffer inventory for e-commerce peaks. Infrastructure upgrades, such as Malaysia’s Perlis Inland Port opening in late 2026, create fresh drayage demand around rail hubs.
Urban growth also drives equipment innovation. Small electric trucks equipped with swap-and-go battery stations now handle the “final 50 miles” of hybrid routes, lowering emissions footprints integral to ESG scorecards. Brokers who master multi-stop planning and dwell-time negotiation with building managers secure sticky contracts in retail and food service. Those fixated on trunk-line pricing alone risk commoditization as high-frequency urban lanes carry bigger margin potential.
By Business Model: Algorithm-Driven Platforms Reshape Competitive Dynamics
Traditional brokers controlled 51.88% of the ASEAN freight brokerage services market share in 2025, but digital-first platforms are eroding that lead as they post a 24.33% CAGR to 2031. Shippers increasingly value real-time rate discovery and automated tendering that shrink quote cycles from 24-48 hours to less than two, prompting large enterprises to blend contract lanes with platform-based spot buying. Haulio’s container-trucking marketplace illustrates the shift; it orchestrates a network of over 10,000 trucks across Singapore, Thailand, and Indonesia by algorithmically matching capacity, cutting empty runs, and winning SME customers that once relied on phone calls for bookings.
Competitive lines are blurring as legacy brokers pour capital into cloud TMS upgrades, API connectivity, and AI modules, yet change management and higher fixed costs leave them trailing asset-light newcomers on price. Hybrid models are emerging in the ASEAN freight brokerage services market, where human account managers handle exception-laden cross-border moves while software automates repetitive dispatch and invoicing. As regulatory clarity on digital licensing inches forward, the winners will likely be those that marry platform scalability with the relationship depth required for complex, temperature-controlled or hazardous shipments.
By End-User Industry: E-Commerce Volume Reshapes Priorities
Manufacturing & automotive accounted for 34.10% of 2025 revenue, yet e-commerce and 3PL fulfillment outpace all peers with an 18.02% CAGR. Parcel fragmentation forces brokers to orchestrate high-velocity cross-docks rather than single-drop factory loads. Inventory decentralization means a single order may pull items from three warehouses across two countries, raising the premium on network orchestration skills. Automotive shipments keep brokers busy on Thailand-Malaysia electrified corridors, but production normalization tempers growth to mid-single digits.
Healthcare & pharmaceuticals enjoy double-digit expansion as aging populations lift medical device and biologics output. Oil, gas, mining & chemicals remain steady volume anchors, though carbon-pricing debates nudge clients toward intermodal rail. The common shift is visibility; every vertical now demands SKU-level tracking and proactive exception alerts. Brokers unable to integrate EDI feeds or provide API hooks risk becoming subcontractors rather than strategic partners.[4]Secretariat of the Association of Southeast Asian Nations (ASEAN), “ASEAN Investment Report: EV Supply Chains and E-Commerce Logistics,” asean.org
By Customer Size: Digital Access Levels the Playing Field
Large enterprises exceeding USD 100 million claimed 53.98% share in 2025, yet the fastest-growing cohort of firms under USD 10 million posts a 15.51% CAGR to 2031. Much of this surge comes from self-service portals that drop minimum-volume thresholds and deliver instant quotes at any hour. Freight-matching bots inside these tools route SME freight into consolidated lanes, cutting per-unit costs and winning loyalty from shippers that once relied on informal agents. Enterprises still anchor the contract business with multi-year tenders, but even they now funnel non-core lanes through auction dashboards for speed and transparency. As digital literacy rises, customer size becomes a weaker predictor of service model because all tiers expect live status feeds, embedded trade-finance options, and carbon-score reporting.
Credit access and payment terms illustrate the divergence. Platforms use AI-driven risk scoring to extend 30-day financing to micro-exporters that banks classify as high risk, widening the total addressable customer pool. At the other extreme, global manufacturers integrate APIs that push freight events straight into ERP systems, shrinking manual reconciliations by 70%. The common thread is data; brokers that mine shipment histories for predictive insights retain clients across the size spectrum. Those that cling to phone-based coordination see share slip as procurement teams benchmark response times in minutes, not days. As the ASEAN freight brokerage services market matures, service differentiation hinges on analytics depth rather than head-count scale.
Geography Analysis
Vietnam’s share rises fastest as suppliers chasing resilience relocate circuit-board and apparel lines south of China. Cold-storage investment along the Hai Phong–Hanoi–Lang Son axis feeds demand for GDP-certified reefer brokerage, while customs integration under the expanded ASEAN Single Window (ASW Plus) cuts clearance buffers from days to hours. Yet tight yard space at Hai Phong and a scarcity of 40-foot high-cubes create scheduling headaches that reward brokers with pooled-equipment agreements.
Indonesia retains the region’s largest volume base, propelled by consumer demand from more than 270 million residents and a manufacturing pivot toward EV battery materials. Still, archipelagic fragmentation forces onward barge, or coastal feeder legs that inflate landed costs. Government-backed port upgrades and a growing cabotage fleet are designed to lower this penalty by 2028, but until then, brokers bundle currency-risk cushions into quotes to protect wafer-thin margins.
Thailand, Malaysia, and Singapore round out the mature triad. Thailand’s Eastern Economic Corridor pushes rail-truck intermodal services, while Malaysia’s East Coast Rail Link promises fresh drayage volume once operational. Singapore’s finance ecosystem channels ESG-linked capital that subsidizes fleet renewal, letting brokers offer carbon-neutral contracts attractive to multinational tech firms. The Philippines, Myanmar, and lower-Mekong states remain frontier plays; risk-tolerant brokers that master bilingual paperwork and informal cargo-insurance practices gain a foothold ahead of hard-infrastructure catch-up.
Competitive Landscape
First-mover digital platforms such as Haulio and Deliveree deploy auction engines and predictive load-matching that undercut manual brokers on speed and cost, igniting a race to integrate AI modules across the board. Traditional giants, such as Kerry Logistics, DHL, and Yusen, respond with cloud transportation-management upgrades and minority stakes in regional tech start-ups to avoid channel conflict while importing innovation. Mid-tier family-run forwarders band together in buying cooperatives to access discounted API suites, extending competitive viability in niche cross-border lanes.
Strategic differentiation pivots on data ownership. Players aggregating carrier telematics feed high-resolution ETA estimates into shipper dashboards, unlocking premium pricing for exception-free delivery. ESG compliance becomes the next battleground; brokers that embed certified carbon calculators win long-term contracts from electronics majors needing verifiable Scope 3 disclosures. Conversely, operators tied to sub-scale legacy assets face squeeze pressure as dynamic-spot algorithms expose true market rates in minutes.
Consolidation accelerates via M&A, exemplified by AGS securing a 15% stake in KGW Logistics in early 2025 to dominate Transpacific ocean freight and integrate it with North American last-mile networks. Venture capital funnels into visibility-platform entrants that promise 48-hour pay-outs to small carriers, improving driver loyalty and lane density. Regulators still weigh digital-license frameworks, but tentative guidelines in Indonesia and Vietnam suggest a pathway that favors capitalized entities over thin-margin solo shops. The competitive chessboard, therefore, tilts toward hybrid brokers able to blend relationship capital with algorithmic precision.
ASEAN Freight Brokerage Services Industry Leaders
DHL Group
Kuehne + Nagel
Kerry Logistics Network
CEVA Logistics
C.H. Robinson
- *Disclaimer: Major Players sorted in no particular order

Recent Industry Developments
- March 2026: Nippon Express Holdings (NX Group) executed major structural consolidations to strengthen its ASEAN brokerage network. The group formally integrated its various business entities in Indonesia to provide seamless, unified air and ocean freight forwarding operations. Concurrently, NX Logistics Thailand upgraded its operational systems at its Don Mueang Airport facility to expand high-speed consolidations for urgent regional shipments.
- April 2025: Meratus Group launched a strategic technology partnership to pilot comprehensive sustainable logistics solutions. The development included deploying electric vehicles (EVs) for critical port-to-warehouse drayage transport and integrating biofuels into its inter-island shipping fleet to combat high localized emissions.
- March 2025: Global Logistics launched an exclusive chartered air cargo service connecting Fuzhou, China, directly to Jakarta, Indonesia. This new routing development was specifically engineered to facilitate the transport of highly regulated lithium batteries, allowing the company to capture specialized freight forwarding demand driven by Southeast Asia’s booming electric vehicle (EV) manufacturing sector.
- February 2025: Yusen Logistics signed an agreement with Ocean Network Express (ONE). This collaboration allows Yusen to secure and utilize biofuel-powered ocean freight, directly addressing the growing demand from multinational shippers looking to reduce Scope 3 greenhouse gas emissions across Southeast Asian trade corridors.


ASEAN Freight Brokerage Services Market Report Scope
| Full-Truckload (FTL) |
| Less-than-Truckload (LTL) |
| Others |
| Dry Van |
| Refrigerated Van |
| Flatbed / Step-Deck |
| Tanker (Bulk Liquid and Chemical) |
| Others |
| Long-Haul (More than 500 miles) |
| Regional (100-500 miles) |
| Local (Less than 100 miles) |
| Traditional Freight Brokerage |
| Asset-Based Freight Brokerage |
| Agent Model Freight Brokerage |
| Digital Freight Brokerage |
| Manufacturing and Automotive |
| Construction and Infrastructure Projects |
| Oil, Gas, Mining and Chemicals |
| Agriculture and Food / Beverage |
| Retail, FMCG and Wholesale Distribution |
| Healthcare and Pharmaceuticals |
| E-commerce and 3PL Fulfilment |
| Other End-User Industry |
| Large Enterprise Shippers (More than USD 100 M) |
| Mid-Market Shippers (USD 10-100 M) |
| Small Businesses (Less than USD 10 M) |
| Indonesia |
| Vietnam |
| Thailand |
| Malaysia |
| Philippines |
| Singapore |
| Myanmar |
| Cambodia |
| Laos |
| Brunei |
| By Service | Full-Truckload (FTL) |
| Less-than-Truckload (LTL) | |
| Others | |
| By Equipment / Trailer Type | Dry Van |
| Refrigerated Van | |
| Flatbed / Step-Deck | |
| Tanker (Bulk Liquid and Chemical) | |
| Others | |
| By Haul Length | Long-Haul (More than 500 miles) |
| Regional (100-500 miles) | |
| Local (Less than 100 miles) | |
| By Business Model | Traditional Freight Brokerage |
| Asset-Based Freight Brokerage | |
| Agent Model Freight Brokerage | |
| Digital Freight Brokerage | |
| By End-User Industry | Manufacturing and Automotive |
| Construction and Infrastructure Projects | |
| Oil, Gas, Mining and Chemicals | |
| Agriculture and Food / Beverage | |
| Retail, FMCG and Wholesale Distribution | |
| Healthcare and Pharmaceuticals | |
| E-commerce and 3PL Fulfilment | |
| Other End-User Industry | |
| By Customer Size | Large Enterprise Shippers (More than USD 100 M) |
| Mid-Market Shippers (USD 10-100 M) | |
| Small Businesses (Less than USD 10 M) | |
| By Country | Indonesia |
| Vietnam | |
| Thailand | |
| Malaysia | |
| Philippines | |
| Singapore | |
| Myanmar | |
| Cambodia | |
| Laos | |
| Brunei |


Key Questions Answered in the Report
What is the forecast CAGR for ASEAN freight brokerage services through 2031?
The ASEAN Freight Brokerage Services Market is projected to expand at a 9.68% CAGR between 2026-2031, lifting revenue from USD 3.94 billion in 2026 to USD 6.25 billion by 2031.
Which geography is expanding the fastest and what drives this momentum?
Vietnam shows the highest growth at a 10.27% CAGR, powered by semiconductor plant relocations, near-shoring LCL flows, and lower marine-insurance premiums at Cai Mep.
How are digital freight platforms reshaping procurement practices?
Vietnam is set to deliver the highest incremental gains with a 10.5% CAGR as electronics and e-commerce volumes surge.
How are digital platforms reshaping broker competition?
Algorithm-driven portals cut quote cycles from up to two days to under two hours and lower empty-mile ratios 12-18%, letting shippers secure capacity and price transparency in near real time.
Where can brokers earn the highest margins in the next five years?
Temperature-controlled lanes linked to expanding pharma hubs in Thailand and Vietnam offer premium pricing because clients pay for GDP-compliant equipment and live temperature logs.
What operational challenges most threaten profitability?
Chronic container shortages in hinterlands, currency volatility that trims 80-120 basis points from margins, and port congestion at gateways like Tanjung Priok remain the biggest cost headwinds.
How critical is ESG compliance in winning new contracts?
Increasingly essential banks discount freight-linked loans for low-emission fleets and multinationals pay 8-15% premiums for verifiable Scope 3 carbon data, giving ESG-ready brokers a competitive edge.
Page last updated on:


