Market Overview
| Study Period | 2018 - 2031 |
|---|---|
| Forecast Data Period | 2026 - 2031 |
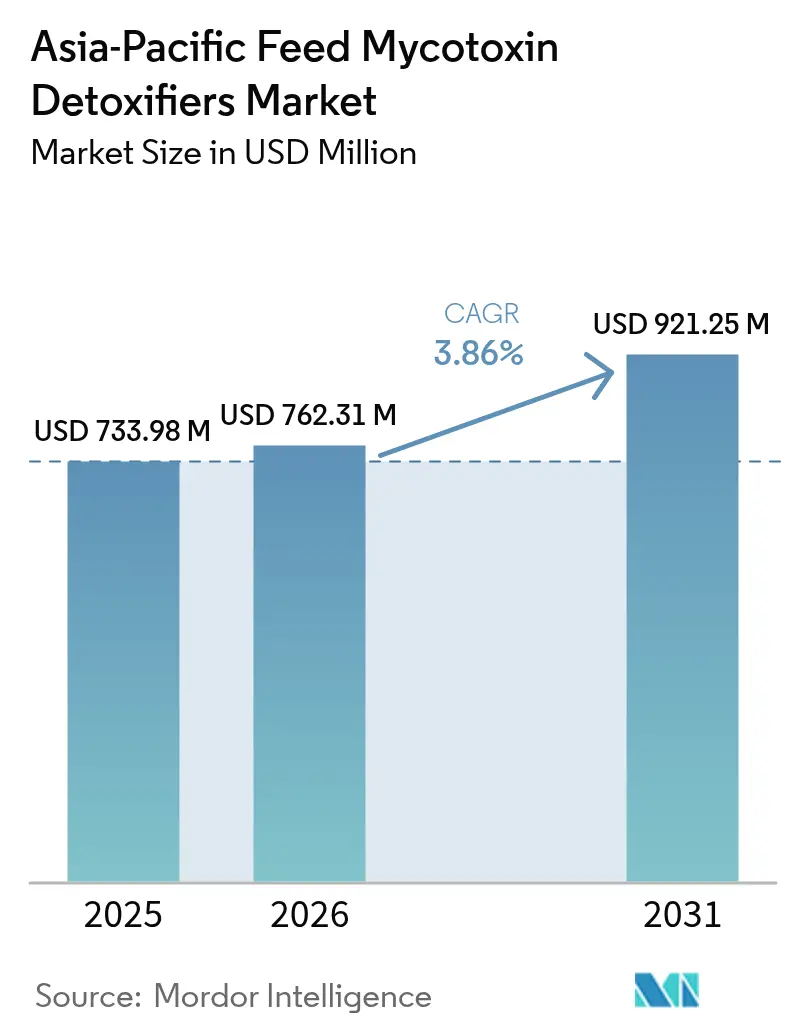
| Base Year Market Size (2025) | USD 733.98 Million |
| Market Size (2026) | USD 762.31 Million |
| Market Size (2031) | USD 921.25 Million |
| Growth Rate (2026 - 2031) | 3.86% CAGR |
| Market Concentration | Low |
Major Players *Disclaimer: Major Players sorted in no particular order Image © Mordor Intelligence. Reuse requires attribution under CC BY 4.0. | |
Asia-Pacific Feed Mycotoxin Detoxifiers Market Analysis by Mordor Intelligence
Asia-Pacific feed mycotoxin detoxifiers market size in 2026 is estimated at USD 762.31 million, growing from 2025 value of USD 733.98 million with 2031 projections showing USD 921.25 million, growing at 3.86% CAGR over 2026-2031. Rising humidity-linked contamination, tighter regulatory limits, and the shift toward large-scale commercial livestock operations continue to pull demand upward. China’s lower aflatoxin threshold of 10 ppb for poultry feed, India’s stricter import registration rules, and Japan’s enhanced port inspections collectively heighten compliance pressure that favors premium detoxification solutions. Technology advances such as blockchain traceability and cold-plasma grain treatment complement the core adoption drivers rather than replacing chemical or biological additives in the near term. Smallholder price sensitivity and mixed efficacy under multi-mycotoxin loads remain the primary growth constraints
Key Report Takeaways
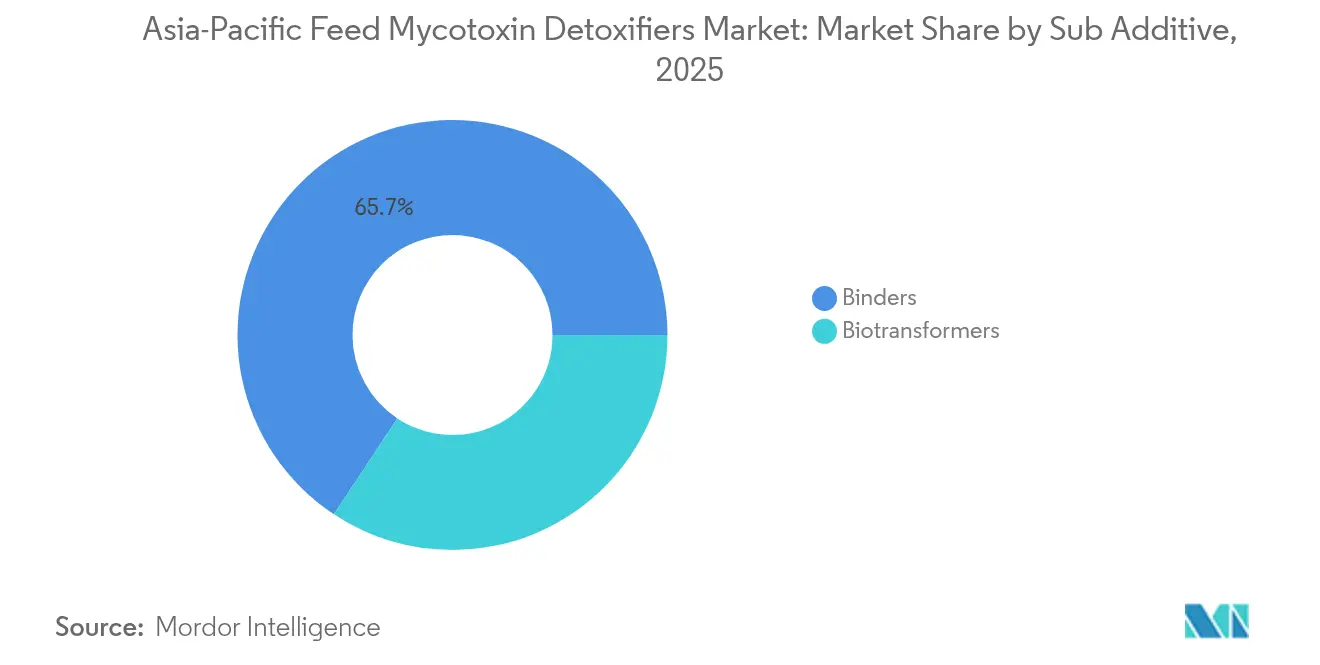
- By sub additive, binders led with 65.70% of the Asia-Pacific feed mycotoxin detoxifiers market share in 2025, while biotransformers recorded the fastest 3.97% CAGR to 2031.
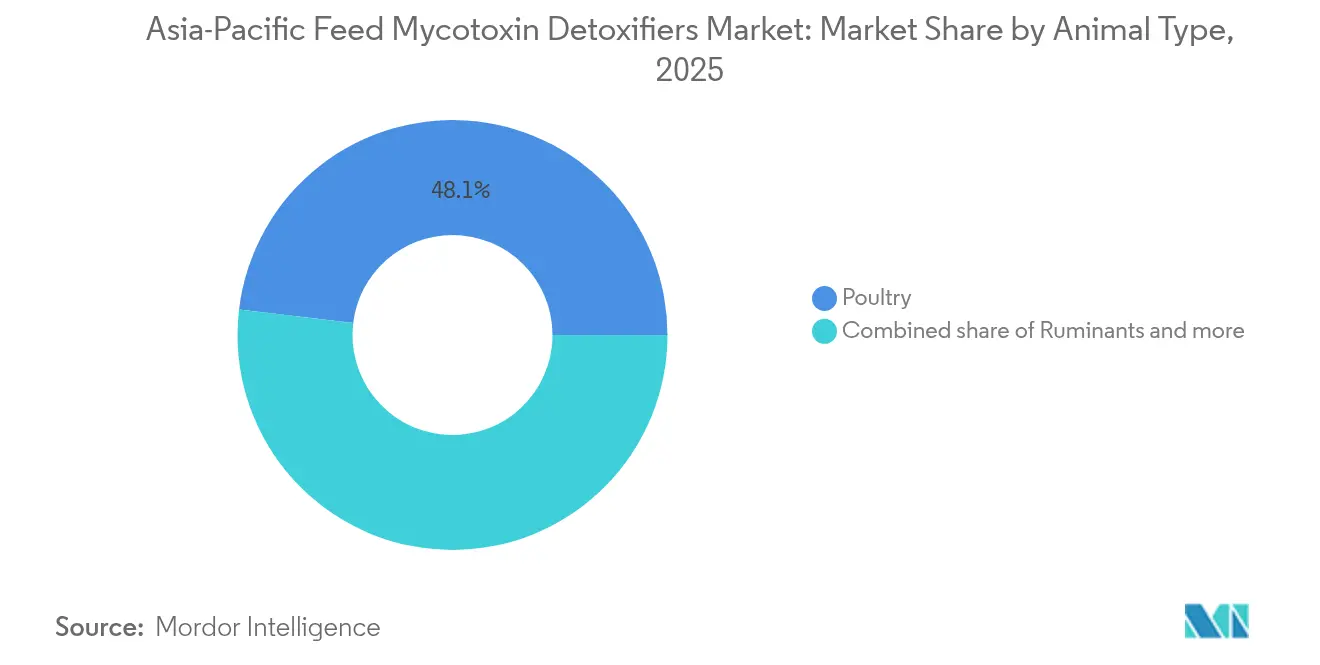
- By animal, poultry captured 48.10% revenue share in 2025 and is projected to expand at a 4.41% CAGR through 2031.
- By geography, China held a 43.85% share of the Asia-Pacific feed mycotoxin detoxifiers market size in 2025, whereas India is advancing at a 4.48% CAGR through 2031.
Note: Market size and forecast figures in this report are generated using Mordor Intelligence’s proprietary estimation framework, updated with the latest available data and insights as of 2026.
Asia-Pacific Feed Mycotoxin Detoxifiers Market Trends and Insights
Drivers Impact Analysis*
| Driver | (~) % Impact on CAGR Forecast | Geographic Relevance | Impact Timeline |
|---|---|---|---|
| Rising incidence of mycotoxin contamination | +1.8% | Asia-Pacific core, with the highest impact in Southeast Asia | Medium term (2-4 years) |
| Enforcement of stricter regional regulatory limits | +1.5% | China, India, and Japan, with spillover to the Asian | Short term (≤ 2 years) |
| Expansion of commercial poultry and aquaculture | +1.2% | China, India, Vietnam, Thailand | Long term (≥ 4 years) |
| Antibiotic-free feed reformulations | +1.0% | Global, with early adoption in developed Asia-Pacific markets | Medium term (2-4 years) |
| Blockchain-based grain traceability adoption | +0.8% | China, Japan, South Korea, with gradual Asia-Pacific uptake | Long term (≥ 4 years) |
| Demand in insect-based protein substrates | +0.5% | Singapore, Australia, with an emerging interest in Thailand | Long term (≥ 4 years) |
| Source: Mordor Intelligence | |||


Rising Incidence of Mycotoxin Contamination
Mycotoxin prevalence in Asia-Pacific feed ingredients has intensified due to climate variability and inadequate post-harvest storage infrastructure, creating a structural demand foundation for detoxification solutions. The region's monsoon patterns and high humidity levels provide optimal conditions for Aspergillus and Fusarium proliferation, with aflatoxin contamination rates in corn exceeding 80% in certain Southeast Asian provinces during peak seasons. This contamination surge coincides with expanding livestock operations that demand consistent feed quality, forcing producers to integrate systematic detoxifier protocols. The economic impact extends beyond immediate animal health concerns, as mycotoxin exposure reduces feed conversion efficiency by 15-25%, directly affecting profitability margins in price-sensitive markets. Regulatory compliance factors amplify this driver, as stricter detection methods reveal previously undetected contamination levels, mandating retroactive detoxifier implementation across existing supply chains.
Enforcement of Stricter Regional Regulatory Limits
Regulatory tightening across major Asia-Pacific economies has created a compliance-driven demand surge for advanced mycotoxin detoxifiers, fundamentally reshaping market dynamics. China's implementation of GB 13078-2023 reduced allowable aflatoxin B1 limits from 50 ppb to 10 ppb for poultry feed, while Japan's Ministry of Agriculture, Forestry and Fisheries introduced enhanced monitoring protocols for imported feed ingredients in 2024. These regulatory shifts force feed manufacturers to adopt multi-layered detoxification strategies, combining traditional binders with enzymatic biotransformers to achieve compliance margins. The enforcement mechanism extends beyond domestic production, with import restrictions creating cascading effects across regional trade flows. FSSAI's (Food Safety and Standards Authority of India) mandatory foreign facility registration requirements have particularly impacted Indian importers, driving domestic detoxifier demand as compliance costs favor local sourcing strategies [1]Source: Food Safety and Standards Authority of India, “Compendium of Food Additives Regulations,” fssai.gov.in.
Enforcement of Stricter Regional Regulatory Limits
The transition from smallholder to commercial-scale livestock operations across Asia-Pacific markets has created unprecedented demand for standardized feed safety protocols, positioning mycotoxin detoxifiers as essential production inputs. China's poultry sector consolidation resulted in average farm sizes increasing from 2,000 to 15,000 birds between 2020-2024, while Vietnam's aquaculture industry expanded commercial shrimp farming operations by 35% during the same period. Commercial operations face amplified mycotoxin exposure risks due to bulk feed procurement and extended storage periods, necessitating systematic detoxifier integration to maintain consistent animal performance. The economic rationale strengthens as larger operations can absorb detoxifier costs more efficiently than smallholders, creating a structural shift toward premium solutions. This commercialization trend accelerates technology adoption, with integrated producers increasingly demanding data-driven detoxification protocols that optimize both efficacy and cost-effectiveness.
Antibiotic-Free Feed Reformulations
The industry-wide transition toward antibiotic-free feed formulations has elevated mycotoxin detoxifiers from optional additives to essential components, as producers seek alternative strategies to maintain animal health and performance. European Union regulations restricting antibiotic growth promoters have influenced Asia-Pacific markets, with major integrators adopting similar standards to maintain export competitiveness. This shift creates particular vulnerability to mycotoxin challenges, as antibiotics previously provided secondary protection against mycotoxin-induced immunosuppression. Feed formulators now integrate detoxifiers as primary defense mechanisms, with enzymatic biotransformers gaining preference for their ability to neutralize multiple mycotoxin classes simultaneously. The economic implications extend beyond direct substitution costs, as antibiotic-free systems require more sophisticated nutritional balancing, making mycotoxin contamination particularly disruptive to production efficiency.
Restraints Impact Analysis*
| Restraint | (~) % Impact on CAGR Forecast | Geographic Relevance | Impact Timeline |
|---|---|---|---|
| High price sensitivity of smallholders | -1.2% | Rural areas across Asia-Pacific, particularly Southeast Asia | Short term (≤ 2 years) |
| Variable efficacy in multi-mycotoxin challenges | -0.8% | Global, with an acute impact in tropical regions | Medium term (2-4 years) |
| Limited Asian enzymatic approvals | -0.6% | Southeast Asian markets | Medium term (2-4 years) |
| Competition from cold-plasma decontamination | -0.4% | Developed Asia-Pacific markets initially | Long term (≥ 4 years) |
| Source: Mordor Intelligence | |||
High Price Sensitivity of Smallholders
Smallholder farmers across Asia-Pacific markets exhibit acute price sensitivity toward mycotoxin detoxifiers, creating a fundamental adoption barrier that constrains market expansion despite regulatory mandates. The cost structure challenge is particularly pronounced in Southeast Asian markets, where average farm sizes remain below 2 hectares and feed represents 60-70% of total production costs. Premium detoxifiers can increase feed costs by 2-5%, a margin that many smallholders cannot absorb without compromising profitability, leading to selective or intermittent usage patterns that reduce overall market penetration [2]Source: Asian Development Bank, “Smallholder Agriculture in Asia-Pacific,” adb.org . This price sensitivity creates a bifurcated market structure, with commercial operations adopting comprehensive detoxification protocols while smallholders rely on basic clay binders or forego treatment entirely. The economic impact extends beyond individual farm decisions, as inconsistent detoxifier usage across supply chains can compromise overall food safety objectives and limit export market access.
Variable Efficacy in Multi-Mycotoxin Challenges
The complexity of multi-mycotoxin contamination scenarios in tropical climates presents significant efficacy challenges for existing detoxification technologies, creating user skepticism that constrains market adoption rates. Field conditions often involve the simultaneous presence of aflatoxins, fumonisins, and trichothecenes, yet most commercial detoxifiers demonstrate optimal performance against single mycotoxin classes, leading to inconsistent results in real-world applications. This efficacy variability is particularly problematic in humid storage environments where multiple fungal species proliferate simultaneously, creating contamination profiles that exceed the neutralization capacity of standard binder formulations. The technical challenge drives demand for more sophisticated solutions, yet also creates market hesitancy as producers struggle to predict performance outcomes. Regulatory compliance factors compound this restraint, as variable efficacy can result in unexpected violations despite detoxifier usage, leading to liability concerns that discourage adoption among risk-averse operators.
*Our forecasts treat driver/restraint impacts as directional, not additive. The impact forecasts reflect baseline growth, mix effects, and variable interactions.
Segment Analysis
By Sub Additive: Binders Dominate Despite Biotransformer Surge
Binders retained 65.70% of the Asia-Pacific feed mycotoxin detoxifiers market share in 2025, fortified by widespread acceptance, low cost, and proven aflatoxin binding capability . Montmorillonite and bentonite remain staples inside smallholder rations where affordability trumps spectrum breadth. The segment's strong market position is primarily attributed to its effectiveness in immobilizing mycotoxins in the gastrointestinal tract of animals, thereby reducing their bioavailability. China represents the largest market for feed binders in the region, followed by India, with these countries showing increased adoption due to their expanding feed production capabilities. The poultry sector, particularly broilers, remains the largest consumer of feed binders, demonstrating the segment's crucial role in maintaining animal health and productivity. The widespread use of binders in monogastric feeds, especially for binding toxic chemicals and mycotoxins in the gastrointestinal tract of animals, has further solidified its market leadership position.
The biotransformers segment is emerging as the fastest-growing category in the Asia-Pacific feed mycotoxin detoxifiers market, projected to grow at approximately 3.97% CAGR through 2031. This growth trajectory is primarily driven by increasing awareness about preventing mycotoxin absorption while preserving nutritional properties in animal feed. The segment's expansion is particularly notable in China, India, and Japan, where agricultural practices are becoming more sophisticated and focused on animal health optimization. Biotransformers are gaining popularity due to their unique ability to biodegrade mycotoxins into less toxic metabolites, offering a more comprehensive solution to mycotoxin contamination challenges. The poultry segment remains the largest consumer of biotransformers, followed closely by the swine segment, indicating the growing recognition of biotransformers' effectiveness across multiple livestock categories.


Poultry segment leads growth in Asia-Pacific feed mycotoxin detoxifiers market
The poultry segment's commanding 48.10% market share in 2025 reflects intensive farming's acute vulnerability to mycotoxin exposure, and is projected to grow at a 4.41% CAGR through 2031, positioning it as the fastest-growing application driving market expansion. Poultry operations face particular mycotoxin sensitivity due to high feed conversion rates and dense housing conditions that amplify contamination impacts, necessitating comprehensive detoxification protocols to maintain production efficiency. Broiler operations dominate within the poultry segment, consuming approximately 60% of poultry-specific detoxifiers, while layer operations require specialized formulations that address both performance and egg quality concerns. The segment's maturity creates opportunities for premium solutions that optimize both safety and performance parameters.
Ruminants show steady interest in organic acid-layered binders that avoid rumen disruption, whereas swine adoption fluctuates with African swine fever-induced herd rebuilding. The Asia-Pacific feed mycotoxin detoxifiers market size attached to specialty pets and other minor species remains limited but grows steadily as hobby farming expands in developed economies.
Geography Analysis
China's market leadership with 43.85% share in 2025 stems from the country's massive feed production capacity and stringent regulatory enforcement, while the implementation of GB 13078-2023 standards has accelerated the adoption of advanced detoxification technologies across commercial operations. The country's integrated livestock sector, dominated by large-scale poultry and swine operations, creates consistent demand for premium detoxifiers that ensure regulatory compliance while maintaining production efficiency. State-owned enterprises and major integrators increasingly favor enzymatic solutions that provide comprehensive mycotoxin neutralization, driving segment premiumization despite cost pressures. China's domestic biotechnology sector has emerged as a significant innovation driver, with companies developing region-specific formulations targeting local mycotoxin profiles and storage conditions.
India represents the fastest-growing geography with 4.48% CAGR through 2031, propelled by rapid aquaculture expansion and FSSAI's (Food Safety and Standards Authority of India) enhanced regulatory framework that mandates foreign facility registration for feed ingredient importers. The country's diverse agricultural landscape creates complex mycotoxin challenges, with aflatoxin contamination particularly severe in groundnut-producing regions that supply protein meal for feed applications. Commercial poultry operations in southern states drive the majority of detoxifier demand, while emerging aquaculture clusters in coastal regions increasingly adopt systematic detoxification protocols. The market structure remains fragmented, with numerous regional players competing alongside multinational corporations, creating opportunities for specialized solutions targeting local contamination patterns.
Japan and South Korea maintain sophisticated markets characterized by premium product adoption and advanced regulatory frameworks that favor innovative detoxification technologies. Japanese feed manufacturers increasingly integrate biotransformers into standard formulations, driven by consumer demand for residue-free animal products and export market requirements. South Korea's emphasis on technological innovation has fostered development of novel enzymatic solutions, with several domestic companies achieving international recognition for specialized mycotoxin degradation enzymes.
Competitive Landscape
The Asia-Pacific feed mycotoxin detoxifiers market exhibits a fragmented structure. Market players like Cargill, DSM, and others are creating a competitive environment where established multinationals leverage regulatory expertise while specialized biotechnology firms capture innovation-driven niches in the market.
Market leaders, including Cargill, DSM, and BASF, maintain competitive advantages through comprehensive product portfolios spanning traditional binders to advanced enzymatic solutions, enabling them to serve diverse customer segments from price-sensitive smallholders to premium commercial operations. The competitive intensity has increased as regulatory tightening across major markets elevates technical requirements, favoring companies with robust R&D capabilities and regulatory compliance infrastructure.
Technology deployment strategies increasingly focus on precision agriculture applications, where IoT-enabled monitoring systems integrate with targeted detoxifier application protocols to optimize both efficacy and cost-effectiveness. The competitive landscape reflects broader agricultural technology trends, where data-driven solutions and biological innovations command premium valuations despite higher development costs, positioning the market for continued consolidation around companies that successfully integrate traditional manufacturing capabilities with cutting-edge biotechnology platforms.
Asia-Pacific Feed Mycotoxin Detoxifiers Industry Leaders
DSM Nutritional Products AG
Cargill Inc.
Adisseo
BASF SE
Land O' Lakes
- *Disclaimer: Major Players sorted in no particular order


Recent Industry Developments
- January 2025: DSM-Firmenich plans to open a new feed additives production facility in India, focusing on mycotoxin binders. The company is also evaluating Sri Lanka as a potential future manufacturing site. The India facility will primarily serve India, Bangladesh, Sri Lanka, and Nepal, complementing the company's existing plants in Singapore and China. The local manufacturing capability aims to provide improved pricing and service for regional customers.
- November 2021: Kemin Industries introduced Toxfin Care, a solution that protects feed from mycotoxins. It strengthens the immune system, protects organs, and prevents loss of performance and productivity.


Asia-Pacific Feed Mycotoxin Detoxifiers Market Report Scope
Binders, Biotransformers are covered as segments by Sub Additive. Aquaculture, Poultry, Ruminants, Swine are covered as segments by Animal. Australia, China, India, Indonesia, Japan, Philippines, South Korea, Thailand, Vietnam are covered as segments by Country.Sub Additive
| Binders |
| Biotransformers |
By Animal
| Aquaculture | By Sub Animal | Fish |
| Shrimp | ||
| Other Aquaculture Species | ||
| Poultry | By Sub Animal | Broiler |
| Layer | ||
| Other Poultry Birds | ||
| Ruminants | By Sub Animal | Beef Cattle |
| Dairy Cattle | ||
| Other Ruminants | ||
| Swine | ||
| Other Animals | ||
| Geography | Australia | |
| China | ||
| India | ||
| Indonesia | ||
| Japan | ||
| Philippines | ||
| South Korea | ||
| Thailand | ||
| Vietnam | ||
| Rest of Asia-Pacific |
| Sub Additive | Binders | ||
| Biotransformers | |||
| By Animal | Aquaculture | By Sub Animal | Fish |
| Shrimp | |||
| Other Aquaculture Species | |||
| Poultry | By Sub Animal | Broiler | |
| Layer | |||
| Other Poultry Birds | |||
| Ruminants | By Sub Animal | Beef Cattle | |
| Dairy Cattle | |||
| Other Ruminants | |||
| Swine | |||
| Other Animals | |||
| Geography | Australia | ||
| China | |||
| India | |||
| Indonesia | |||
| Japan | |||
| Philippines | |||
| South Korea | |||
| Thailand | |||
| Vietnam | |||
| Rest of Asia-Pacific | |||


Market Definition
- FUNCTIONS - For the study, feed additives are considered to be commercially manufactured products that are used to enhance characteristics such as weight gain, feed conversion ratio, and feed intake when fed in appropriate proportions.
- RESELLERS - Companies engaged in reselling feed additives without value addition have been excluded from the market scope, to avoid double counting.
- END CONSUMERS - Compound feed manufacturers are considered to be end-consumers in the market studied. The scope excludes farmers buying feed additives to be used directly as supplements or premixes.
- INTERNAL COMPANY CONSUMPTION - Companies engaged in the production of compound feed as well as the manufacturing of feed additives are part of the study. However, while estimating the market sizes, the internal consumption of feed additives by such companies has been excluded.
| Keyword | Definition |
|---|---|
| Feed additives | Feed additives are products used in animal nutrition for purposes of improving the quality of feed and the quality of food from animal origin, or to improve the animals’ performance and health. |
| Probiotics | Probiotics are microorganisms introduced into the body for their beneficial qualities. (It maintains or restores beneficial bacteria to the gut). |
| Antibiotics | Antibiotic is a drug that is specifically used to inhibit the growth of bacteria. |
| Prebiotics | A non-digestible food ingredient that promotes the growth of beneficial microorganisms in the intestines. |
| Antioxidants | Antioxidants are compounds that inhibit oxidation, a chemical reaction that produces free radicals. |
| Phytogenics | Phytogenics are a group of natural and non-antibiotic growth promoters derived from herbs, spices, essential oils, and oleoresins. |
| Vitamins | Vitamins are organic compounds, which are required for normal growth and maintenance of the body. |
| Metabolism | A chemical process that occurs within a living organism in order to maintain life. |
| Amino acids | Amino acids are the building blocks of proteins and play an important role in metabolic pathways. |
| Enzymes | Enzyme is a substance that acts as a catalyst to bring about a specific biochemical reaction. |
| Anti-microbial resistance | The ability of a microorganism to resist the effects of an antimicrobial agent. |
| Anti-microbial | Destroying or inhibiting the growth of microorganisms. |
| Osmotic balance | It is a process of maintaining salt and water balance across membranes within the body's fluids. |
| Bacteriocin | Bacteriocins are the toxins produced by bacteria to inhibit the growth of similar or closely related bacterial strains. |
| Biohydrogenation | It is a process that occurs in the rumen of an animal in which bacteria convert unsaturated fatty acids (USFA) to saturated fatty acids (SFA). |
| Oxidative rancidity | It is a reaction of fatty acids with oxygen, which generally causes unpleasant odors in animals. To prevent these, antioxidants were added. |
| Mycotoxicosis | Any condition or disease caused by fungal toxins, mainly due to contamination of animal feed with mycotoxins. |
| Mycotoxins | Mycotoxins are toxin compounds that are naturally produced by certain types of molds (fungi). |
| Feed Probiotics | Microbial feed supplements positively affect gastrointestinal microbial balance. |
| Probiotic yeast | Feed yeast (single-cell fungi) and other fungi used as probiotics. |
| Feed enzymes | They are used to supplement digestive enzymes in an animal’s stomach to break down food. Enzymes also ensure that meat and egg production is improved. |
| Mycotoxin detoxifiers | They are used to prevent fungal growth and to stop any harmful mold from being absorbed in the gut and blood. |
| Feed antibiotics | They are used both for the prevention and treatment of diseases but also for rapid growth and development. |
| Feed antioxidants | They are used to protect the deterioration of other feed nutrients in the feed such as fats, vitamins, pigments, and flavoring agents, thus providing nutrient security to the animals. |
| Feed phytogenics | Phytogenics are natural substances, added to livestock feed to promote growth, aid in digestion, and act as anti-microbial agents. |
| Feed vitamins | They are used to maintain the normal physiological function and normal growth and development of animals. |
| Feed flavors and sweetners | These flavors and sweeteners help to mask tastes and odors during changes in additives or medications and make them ideal for animal diets undergoing transition. |
| Feed acidifiers | Animal feed acidifiers are organic acids incorporated into the feed for nutritional or preservative purposes. Acidifiers enhance congestion and microbiological balance in the alimentary and digestive tracts of livestock. |
| Feed minerals | Feed minerals play an important role in the regular dietary requirements of animal feed. |
| Feed binders | Feed binders are the binding agents used in the manufacture of safe animal feed products. It enhances the taste of food and prolongs the storage period of the feed. |
| Key Terms | Abbreviation |
| LSDV | Lumpy Skin Disease Virus |
| ASF | African Swine Fever |
| GPA | Growth Promoter Antibiotics |
| NSP | Non-Starch Polysaccharides |
| PUFA | Polyunsaturated Fatty Acid |
| Afs | Aflatoxins |
| AGP | Antibiotic Growth Promoters |
| FAO | The Food And Agriculture Organization of the United Nations |
| USDA | The United States Department of Agriculture |


Research Methodology
Mordor Intelligence follows a four-step methodology in all our reports.
- Step-1: IDENTIFY KEY VARIABLES: In order to build a robust forecasting methodology, the variables and factors identified in Step-1 are tested against available historical market numbers. Through an iterative process, the variables required for market forecast are set and the model is built on the basis of these variables.
- Step-2: Build a Market Model: Market-size estimations for the forecast years are in nominal terms. Inflation is not a part of the pricing, and the average selling price (ASP) is kept constant throughout the forecast period.
- Step-3: Validate and Finalize: In this important step, all market numbers, variables and analyst calls are validated through an extensive network of primary research experts from the market studied. The respondents are selected across levels and functions to generate a holistic picture of the market studied.
- Step-4: Research Outputs: Syndicated Reports, Custom Consulting Assignments, Databases & Subscription Platforms


