Market Overview
| Study Period | 2021 - 2031 |
|---|---|
| Forecast Data Period | 2026 - 2031 |
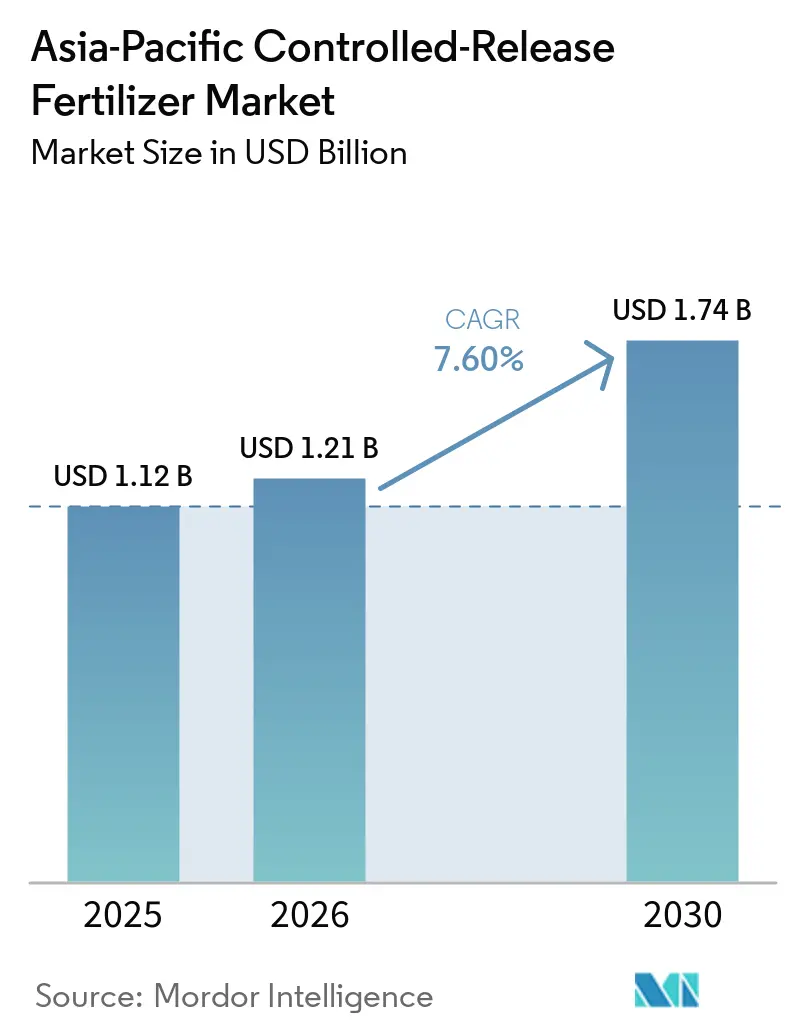
| Base Year Market Size (2025) | USD 1.12 Billion |
| Market Size (2026) | USD 1.21 Billion |
| Market Size (2030) | USD 1.74 Billion |
| Growth Rate (2026 - 2031) | 7.60% CAGR |
| Market Concentration | Medium |
Major Players *Disclaimer: Major Players sorted in no particular order Image © Mordor Intelligence. Reuse requires attribution under CC BY 4.0. | |
Asia-Pacific Controlled-Release Fertilizer Market Analysis by Mordor Intelligence
The Asia-Pacific controlled-release fertilizer market size reached USD 1.12 billion in 2025, is estimated to reach USD 1.21 billion in 2026, and is projected to rise to USD 1.74 billion by 2031, expanding at a 7.60% CAGR during 2026 to 2031. Accelerating adoption of precision agriculture, expanding protected cultivation acreage, and supportive government subsidy programs underpin this steady upswing. Subsidy frameworks in China and India are socializing the high costs of controlled-release technologies, while rising environmental scrutiny is tightening nutrient runoff regulations across coastal and island economies. Parallel breakthroughs in enzyme-embedded and bio-based polyurethane coatings are improving release consistency in humid tropical conditions, widening the addressable acreage for premium formulations. Competitive intensity is moderate, concentration in the top five players commands significant revenue, and they continue to invest heavily in local manufacturing and R&D to protect market share against agile regional entrants.
Key Report Takeaways
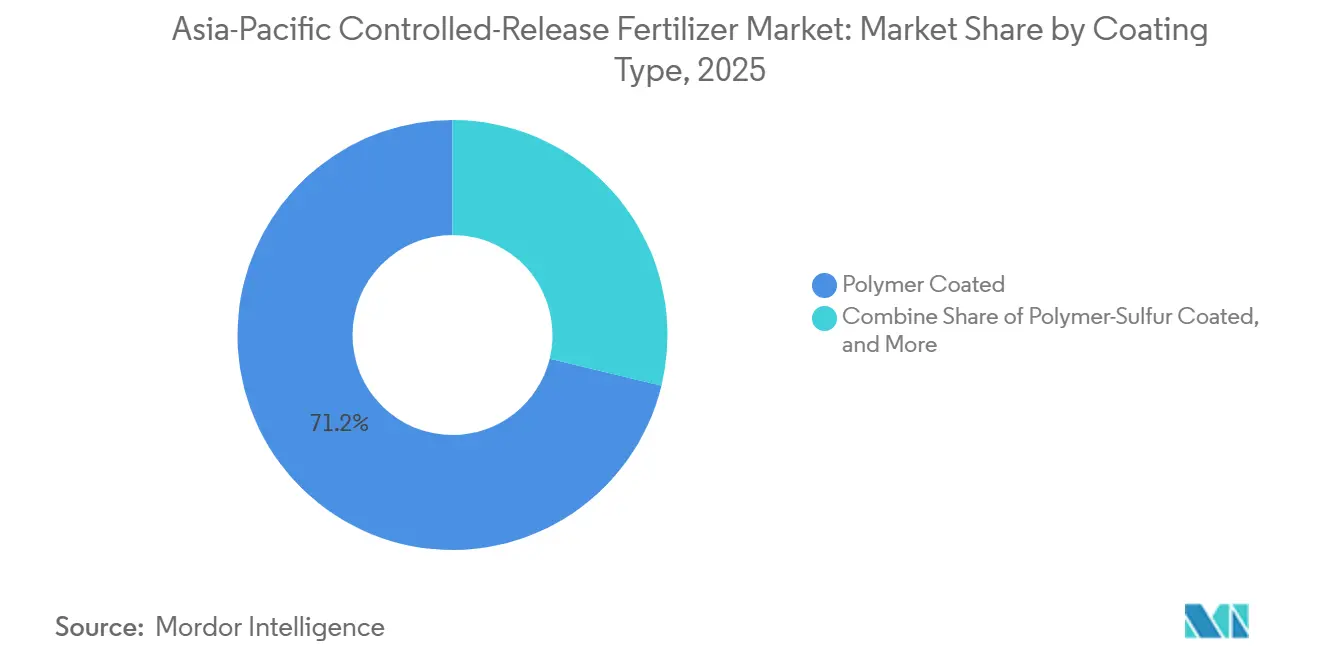
- By coating type, polymer-coated products held the largest Asia-Pacific controlled-release fertilizer market share at 71.2% in 2025, while polymer sulfur-coated products are projected to grow fastest at a 8.9% CAGR through 2031.
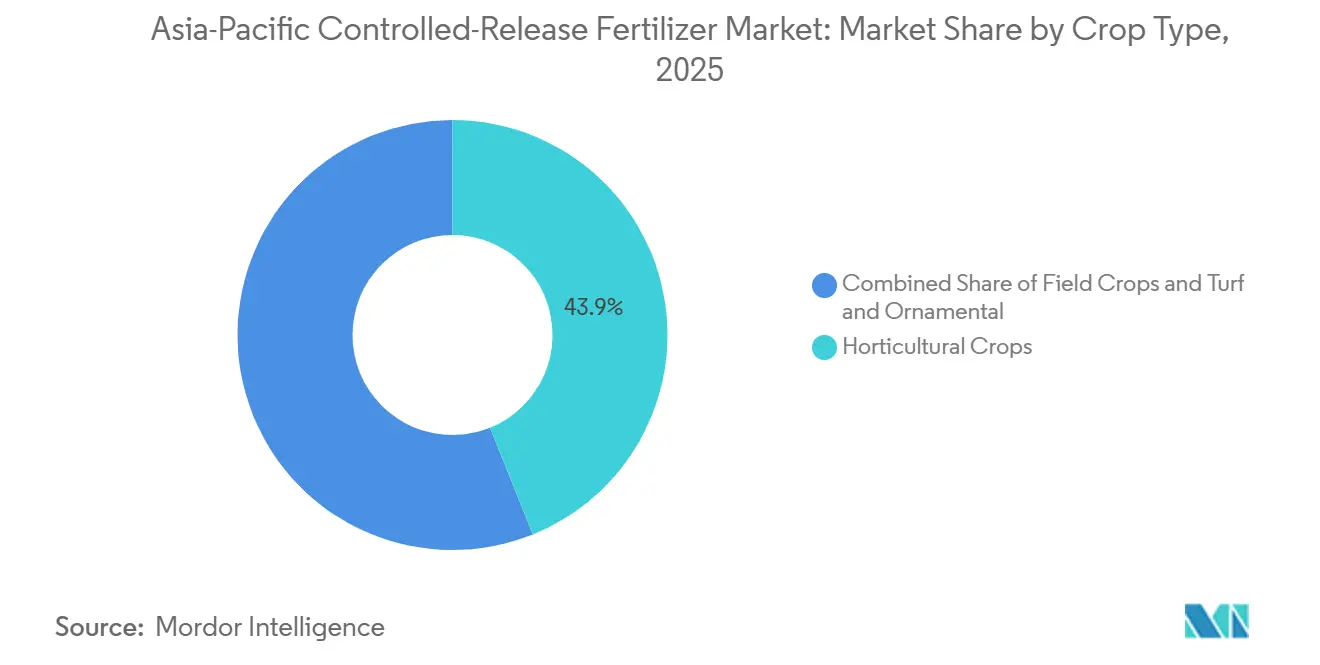
- By crop type, horticultural crops accounted for the largest Asia-Pacific controlled-release fertilizer market size in 2025, contributing 43.9% of total market revenue, whereas field crops are projected to expand the fastest, at a CAGR of 7.9% during 2026–2031.
- By country, China represented the largest share of the Asia-Pacific controlled-release fertilizer market at 47.9% in 2025, while India is poised to be the fastest-growing market, advancing at a CAGR of 9.4% through 2031.
Note: Market size and forecast figures in this report are generated using Mordor Intelligence’s proprietary estimation framework, updated with the latest available data and insights as of January 2026.
Asia-Pacific Controlled-Release Fertilizer Market Trends and Insights
Drivers Impact Analysis*
| Driver | (~) % Impact on CAGR Forecast | Geographic Relevance | Impact Timeline |
|---|---|---|---|
| Surge in government subsidies for eco-efficient fertilizers | +1.8% | China, India, Southeast Asia | Medium term (2-4 years) |
| Rapid expansion of protected cultivation acreage | +1.5% | Australia, Japan, China, and Thailand | Short term (≤2 years) |
| Shift toward precision-fertigation in high-value crops | +1.2% | Australia, Japan, and South Korea | Medium term (2-4 years) |
| Introduction of enzyme-embedded coatings lowers release variability | +0.9% | Southeast Asia and India | Long term (≥4 years) |
| Mandatory nutrient-runoff caps adopted by island economies | +0.7% | The Philippines and Indonesia | Medium term (2-4 years) |
| Emergence of bio-based polyurethane coatings from palm-kernel oil | +0.6% | Indonesia, Malaysia, and Thailand | Long term (≥4 years) |
| Source: Mordor Intelligence | |||


Surge in Government Subsidies for Eco-Efficient Fertilizers
Targeted fiscal support is reshaping fertilizer economics across much of the Asia-Pacific. India’s nutrient-based subsidy scheme now covers controlled-release formulations, lowering farmer switching costs by up to 40% and driving significant sales volume in Uttar Pradesh, Punjab, and Tamil Nadu. China deploys a mix of direct input subsidies and reduced value-added tax on eco-efficient fertilizers, providing twin price and liquidity advantages for growers. Agricultural banks in Indonesia and Vietnam are adding preferential credit lines that specifically earmark funds for controlled-release purchases, signaling sustained public-sector commitment. As a result, manufacturers are expanding capacity closer to demand centers to satisfy subsidy-driven orders, while distributors intensify extension services to capture emerging rural demand.
Rapid Expansion of Protected Cultivation Acreage
Protected cultivation systems are growing rapidly across the Asia-Pacific region, driven by urbanization and the demand for year-round high-value crop production. Australia's greenhouse sector has grown by 15% annually since 2024, with controlled environment agriculture requiring precise nutrient management that favors controlled-release fertilizers over conventional types[1]Source: United Nations Development Programme, “Precision Agriculture for Smallholder Farmers,” undp.org. The growth is significant in hydroponic and aeroponic systems, where nutrient solution management reduces total fertilizer consumption by up to 60% through automated dosing and recycling systems. Thailand's GAP 9001-2021 standards for hydroponic vegetable production require regular water quality monitoring and chemical residue testing, creating a regulatory need for controlled-release technologies that reduce leaching and environmental contamination [2]Source: Ruploet Ponkamon et al., “A Hydroponic Vegetable Business Management Approach in Holistic Good Agricultural Practices in Thailand,” Frontiers in Sustainability, frontiersin.org . This expansion of protected cultivation increases the demand for specialized controlled-release formulations for soilless media, as traditional granular fertilizers cannot provide precise nutrient timing. Consumers' willingness to pay higher prices for greenhouse-grown produce supports the economic viability of advanced nutrient management systems.
Shift Toward Precision-Fertigation in High-Value Crops
The integration of controlled-release fertilizers with precision irrigation systems is transforming nutrient management in high-value crop production across developed Asia-Pacific markets. Variable-rate irrigation systems are integrating fertilizer dosing software that optimizes nutrient release curves. In Heilongjiang Province, a survey reveals that 32% of producers have adopted water-fertilizer integration. They find the capital costs, ranging from 2,000 to 10,000 yuan (USD 280 to 1,400) per mu per hectare, justified by the resulting yield gains and savings on inputs. Cloud-based advisory platforms now incorporate coated fertilizer timing algorithms, enabling real-time adjustments that exploit predictable nutrient release profiles. Japanese strawberry growers using sensor-guided drip lines reported 18% nitrogen reduction without yield loss, demonstrating how precision-fertigation can magnify the agronomic value of controlled-release products.
Introduction of Enzyme-Embedded Coatings Lowers Release Variability
Enzyme-embedded coatings in controlled-release fertilizers are improving nutrient release consistency in tropical climates. These coatings provide better control over nutrient release rates compared to traditional polymer systems, particularly in the variable temperature and humidity conditions of Southeast Asian agriculture. The coatings' enzymatic degradation mechanisms respond to soil microbial activity, reducing the release variability that previously restricted controlled-release fertilizer adoption in humid tropical regions. This technology benefits palm oil-producing areas where manufacturers can locally source bio-based coating materials. Regional research institutions are working with coating technology developers to create formulations suited to specific soil conditions and crop needs. By improving the reliability of controlled-release performance, this development addresses a key market constraint affecting farmer adoption in price-sensitive markets.
Restraints Impact Analysis*
| Restraint | (~) % Impact on CAGR Forecast | Geographic Relevance | Impact Timeline |
|---|---|---|---|
| High upfront cost versus conventional NPK | –1.4% | India, Southeast Asia, and smallholder China | Short term (≤2 years) |
| Limited retailer education outside Tier-1 cities | –0.8% | India, Indonesia, Philippines | Medium term (2-4 years) |
| Supply risk of specialty coating polymers | –0.6% | China, Japan, Korea | Short term (≤2 years) |
| Regional bans on micro-plastic coated granules | –0.5% | Asia-Pacific, Australia | Medium term (2-4 years) |
| Source: Mordor Intelligence | |||
High Upfront Cost Versus Conventional NPK
Controlled-release fertilizers still carry a 1.8 times price premium over standard urea in most Asia-Pacific markets, a hurdle magnified for smallholders who dominate rice and wheat acreage. While subsidies offset part of the gap, out-of-pocket expenses remain high, and many growers defer adoption until clear seasonal paybacks are validated through neighbor demonstration plots. In China, the cost of equipment, such as drip or sprinkler systems essential for precise application, can surpass USD 1,400 per mu (equivalent to USD 93.3 per ha). Limited access to agricultural credit and risk-averse farming practices further constrain adoption among smallholders who cannot afford the higher initial investment despite potential long-term benefits.
Limited Retailer Education Outside Tier-1 Cities
Agricultural dealers in secondary towns often lack technical training to explain coating technologies, correct application rates, and storage requirements. Without credible guidance, farmers default to familiar bulk NPK, stalling market penetration in key growth corridors of Uttar Pradesh, Mindanao, and Central Java. Manufacturers are scaling train-the-trainer programs, but fragmented retail networks have slowed knowledge diffusion, shaving an estimated 0.8% off growth potential. Digital agriculture platforms are beginning to address this challenge by providing direct-to-farmer technical support, but the traditional retail channel remains critical for product availability and local market development.
*Our forecasts treat driver/restraint impacts as directional, not additive. The impact forecasts reflect baseline growth, mix effects, and variable interactions.
Segment Analysis
By Coating Type: Polymer-Coated Products Lead, Polymer Sulfur-Coated Gains Momentum
Polymer-coated products held the largest Asia-Pacific controlled-release fertilizer market share at 71.2% in 2025, reflecting the technology's maturity and effectiveness across diverse agricultural systems. Their widespread adoption is driven by robust manufacturing capabilities in countries like China and Japan, coupled with demonstrated benefits in nutrient-use efficiency and controlled nutrient release. Ongoing advancements in coating formulations continue to enhance performance under diverse climatic conditions, further solidifying the segment's leading position.
Polymer sulfur-coated products are anticipated to be the fastest-growing coating type, with a projected CAGR of 8.9% through 2031. This growth is attributed to rising demand for cost-effective controlled-release solutions and advancements in coating technologies that improve nutrient delivery consistency. Concurrently, polymer-coated fertilizers maintain their appeal due to their ability to enhance crop productivity, minimize nutrient losses, and facilitate precision nutrient management across key crops in the region.


By Crop Type: Horticultural Shift Accelerates Premium Adoption
Horticultural crops represented the largest Asia-Pacific controlled-release fertilizer market size among crop types in 2025, accounting for 43.9% of total market revenue, supported by the expansion of greenhouse vegetables, fruits, flowers, and other high-value crops that require precise nutrient management. Controlled-release fertilizers are increasingly adopted in horticultural production to improve nutrient-use efficiency, enhance crop quality, and reduce environmental losses, particularly in intensive cultivation systems.
Field crops are projected to be the fastest-growing segment, expanding at a CAGR of 7.9% during 2026 to 2031. Growth is driven by rising adoption across rice, wheat, and corn production systems, where labor savings, reduced application frequency, and improving government support are encouraging greater use of controlled-release fertilizers. Precision agriculture technologies and digital nutrient-management tools are further supporting adoption across broad-acre farming operations in the region.
Geography Analysis
China represented the largest Asia-Pacific controlled-release fertilizer market share at 47.9% in 2025, firmly anchoring regional demand. Central and provincial subsidies, paired with domestic resin capacity, keep landed costs low, spurring widespread adoption across corn, rice, and vegetable belts. Local champions such as Kingenta leverage extensive distribution networks to penetrate tier-three counties, often bundling digital advisory tools that optimize application timing. The market's maturity is reflected in the presence of both international suppliers, such as ICL Group, and strong domestic competitors, which continue to drive innovation and adoption.
India is poised to be the fastest-growing market, advancing at a CAGR of 9.4% through 2031. Growth is supported by government fertilizer subsidies totaling Rs 1.71 lakh crore (USD 20.5 billion) for 2024–25 and the increasing inclusion of enhanced-efficiency fertilizers in subsidy programs [3]Source: INDIAN FERTILIZER PORTAL, “Demand Forecast,” IndianFertilizer.com. The Indian market's transformation is driven by policy reforms aimed at improving nutrient-use efficiency and environmental sustainability, creating favorable conditions for the adoption of controlled-release fertilizers among traditionally price-sensitive farmers.
Japan and South Korea continue to support steady demand for premium produce, where growers value the consistent nutrient-release profiles of controlled-release fertilizers. Meanwhile, Southeast Asian markets, including Indonesia, Thailand, the Philippines, and Vietnam, are experiencing rapid expansion driven by protected cultivation growth and increasing regulatory pressure to reduce nutrient runoff in environmentally sensitive coastal and island production systems.
Competitive Landscape
The Asia-Pacific controlled-release fertilizer market exhibits moderate concentration, with the top players including ICL Group Ltd, Grupa Azoty S.A. (Compo Expert), Florikan ESA LLC, Hebei Sanyuanjiuqi Fertilizer Co., Ltd., and Hebei Woze Wufeng Biological Technology Co., Ltd. This concentration pattern reflects the complexity of coating technologies and substantial R&D investments required to develop region-specific formulations that perform consistently across diverse climatic conditions. Market leaders like ICL Group, Compo Expert, and Haifa Group leverage their global technology platforms while establishing local manufacturing and distribution capabilities to serve regional demand effectively.
The competitive intensity is heightened by the presence of strong domestic players, particularly Chinese manufacturers like Kingenta Ecological Engineering Group, who combine local market knowledge with cost-competitive production capabilities. Strategic differentiation increasingly centers on technological innovation, with companies investing in advanced coating formulations that address specific regional challenges such as tropical humidity and variable soil conditions. The emergence of bio-based polyurethane coatings derived from palm kernel oil represents a potential disruption to established polymer coating supply chains, creating opportunities for regional players to leverage local feedstock availability while meeting sustainability requirements.
Opportunities exist in precision agriculture integration, where controlled-release fertilizers can be optimized for digital farming systems that provide site-specific recommendations and real-time monitoring capabilities. Companies are also exploring enzyme-embedded coating technologies that offer more predictable release patterns under variable environmental conditions, addressing a critical performance limitation that has historically constrained adoption in tropical markets.
Asia-Pacific Controlled-Release Fertilizer Industry Leaders
ICL Group Ltd
Grupa Azoty S.A. (Compo Expert)
Hebei Sanyuanjiuqi Fertilizer Co., Ltd.
Hebei Woze Wufeng Biological Technology Co., Ltd
Florikan ESA LLC
- *Disclaimer: Major Players sorted in no particular order

Recent Industry Developments
- May 2024: Haifa Group announced the opening of a new trading company in China. The establishment of the new Haifa subsidiary in China will enable the group to significantly expand its offerings to China agriculture sector.
- March 2024: Yara International introduced YaraVita PROCOTE, a micronutrient-fortified CRF for citrus and durian farms in Thailand and Vietnam. Combines Zn, Mn, and Cu with controlled N-P-K release.
- November 2023: Nutrien Ltd. acquired Agrium Controlled-Release Fertilizer (CRF)s, integrating its ESN (Environmentally Smart Nitrogen) technology into Nutrien’s APAC portfolio, especially for Australian vineyards and Japanese horticulture.


Asia-Pacific Controlled-Release Fertilizer Market Report Scope
Polymer Coated, Polymer-Sulfur Coated, Others are covered as segments by Coating Type. Field Crops, Horticultural Crops, Turf & Ornamental are covered as segments by Crop Type. Australia, Bangladesh, China, India, Indonesia, Japan, Pakistan, Philippines, Thailand, Vietnam are covered as segments by Country.Coating Type
| Polymer Coated |
| Polymer-Sulfur Coated |
| Others |
Crop Type
| Field Crops |
| Horticultural Crops |
| Turf & Ornamental |
Country
| Australia |
| Bangladesh |
| China |
| India |
| Indonesia |
| Japan |
| Pakistan |
| Philippines |
| Thailand |
| Vietnam |
| Rest of Asia-Pacific |
| Coating Type | Polymer Coated |
| Polymer-Sulfur Coated | |
| Others | |
| Crop Type | Field Crops |
| Horticultural Crops | |
| Turf & Ornamental | |
| Country | Australia |
| Bangladesh | |
| China | |
| India | |
| Indonesia | |
| Japan | |
| Pakistan | |
| Philippines | |
| Thailand | |
| Vietnam | |
| Rest of Asia-Pacific |


Market Definition
- MARKET ESTIMATION LEVEL - Market Estimations for various types of fertilizers has been done at the product-level and not at the nutrient-level.
- NUTRIENT TYPES COVERED - Urea & Complex
- AVERAGE NUTRIENT APPLICATION RATE - This refers to the average volume of nutrient consumed per hectare of farmland in each country.
- CROP TYPES COVERED - Field Crops: Cereals, Pulses, Oilseeds, and Fiber Crops Horticulture: Fruits, Vegetables, Plantation Crops and Spices, Turf Grass and Ornamentals
| Keyword | Definition |
|---|---|
| Fertilizer | Chemical substance applied to crops to ensure nutritional requirements, available in various forms such as granules, powders, liquid, water soluble, etc. |
| Specialty Fertilizer | Used for enhanced efficiency and nutrient availability applied through soil, foliar, and fertigation. Includes CRF, SRF, liquid fertilizer, and water soluble fertilizers. |
| Controlled-Release Fertilizers (CRF) | Coated with materials such as polymer, polymer-sulfur, and other materials such as resins to ensure nutrient availability to the crop for its entire life cycle. |
| Slow-Release Fertilizers (SRF) | Coated with materials such as sulfur, neem, etc., to ensure nutrient availability to the crop for a longer period. |
| Foliar Fertilizers | Consist of both liquid and water soluble fertilizers applied through foliar application. |
| Water-Soluble Fertilizers | Available in various forms including liquid, powder, etc., used in foliar and fertigation mode of fertilizer application. |
| Fertigation | Fertilizers applied through different irrigation systems such as drip irrigation, micro irrigation, sprinkler irrigation, etc. |
| Anhydrous Ammonia | Used as fertilizer, directly injected into the soil, available in gaseous liquid form. |
| Single Super Phosphate (SSP) | Phosphorus fertilizer containing only phosphorus which has lesser than or equal to 35%. |
| Triple Super Phosphate (TSP) | Phosphorus fertilizer containing only phosphorus greater than 35%. |
| Enhanced Efficiency Fertilizers | Fertilizers coated or treated with additional layers of various ingredients to make it more efficient compared to other fertilizers. |
| Conventional Fertilizer | Fertilizers applied to crops through traditional methods including broadcasting, row placement, ploughing soil placement, etc. |
| Chelated Micronutrients | Micronutrient fertilizers coated with chelating agents such as EDTA, EDDHA, DTPA, HEDTA, etc. |
| Liquid Fertilizers | Available in liquid form, majorly used for application of fertilizers to crops through foliar and fertigation. |


Research Methodology
Mordor Intelligence follows a four-step methodology in all our reports.
- Step-1: IDENTIFY KEY VARIABLES: In order to build a robust forecasting methodology, the variables and factors identified in Step-1 are tested against available historical market numbers. Through an iterative process, the variables required for market forecast are set and the model is built on the basis of these variables.
- Step-2: Build a Market Model: Market-size estimations for the forecast years are in nominal terms. Inflation is not a part of the pricing, and the average selling price (ASP) is kept constant throughout the forecast period for each country.
- Step-3: Validate and Finalize: In this important step, all market numbers, variables and analyst calls are validated through an extensive network of primary research experts from the market studied. The respondents are selected across levels and functions to generate a holistic picture of the market studied.
- Step-4: Research Outputs: Syndicated Reports, Custom Consulting Assignments, Databases & Subscription Platforms


