
Market Overview
| Study Period | 2021 - 2031 |
|---|---|
| Forecast Data Period | 2026 - 2031 |
| Base Year Market Size (2025) | USD 12 Million |
| Market Size (2026) | USD 12.73 Million |
| Market Size (2031) | USD 17.13 Million |
| Growth Rate (2026 - 2031) | 6.12 % |
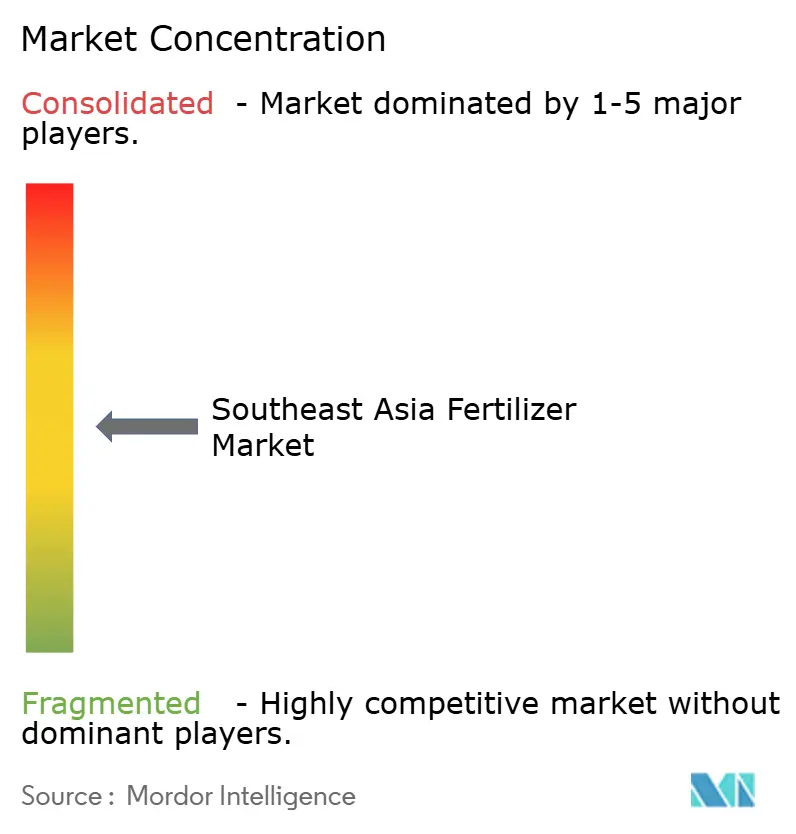
| Market Concentration | Medium |
Major Players *Disclaimer: Major Players sorted in no particular order Image © Mordor Intelligence. Reuse requires attribution under CC BY 4.0. | |
Southeast Asia Fertilizer Market Analysis by Mordor Intelligence
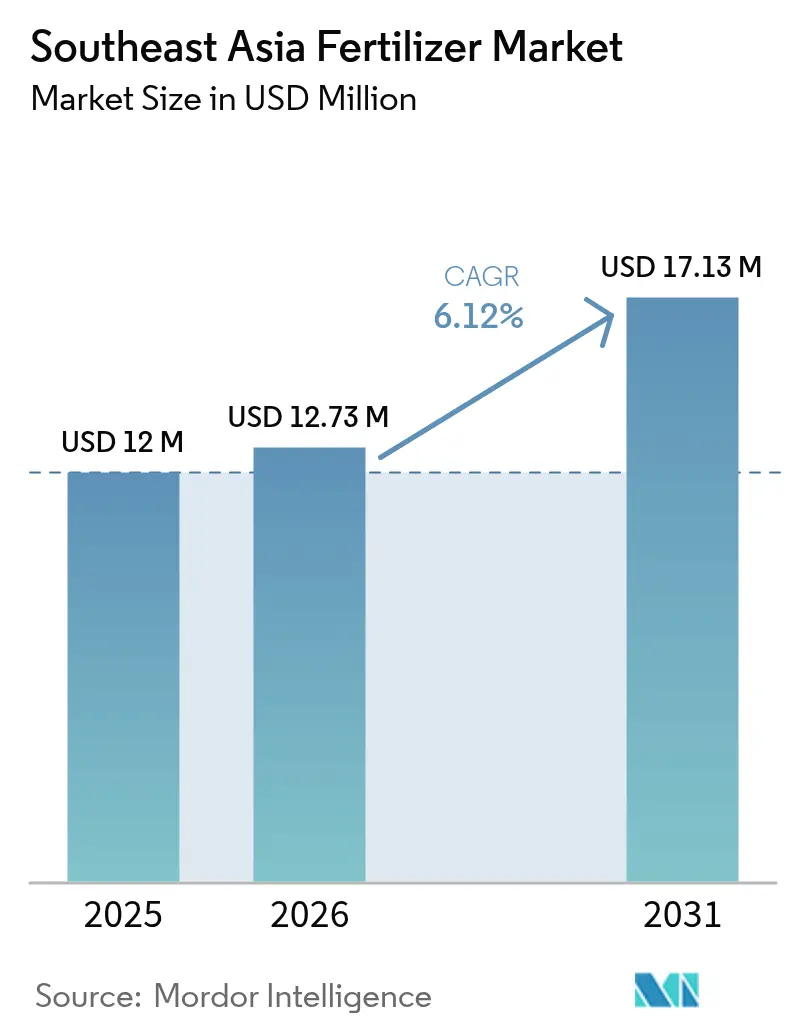
The Southeast Asia fertilizer market size is expected to grow from USD 12 million in 2025 to USD 12.73 million in 2026 and is forecast to reach USD 17.13 million by 2031 at 6.12% CAGR over 2026-2031. The region’s growth is anchored in public subsidy programs that lower input costs, a rising shift toward precision farming, and continuing investment in specialty nutrient technologies. Subsidized allocations totaling IDR 33.78 trillion (approximately USD 2.19 billion) in Indonesia alone demonstrate the government's commitment to fertilizer affordability, specifically designated for the 2024 budget year. Capacity expansions by domestic producers, coupled with field trials demonstrating double-digit efficiency gains from controlled-release formulations, are further widening adoption among rice, palm oil, and high-value horticulture growers. Meanwhile, digital agriculture tools that match nutrient dosing to real-time soil data are improving returns on investment and encouraging demand for premium blends compatible with sensor-guided application systems. Thailand's implementation of Variable Rate Technology for oil palm fertilization and Indonesia's development of the world's first hybrid green ammonia project, scheduled for 2024, signal a shift in the market toward sustainable, technology-driven solutions.
Key Report Takeaways
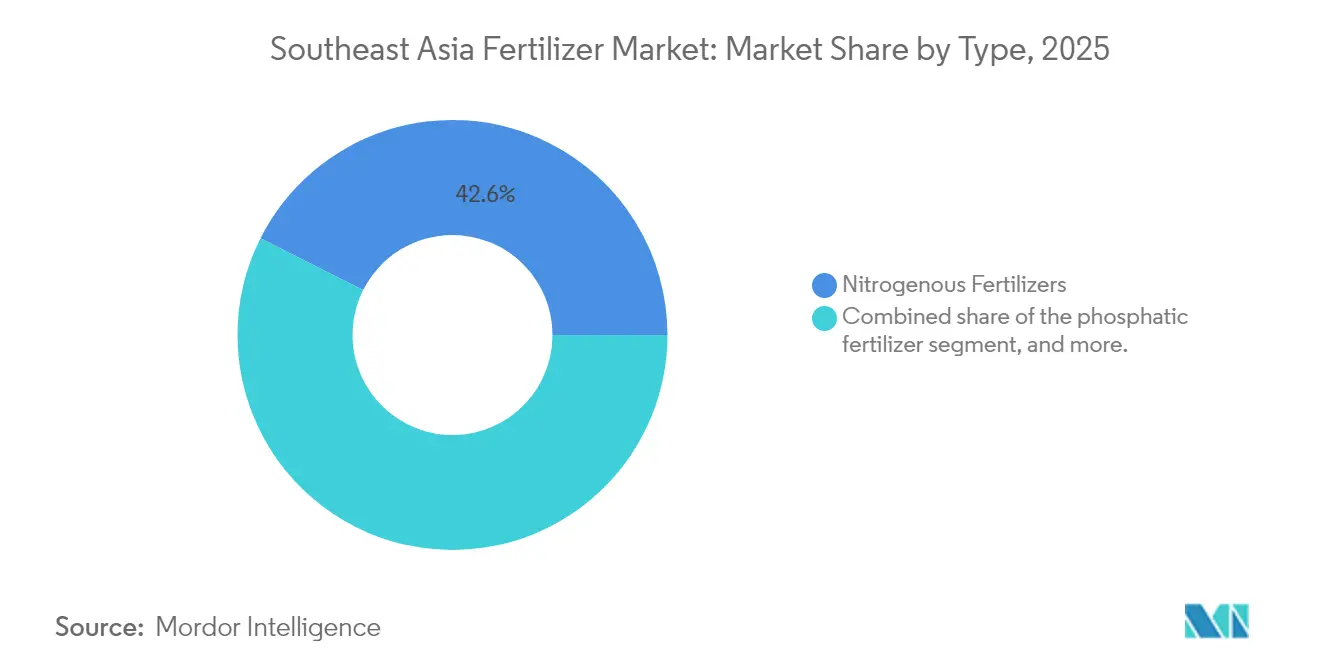
- By type, nitrogenous fertilizers captured 42.58% of the Southeast Asia fertilizer market share in 2025. Micronutrients are projected to post a 8.95% CAGR between 2026 and 2031, the fastest among all product categories.
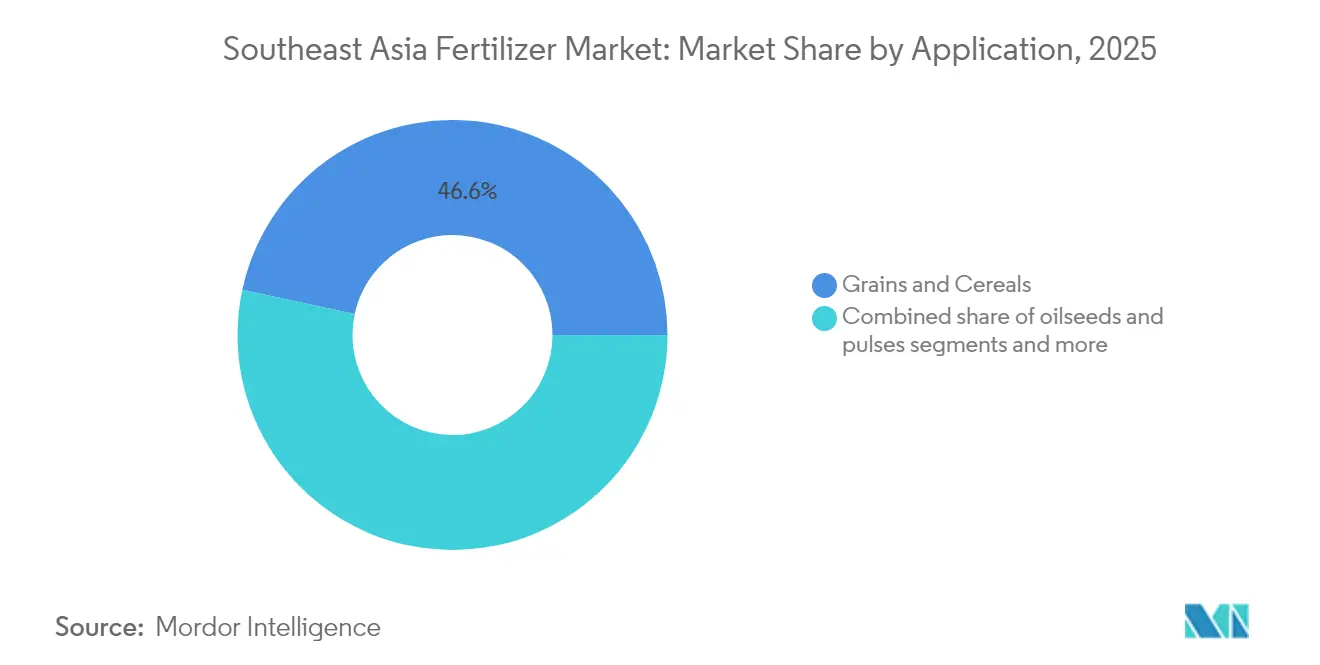
- By application, grains and cereals commanded 46.62% of the Southeast Asia fertilizer market size in 2025. Fruits and vegetables are forecast to expand at an 8.16% CAGR through 2031, outpacing every other crop segment.
- By geography, Indonesia captured 48.31% revenue share of the market in 2025, and Vietnam is projected to expand at an 8.18% CAGR to 2031.
Note: Market size and forecast figures in this report are generated using Mordor Intelligence’s proprietary estimation framework, updated with the latest available data and insights as of 2026.
Southeast Asia Fertilizer Market Trends and Insights
Drivers Impact Analysis*
| Driver | (~) % Impact on CAGR Forecast | Geographic Relevance | Impact Timeline |
|---|---|---|---|
| Widespread adoption of precision-farming tools | +1.2% | Indonesia, Thailand, and Malaysia | Medium term (2-4 years) |
| Surging demand for enhanced-efficiency fertilizers | +0.9% | Global, with concentration in Vietnam and Philippines | Short term (≤ 2 years) |
| Government nutrient-management subsidy programs | +1.5% | Indonesia, Thailand, Malaysia, and Philippines | Short term (≤ 2 years) |
| Expansion of controlled-release and specialty blends | +0.8% | Malaysia, Indonesia, and Thailand | Medium term (2-4 years) |
| Digital twin modeling for field-specific fertilizer dosing | +0.6% | Thailand, Malaysia, and Vietnam | Long term (≥ 4 years) |
| Carbon-credit incentives for low-emission fertilizers | +0.4% | Indonesia, Malaysia, and Thailand | Long term (≥ 4 years) |
| Source: Mordor Intelligence | |||
Widespread Adoption of Precision-Farming Tools
Satellite imagery, soil sensors, and variable-rate applicators are transforming nutrient management across the Southeast Asia fertilizer market. Thailand’s Agriculture and Cooperatives Strategy offers tax relief for smart farming hardware, accelerating uptake of GPS-guided spreaders that cut nitrogen losses by up to 15%[1]Source: German-Thai Chamber of Commerce, “The Transition: Composing a Smart Farm,” gtcc.or.th. Malaysian oil-palm estates now run trials with drone-based mapping that tailors potassium inputs to canopy vigor, while Indonesian cooperatives deploy AI soil diagnostics that recommend field-specific urea rates. As growers verify savings in both cost and labor, demand for granular formulations compatible with precision machinery is rising. This technological shift drives demand for specialized fertilizer formulations compatible with precision application equipment, creating opportunities for enhanced-efficiency products.
Surging Demand for Enhanced-Efficiency Fertilizers
Controlled-release urea use in Vietnam expanded 25% in 2024, reflecting a regional pivot toward products that curb volatilization losses in monsoon climates. Indonesian universities report rice-husk-biochar coatings that extend nitrogen release over 60 days, lifting uptake efficiency by 20%. Malaysia's palm oil sector increasingly adopts slow-release formulations to address labor shortages and reduce application frequency. Palm growers in Malaysia favor polymer-coated blends that slash application frequency, easing labor constraints. Rising fertilizer costs, with urea prices reaching USD 430 per metric ton in February 2025, further accelerate the adoption of efficiency-enhancing products that deliver superior nutrient utilization rates.
Government Nutrient-Management Subsidy Programs
Public funding remains the strongest growth lever for the Southeast Asia fertilizer market. Indonesian state-owned PT Pupuk Indonesia distributed 7.25 million metric tons of subsidized fertilizer in 2024, surpassing targets. Thailand continues to reimburse smallholders for nutrient costs, and Vietnam exempts import tariffs on phosphate-based products under ASEAN-Korea agreements. However, subsidy coverage gaps persist, with South Sulawesi studies indicating government allocations meet only 37% of actual farmer requirements in 2024, creating market opportunities for private sector solutions.
Expansion of Controlled-Release and Specialty Blends
Specialty formulations that align macro- and micronutrients to crop phenology are gaining share. Malaysian producers market oil-palm blends with tailored boron and magnesium ratios, while Indonesian research institutes validate biochar-coated NPK pellets that outperform conventional inputs on acidic soils. Thailand’s sugar cane growers begin adopting sulfur-coated urea to manage nitrogen leaching amid erratic rainfall. These advances create a premium segment with higher margins and sustained throughput for domestic manufacturers. Vietnam's export-oriented agriculture sector adopts specialty blends tailored for high-value crops, supporting the country's agricultural diversification strategy. The Philippines promotes organic-inorganic fertilizer combinations through the National Organic Agriculture Program, creating demand for hybrid formulations that balance productivity with sustainability objectives.
Restraints Impact Analysis*
| Restraint | (~) % Impact on CAGR Forecast | Geographic Relevance | Impact Timeline |
|---|---|---|---|
| Limited rural credit access | -0.8% | The Philippines, Vietnam, and Indonesia rural areas | Short term (≤ 2 years) |
| Climate-induced application uncertainties | -0.6% | Vietnam, Thailand, and the Philippines | Medium term (2-4 years) |
| Volatility in ammonia and potash feedstock prices | -1.1% | Global, particularly import-dependent countries | Short term (≤ 2 years) |
| Lagging logistics infrastructure in secondary cities | -0.5% | Indonesia, the Philippines, and Vietnam | Medium term (2-4 years) |
| Source: Mordor Intelligence | |||
Limited Rural Credit Access
Smallholders in the Philippines pay annual interest rates topping 20% to informal lenders, constraining timely fertilizer purchases. Vietnamese rice farmers often lack collateral to meet banking requirements, while many Indonesian districts remain underserved by micro-finance branches. Smallholders in Malaysia's palm oil industry encounter comparable challenges, especially regarding investments in specialty fertilizers that demand higher initial expenditures. The International Fertilizer Development Center notes that credit access improvements could increase fertilizer consumption by 16% annually, as demonstrated in Indonesia's targeted subsidy programs
Climate-Induced Application Uncertainty
El Niño events and erratic monsoons complicate nutrient scheduling across the Southeast Asia fertilizer market. Thai growers witnessed rainfall shifts that forced mid-season changes in urea plans during 2024[2]Source: Asian Development Bank, “The Russian Invasion of Ukraine, Fertilizer Prices, and Food Security,” adb.org. Vietnamese deltas alternate between floods and droughts that wash away or lock up applied nutrients, while typhoon damage in the Philippines often wipes out recently fertilized acreage. These uncertainties shave returns on input investment and delay adopter confidence in premium products. Malaysia's palm oil sector adapts to changing precipitation patterns that influence fertilizer leaching rates and effectiveness. Climate change impacts are projected to reduce rice yields by 0.45% to 1.33% when combined with fertilizer price volatility, according to Asian Development Bank analysis.
*Our forecasts treat driver/restraint impacts as directional, not additive. The impact forecasts reflect baseline growth, mix effects, and variable interactions.
Segment Analysis
By Type: Nitrogenous Fertilizers Lead Market Share
Nitrogenous products, anchored by urea and ammonium sulfate, held a 42.58% share of the Southeast Asia fertilizer market in 2025. Domestic champion PT Pupuk Indonesia alone maintains an annual urea capacity of 9.4 million metric tons, ensuring a reliable supply for national rice targets. Imports still supplement Vietnamese and Thai demand, especially during peak paddy seasons. Potash fertilizers are subject to sourcing risks, however, the planned 1.2 million metric tons MOP facility in Thailand is expected to reduce dependency by 2028. Controlled-release coatings across each nutrient class are projected to gain market share because they match the incremental dosing preferred in precision platforms, thereby boosting nutrient-use efficiency under heavy rainfall regimes.
The Southeast Asia fertilizer market size attributed to micronutrient formulations is set to increase rapidly, with a 8.95% CAGR to 2031, reflecting growers’ push to correct widespread zinc and boron deficiencies. Specialty suppliers are responding with chelated blends that resist tropical soil fixation and are compatible with precision spreader formats. Secondary macronutrients, particularly sulfur and magnesium, rise in relevance as palm oil estates pursue higher oil-to-bunch ratios.



By Application: Grains and Cereals Dominate Usage
Grains and cereals accounted for 46.62% of the Southeast Asia fertilizer market size in 2025, reflecting rice’s strategic role in national food security. Indonesia’s plan to develop an additional 3 million hectares of rice land will require an extra 500,000 metric tons of urea and NPK blends each year once full planting begins. Thai rice cooperatives adopt site-specific nitrogen management to stabilize yields amid climate swings, reinforcing baseline demand.
Fruits and vegetables post the fastest trajectory at 8.16% CAGR through 2031 as export chains expand. Capsicum, durian, and dragon-fruit orchards demand soluble nutrient programs that support high-density planting. Commercial crops such as palm oil sustain steady bulk NPK uptake, while oilseeds and pulses usage gains momentum under crop-rotation policies aimed at soil health. Urban vertical farms in Kuala Lumpur and Bangkok anchor a niche segment for high-purity soluble fertilizers, adding diversified revenue to the Southeast Asia fertilizer market.
Geography Analysis
Indonesia is the largest consuming nation, capturing 48.31% revenue share of the market in 2025, energized by subsidized distribution channels and strong domestic production. Government spending of IDR 33.78 trillion (USD 2.19 billion) in 2024 financed 9.55 million metric tons of discounted fertilizer that reached 17 million farmers. The upcoming hybrid green-ammonia plant positions Indonesia as an early mover in low-carbon nitrogen manufacturing, aligning supply resilience with environmental targets.
Vietnam is projected to expand at an 8.18% CAGR to 2031. It sits at the center of regional trade flows. Export volumes topped 1.29 million metric tons in the first nine months of 2024, even after the government introduced a 5% export tax on nitrogen products to safeguard local supply. Domestic fertilizer plants feed national rice priorities, while import terminals secure phosphate and potash from diverse origins. Malaysia’s palm-oil-fueled demand, the Philippines’ 66% import dependency, and emerging adoption in Myanmar and Cambodia add depth and opportunity across the Southeast Asia fertilizer market.
Thailand follows with roughly 4 million metric tons of fertilizer use annually. Policies embedded in its twenty-year agricultural strategy incentivize precision agriculture through machinery grants and training programs. A planned potash mine in Chaiyaphum province should cut import reliance once operational in 2028, smoothing potash price swings and supporting balanced fertilization for sugar cane and cassava.
Regulatory Landscape
Regulation across Southeast Asia continues to balance affordability programs with tighter quality and traceability requirements. Indonesia remains a key anchor due to its subsidy architecture and compliance regime, Presidential Regulation 113/2025, which reformed the fertilizer subsidy system (shifting toward an input-based approach) and permitted exports of non-subsidized products. Mandatory SNI certification (processed via the SIINas platform and assessed by designated conformity bodies) underpins product quality control for fertilizers such as solid NPK.
Several countries are also adjusting trade and market access rules to improve supply resilience and reduce administrative friction. In 2026, Vietnam abolished national quality pre-inspection for imported fertilizers and moved to risk-based post-market surveillance. ASEAN-level initiatives such as the ASEAN Standard for Organic Agriculture (ASOA) and the Action Plan for Sustainable Agriculture in ASEAN support harmonization and sustainability-focused nutrient management across member states. In the Philippines, fertilizers continue to benefit from tariff and VAT exemptions under existing laws, while policy discussions increasingly emphasize import-source diversification to manage concentration risks.
Competitive Landscape
State ownership and multinational reach shape a moderately concentrated playing field. PPT Pupuk Indonesia (Persero) controls integrated production from ammonia to NPK and leverages proprietary distribution kiosks for last-mile delivery. Mitsui & Co., Ltd. (Thai Central Chemical PCL) and Vietnam’s Song Gianh Corporation offer localized blends that cater to various soil types and staple crops. Yara International ASA, Nutrien Ltd., and ICL Group Ltd. (Israel Corporation) compete through specialty grades and agronomic advisory services that mesh with precision platforms, even as they source bulk nutrients from global hubs.
Strategic partnerships focus on securing raw materials and achieving decarbonization. Pupuk Indonesia’s alliance with Itochu on green ammonia and Thai developers’ stake in domestic potash mining illustrate vertical integration moves designed to lock in cost advantages. Digital agronomy solutions packaged with fertilizer sales are proliferating. Yara’s crop-nutrition platforms and ICL Group Ltd.'s (Israel Corporation) soil-analysis apps help growers maximize returns and demonstrate environmental compliance. Specialty micronutrient firms target high-value horticulture markets where smaller volumes carry attractive margins, prompting potential consolidation as demand scales.
Regional players also explore carbon-credit monetization. Pilot projects in Malaysia’s palm sector test certified low-emission nitrogen blends that could generate future revenue streams under voluntary offset schemes. As governments refine sustainability frameworks, suppliers with proven emissions reductions, traceable sourcing, and digital advisory capabilities are poised to capture share within the Southeast Asia fertilizer market.
Southeast Asia Fertilizer Industry Leaders
Song Gianh Corporation
Mitsui & Co., Ltd. (Thai Central Chemical PCL)
PT Petrokimia Gresik
Yara International ASA
PT Pupuk Indonesia (Persero)
- *Disclaimer: Major Players sorted in no particular order

Market Opportunities and Future Outlook
Capacity and efficiency upgrades in Indonesia, alongside a growing push for coordinated regional supply, create room for both bulk nutrients and higher-value blends. In January 2026, PT Pupuk Kalimantan Timur completed a revamp of Ammonia Plant-2 in Bontang, improving energy efficiency by 16%. The Indonesian government also announced plans for seven new fertilizer production facilities under Pupuk Indonesia, with investment cited in the Rp50-77 trillion range through 2029. Separately, Parna Raya Group broke ground in May 2026 on an integrated nitrate complex (nitric acid, ammonium nitrate, and NPK) at Maspion Industrial Estate, East Java, with investment up to USD 300 million, expanding the local base for downstream nitrogen and compound fertilizers.
Another opportunity area is support for programs and institutions that accelerate adoption of tailored and sustainable nutrient solutions. In April 2026, PT Pupuk Indonesia, PETRONAS Chemicals Group, and Brunei Fertilizer Industries launched the Southeast Asia Fertilizer Association (SEAFA) to coordinate regional supply and sustainable practices. Thailand also launched the Tailor-made Fertiliser for Thai Farmers project in June 2026 to deploy organic-chemical fertilizer approaches through cooperatives. Demand-side initiatives are intersecting with regulatory shifts such as Vietnam’s move to post-market surveillance, and Malaysia’s confirmation in July 2026 that a Fertiliser Bill will be tabled in early 2027, which together support market space for compliant, traceable products and advisory-led offerings for growers facing evolving quality and transparency requirements.
Recent Industry Developments
- July 2026: PT Petrokimia Gresik reported fertilizer output of 2.71 million metric tons in H1 2026, up from 2.43 million metric tons in H1 2025. The higher run-rate supports Indonesia’s subsidized and commercial distribution needs and indicates stronger operating performance amid volatile feedstock and import conditions.
- February 2025: ASEAN Potash Mining Public Company Limited confirmed construction of a 1.2 million metric tons MOP facility in Chaiyaphum, Thailand, with start-up targeted for 2028. The project advances domestic potash availability for Thailand and can reduce exposure to imported MOP price swings for balanced NPK programs.
- August 2024: PT Pupuk Indonesia, Itochu, and Toyo Engineering signed a joint development agreement for a hybrid green ammonia project in Aceh, with a commercial launch targeted for 2027. The agreement supports a lower-carbon nitrogen pathway and strengthens upstream ammonia security for urea and downstream nitrogen fertilizers in the region.


Research Methodology Framework and Report Scope
Market Definition and Coverage
In this methodology, the Southeast Asia fertilizer market is counted as the value of plant nutrient fertilizers sold for crop production across the region, covering nutrient types used to improve soil fertility and crop yield, whether supplied in solid, liquid, or gaseous form.
Scope exclusions: We exclude non-fertilizer crop inputs such as pesticides, seeds, and farm equipment, and we do not count on-farm manure use that is not commercially traded.
Segmentation Overview
- By Type
- Nitrogenous Fertilizers
- Urea
- Calcium Ammonium Nitrate
- Ammonia
- Ammonium Nitrate
- Ammonium Sulfate
- Other Nitrogenous Fertilizers
- Phosphatic Fertilizers
- Mono-ammonium Phosphate
- Di-ammonium Phosphate
- Triple Superphosphate
- Other Phosphatic Fertilizers
- Potash Fertilizers
- Muriate of Potash
- Other Potash Fertilizers
- Secondary Macronutrients
- Micronutrients
- Nitrogenous Fertilizers
- By Application
- Grains and Cereals
- Oilseeds and Pulses
- Commercial Crops
- Fruits and Vegetables
- Other Applications
- By Geography
- Malaysia
- Thailand
- Vietnam
- Philippines
- Indonesia
- Rest of Southeast Asia
Data Sources, Market Sizing, and Validation
Desk Research
Desk work starts with building the demand pool by country using official agriculture and trade statistics, and then aligning it with fertilizer use patterns by crop. Public sources that are typically used include FAOSTAT fertilizer and crop datasets, ASEAN and national statistics offices, UN Comtrade trade flows for key nutrients and blends, and customs and port authority releases where available.
We also review policy and price signals that move the market year to year, such as subsidy notes and procurement announcements from agriculture ministries, and producer and importer disclosures in annual reports and investor presentations. To cross-check trade and pricing direction, we may reference an import-export shipment-level database and a news and financials database, which helps in validating timing of supply disruptions and price spikes. The desk sources listed here are illustrative only, and many other public documents were reviewed for data collection, validation, and clarification.
Primary Interviews and Surveys
Primary work is used to pressure-test country splits, product mix, and pricing logic through interviews and short surveys with manufacturers, importers, distributors, and large farm or plantation buyers. Since the region is diverse, we also validate differences in crop calendars, subsidy execution, and import dependence across major markets, then reconcile these points with the desk-based model outputs.
Distribution of primary research fieldwork respondents
| Company type | Respondent position |
|---|---|
| Top tier: 29% | CXOs: 16% |
| Mid tier: 53% | Functional/Unit leaders: 36% |
| Smaller Players: 18% | Managers: 48% |
Market-Sizing & Forecasting
Sizing begins with a top-down reconstruction that links crop area and cropping intensity to application rates, then converts nutrient demand into commercial fertilizer value using regional and country price series. To keep the estimate practical, we lean on repeatable inputs such as planted area for key crops, import volumes for urea, DAP, potash and blends, subsidy coverage and timing, average nutrient application rates, and observed farmgate price movements.
Selective bottom-up checks are used to keep totals realistic. This includes rolling up sampled sales volumes from distributors, checking capacity and utilization signals for domestic producers, and applying ASP times volume to a limited set of high-visibility product groups. When company disclosures are not granular, gaps are handled through channel-share assumptions that are verified with interviews, followed by a conservative adjustment if the implied per-hectare use looks out of line.
For forecasting, we use scenario analysis with price and volume drivers separated, since fertilizer demand can be steady while prices swing sharply. The forward view is built from expected crop economics, policy continuity, trade flow direction, and a smoothed price path, then tuned using expert views on likely procurement cycles and normalization after shock years.
Data Validation & Update Cycle
Before sign-off, outputs are triangulated against independent signals such as nutrient import trends, crop acreage shifts, and country-level fertilizer consumption indicators, and then checked for unrealistic jumps in ASP or per-hectare use. If a country total moves faster than the known drivers, the model is re-opened to review currency conversion, unit consistency, and the mix split across nitrogen, phosphate, and potash products.
Reports are refreshed annually, and interim updates are triggered when material events occur, such as sharp energy-driven price shifts, export restrictions, or sudden subsidy changes. Right before delivery, an analyst completes a final pass to ensure the latest public releases and field feedback are reflected in the numbers.
Mordor Intelligence's South East Asia Fertilizer Market Sizing Compared With Other Published Estimates
Different published numbers for this market are common, because authors often handle price timing, currency conversion, and the split between volume and ASP changes in their own way. The gap also gets wider when the country list is not consistent across studies, or when adjacent inputs are mixed into fertilizer value.
When annual prices move quickly, the conversion month, the assumed product mix, and how subsidies are treated can change the final value significantly. By re-checking key price series and trade flows close to publication and applying consistent currency timing at the country level, the estimate remains anchored to what farmers and distributors are actually paying in the period used, which is the refresh-led discipline applied by Mordor Intelligence.
Benchmark comparison
| Source | Market Size | Gaps in Research Methodology |
|---|---|---|
| Mordor Intelligence | USD 12 M (2025) | |
| Regional Consultancy A | USD 11.20 B (2025) | The figure appears to use a broader value definition, likely mixing in a wider set of agrifood inputs or using a different unit basis, which makes it not directly comparable to a fertilizer-only market value. |
| Industry Research Publisher B | USD 11.00 B (2024) | The value is presented as an approximate level with limited visibility on country coverage and price timing, and the year is different, which can distort comparisons in a market with volatile fertilizer prices. |
The spread mainly comes from scope and unit consistency, followed by how prices are translated into USD in a volatile period. Once definitions are aligned to fertilizer-only products and the same year and currency timing are used, the model steps become easy to repeat and the resulting market value becomes more traceable.


Key Questions Answered in the Report
How large is the Southeast Asia fertilizers market in 2026?
The market is valued at USD 12.73 million in 2026 and is projected to reach USD 17.13 million by 2031.
Which nutrient type leads regional demand?
Nitrogenous fertilizers hold 42.58% of the 2025 market, reflecting rice-driven nitrogen requirements.
What segment is growing fastest by application?
Fruits and vegetables are anticipated to post an 8.16% CAGR during 2026-2031 due to export-oriented horticulture.
How will Thailand reduce potash import dependence?
A 1.2 million-ton MOP facility scheduled for 2028 will supply domestic and regional users.
What technology trend is reshaping fertilizer application?
Digital twin modeling allows real-time nutrient dosing simulations that can cut input costs by double digits.
Why are carbon credits relevant to fertilizer suppliers?
Indonesia and Malaysia are developing schemes that reward low-emission fertilizers, opening new revenue streams.
Page last updated on:


 Your data is secure and never sold or shared.


