Market Overview
| Study Period | 2023 - 2031 |
|---|---|
| Forecast Data Period | 2026 - 2031 |
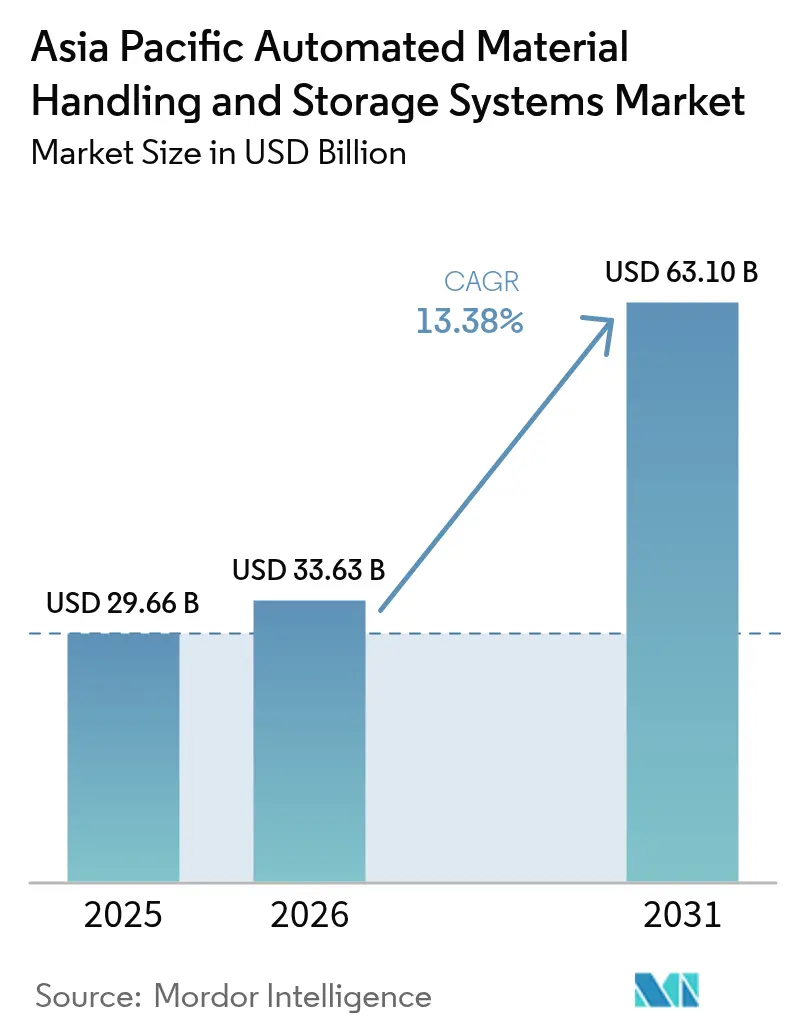
| Base Year Market Size (2025) | USD 29.66 Billion |
| Market Size (2026) | USD 33.63 Billion |
| Market Size (2031) | USD 63.1 Billion |
| Growth Rate (2026 - 2031) | 13.38% CAGR |
| Market Concentration | Medium |
Major Players *Disclaimer: Major Players sorted in no particular order Image © Mordor Intelligence. Reuse requires attribution under CC BY 4.0. | |
Asia Pacific Automated Material Handling And Storage Systems Market Analysis by Mordor Intelligence
The Asia Pacific automated material handling and storage systems market size in 2026 is estimated at USD 33.63 billion, growing from 2025 value of USD 29.66 billion with 2031 projections showing USD 63.1 billion, growing at 13.38% CAGR over 2026-2031. Strong policy backing for smart-factory rollouts, widespread 5G industrial IoT deployments, and the rapid build-out of e-commerce fulfilment hubs across tier-2 cities collectively propel the Asia Pacific automated material handling and storage systems market. China anchors demand with a 42.1% 2024 revenue share, while India leads growth at a 15.05% CAGR as Production Linked Incentive schemes accelerate automation investments. Hardware retains leadership at 64% share, yet the software layer is scaling quickly at a 14.52% CAGR as factories prioritize data-driven optimization. Mobile robots already account for 28.3% of equipment deployments, and autonomous mobile robots (AMR) are advancing at 15.11% CAGR as operators favour layout flexibility over fixed infrastructure.[1]AutoStore, “Corporate Overview,” autostore.com
Key Report Takeaways
- By product type, hardware commanded 63.42% of the Asia Pacific automated material handling and storage systems market share in 2025; software solutions are projected to expand at a 14.12% CAGR through 2031.
- By equipment type, AMR deployments represented 27.92% of the Asia Pacific automated material handling and storage systems market size in 2025 and are forecast to grow at a 14.78% CAGR between 2026-2031.
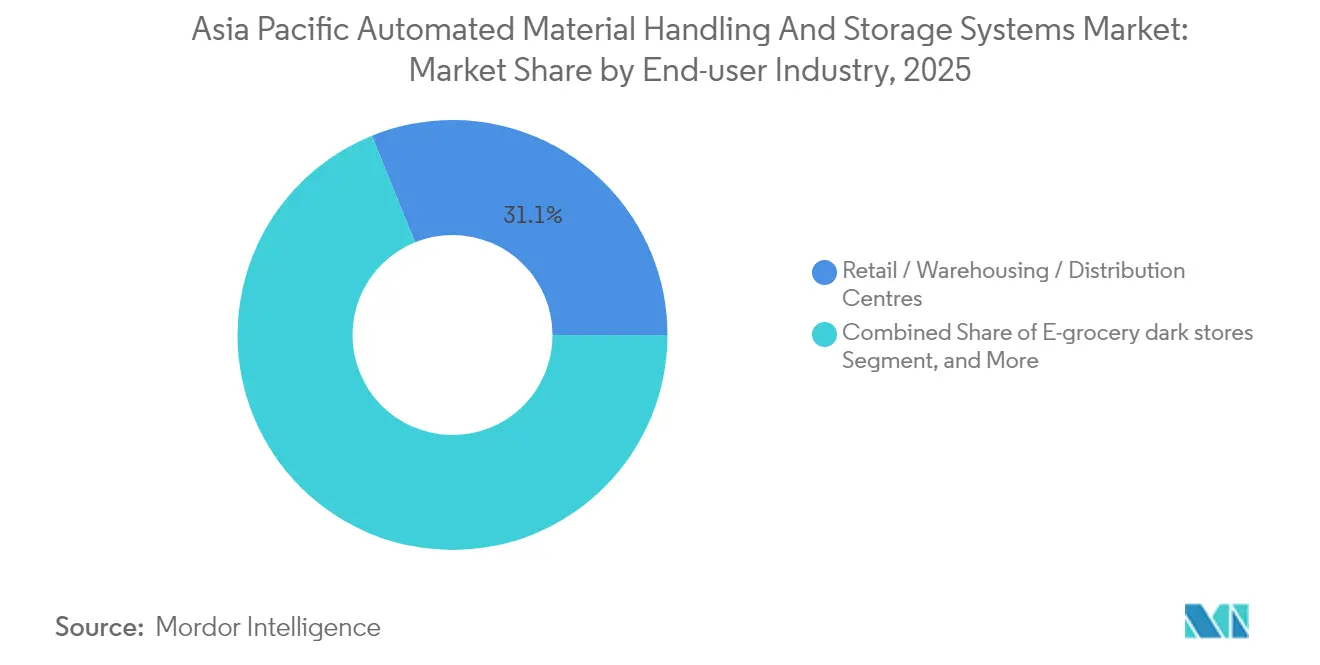
- By end-user industry, retail, warehousing, and distribution centers led with 31.12% revenue share in 2025, while e-grocery dark stores are expected to record the fastest 14.47% CAGR to 2031.
- By function, storage held 34.96% of the Asia Pacific automated material handling and storage systems market size in 2025; sorting activities are slated to post a 14.95% CAGR through 2031.
- By country, China controlled 41.68% revenue in 2025; India is projected to climb at a 14.72% CAGR to 2031.
Note: Market size and forecast figures in this report are generated using Mordor Intelligence’s proprietary estimation framework, updated with the latest available data and insights as of 2026.
Asia Pacific Automated Material Handling And Storage Systems Market Trends and Insights
Drivers Impact Analysis*
| Driver | (~) % Impact on CAGR Forecast | Geographic Relevance | Impact Timeline |
|---|---|---|---|
| Booming e-commerce fulfillment centers across Tier-2 Asian cities | +2.80% | China, India, Southeast Asia core markets | Medium term (2-4 years) |
| Accelerated adoption of 5G-enabled industrial IoT networks | +2.20% | Japan, South Korea, Singapore, with spillover to APAC | Short term (≤ 2 years) |
| Government incentives for smart-factory automation | +2.10% | China, India, with policy influence across APAC | Long term (≥ 4 years) |
| Cost pressure from rising intra-Asia wages pushing warehouse automation | +1.90% | Vietnam, Thailand, Malaysia, Indonesia | Medium term (2-4 years) |
| Surge in dark-store micro-fulfillment models | +1.70% | Urban centers across APAC, early adoption in Singapore, Hong Kong | Short term (≤ 2 years) |
| ESG-driven demand for energy-efficient material handling systems | +1.40% | Global, with regulatory influence from Japan, Australia | Long term (≥ 4 years) |
| Source: Mordor Intelligence | |||
Booming E-commerce Fulfilment Centers Across Tier-2 Asian Cities
The construction boom of automation-ready warehouses in cities such as Chengdu, Pune, and Surabaya sharply elevates demand for standardized yet scalable systems. Operators must harmonize global best practices with local infrastructure constraints, prompting integrators to design modular platforms that support phased rollouts and localized spare-parts ecosystems. Retailers targeting one-day delivery windows view automated picking, sorting, and storage as non-negotiable capabilities, spurring multi-year procurement pipelines that underpin the Asia Pacific automated material handling and storage systems market.[2]Cainiao, “Expansion of Southeast Asia Logistics Network,” alizila.com
Accelerated Adoption of 5G-Enabled Industrial IoT Networks
Private 5G networks shrink latency to sub-10 milliseconds, enabling real-time fleet orchestration, synchronized AMR swarms, and cloud-based digital twins. Early adopters in Seoul and Yokohama report double-digit productivity gains and 30% reductions in unplanned downtime as predictive maintenance algorithms mature.[3]GSMA, “5G Industrial IoT Private Networks,” gsma.com The connectivity layer also underwrites new service models such as remote performance monitoring and outcome-based service contracts, strengthening the recurring-revenue profile of the Asia Pacific automated material handling and storage systems market.
Government Incentives for Smart-Factory Automation
China’s Ministry of Industry and Information Technology subsidizes up to 20% of eligible automation capex, while India’s Production Linked Incentive schemes provide incremental cash disbursements tied to output growth. Such policies mitigate payback risk and expand addressable demand among small and midsize manufacturers, broadening the Asia Pacific automated material handling and storage systems market customer base.[4]Invest India, “Production Linked Incentive Schemes,” investindia.gov.in
Cost Pressure from Rising Intra-Asia Wages Pushing Warehouse Automation
Logistics wages in Ho Chi Minh City and Bangkok climbed at a mid-single-digit pace in 2024, compressing operating margins for export-oriented enterprises. Management teams now schedule automation feasibility studies two to three years earlier than originally planned, with a strong focus on AMR-based order picking and robotic palletizing that can deliver a two-year payback even under conservative throughput scenarios.
Restraints Impact Analysis*
| Restraint | (~) % Impact on CAGR Forecast | Geographic Relevance | Impact Timeline |
|---|---|---|---|
| High initial capex and long ROI cycles for SMEs | -1.80% | Developing APAC economies, particularly Indonesia, Philippines | Medium term (2-4 years) |
| Fragmented intra-Asian safety regulations complicating standardization | -1.20% | ASEAN markets with varying compliance frameworks | Long term (≥ 4 years) |
| Cyber-security vulnerabilities in connected automation fleets | -0.90% | Global, with heightened concern in Japan, Singapore | Short term (≤ 2 years) |
| Limited grid power quality in developing economies hampering uptime | -0.70% | Indonesia, Philippines, Vietnam rural areas | Medium term (2-4 years) |
| Source: Mordor Intelligence | |||
High Initial Capex and Long ROI Cycles for SMEs
Small and midsize exporters in Jakarta and Manila often confront upfront project costs equalling 1-2 years of free cash flow. Even with vendor financing, a three-to-five-year payback stretches risk tolerance, delaying purchase decisions and marginally tempering the Asia Pacific automated material handling and storage systems market growth trajectory.
Cyber-security Vulnerabilities in Connected Automation Fleets
Ransomware directed at human-machine interfaces and warehouse management databases disrupted material flows in several Singapore sites during 2024, revealing latent cyber-security gaps. Enterprises now insist on zero-trust architectures and periodic penetration testing, adding complexity and incremental cost to new installations.
*Our forecasts treat driver/restraint impacts as directional, not additive. The impact forecasts reflect baseline growth, mix effects, and variable interactions.
Segment Analysis
By Product Type: Software Solutions Drive Next-Generation Optimization
The software sub-segment is on track to log a 14.12% CAGR to 2031, reflecting the shift from basic control logic to analytics-enabled orchestration. Advanced warehouse management and digital-twin suites allow predictive slotting and dynamic order batching, bolstering throughput by up to 20% in several Shanghai consumer-electronics facilities. While hardware sustains the bulk of 2024 spending, software-centric value propositions increasingly sway capital-allocation committees, expanding the Asia Pacific automated material handling and storage systems market size among data-mature operators.
Heightened demand for cloud-native applications fuels vendor competition centered on open APIs and edge-to-cloud cybersecurity layers. Providers that bundle software subscriptions with lifecycle services realize higher margins and stickier customer relationships, solidifying long-term revenue streams within the Asia Pacific automated material handling and storage systems market.


By Equipment Type: AMR Technology Reshapes Warehouse Flexibility
AMRs outperform legacy AGVs by navigating dynamic racks and tight aisles without infrastructure-embedded guidance, cutting deployment time by half and accommodating frequent SKU re-profiling. As a result, AMR shipments advance at a 14.78% CAGR, reallocating capital flows away from fixed conveyor expansions toward robot fleets managed by AI-based traffic software.
Automated storage and retrieval systems remain essential in high-throughput omnichannel nodes, though buyers increasingly couple them with AMR-led picking zones. Palletizing robots gain traction among beverage bottlers seeking ergonomic risk mitigation, reinforcing the diversity of demand across the Asia Pacific automated material handling and storage systems market.
By End-user Industry: E-grocery Dark Stores Accelerate Automation Adoption
Dark-store operators emphasize sub-20-minute delivery windows, necessitating goods-to-person stations, high-speed sorters, and micro-shuttles. These requirements underlie the 14.47% CAGR forecast, far surpassing growth in traditional retail distribution. At the same time, automotive assemblers intensify AMR and ASRS investments to align parts flow with electrified vehicle platforms, supporting continued revenue upside for the Asia Pacific automated material handling and storage systems market.
Pharmaceutical manufacturers expand cold chain automation to safeguard product integrity, while semiconductor fabs deploy Class-1 clean-room compliant robots that achieve micron-level positioning accuracy, extending addressable use cases across regulated industries.
By Function: Sorting Applications Lead Growth Trajectory
Cross-border parcel growth averages double digits, forcing operators in Kuala Lumpur and Shenzhen to upgrade from manual chute sorting to vision-guided loop sorters. Segment revenue thereby accelerates at a 14.95% CAGR, eclipsing gains in storage though the latter still commands the single-largest 34.96% revenue share of the Asia Pacific automated material handling and storage systems market size.
Transportation lines relying on modular conveyor blocks integrate seamlessly with AMR fleets, enabling “dynamic hand-offs” that raise facility utilization. Packaging and palletizing record incremental gains as robotics prices continue to decline, making advanced end-of-line automation accessible to mid-tier exporters.
Geography Analysis
China’s 41.68% 2025 revenue share mirrors its expansive manufacturing footprint and over 30,000 certified smart factories subsidized by the central government. Domestic vendors deliver price-competitive AMR and shuttle systems, accelerating uptake in lower-tier provinces and reinforcing the Asia Pacific automated material handling and storage systems market leadership position.
India’s 14.72% CAGR through 2031 stems from converging incentives, including duty credits on capital goods and tax holidays in logistics parks. E-commerce majors finance purpose-built dark stores in Lucknow, Coimbatore, and Guwahati, embedding scalable automation from day one to achieve nationwide two-day service levels without prohibitive labour overhead.
Japan and South Korea demonstrate steady replacement cycles, emphasizing AI-augmented software overlays that extend asset life. Australia and Singapore, both grappling with acute warehouse labour shortages, accelerate conversions to fully automated high-bay facilities. Emerging Southeast Asian economies such as Thailand and Indonesia prioritize phased automation, often beginning with AMR pilots before expanding to ASRS installations, cumulatively enlarging the Asia Pacific automated material handling and storage systems market.
Competitive Landscape
The competitive field is moderately concentrated, with the top five suppliers controlling approximately 60% of 2024 regional revenue. Daifuku leverages a dense service footprint to win long-term maintenance contracts, while KION Group localized assembly in Xiamen to shorten lead times and comply with country-of-origin rules. SSI Schaefer reported EUR 2.0 billion (USD 2.2 billion) 2024 revenue, aided by large-scale projects in Indonesia and Malaysia.
Regional specialists intensify rivalry by offering turnkey AMR portfolios bundled with cloud analytics. Geekplus expanded joint ventures with integrators in Malaysia and Vietnam, capturing fast-moving retail projects that require highly adaptive fleets. VisionNav Robotics addresses niche autonomous forklift demand, and Grey Orange positions AI-powered orchestration software as a differentiator in multi-vendor environments. Strategic alliances among component providers, telecom operators, and cloud platforms proliferate, underscoring the software-defined evolution of the Asia Pacific automated material handling and storage systems market.
Asia Pacific Automated Material Handling And Storage Systems Industry Leaders
Kardex Group
KION GROUP AG
JBT Corporation
Jungheinrich AG
SSI Schaefer AG
- *Disclaimer: Major Players sorted in no particular order


Recent Industry Developments
- October 2024: AutoStore opened a Thailand factory to regionalize production and cut delivery cycles.
- September 2024: SSI Schaefer posted record 2024 revenue of EUR 2.0 billion (USD 2.2 billion) driven by strong APAC growth.
- August 2024: KION Group upgraded its APAC Automation Center of Excellence in Xiamen, China.
- July 2024: K.Hartwall acquired Retailquip to broaden reach across Australia and New Zealand.


Asia Pacific Automated Material Handling And Storage Systems Market Report Scope
Automated material handling equipment streamlines operations by reducing human intervention. The growing appetite for automation, bolstered by advancements in robotics, wireless tech, and autonomous vehicles, has reshaped industries spanning food and beverages, retail, manufacturing, pharmaceuticals, and logistics.
The Asia-Pacific automated material handling and storage systems market is segmented by product type (hardware, software, services), by equipment type (mobile robots (automated guided vehicles (automated forklift, automated tow/tractor/tug, unit load, assembly line, special purpose), autonomous mobile robots), automated storage and retrieval systems (fixed aisle, carousel, vertical lift module), automated conveyors (belt, roller, pallet, overhead), palletizer (conventional, robotic), sortation system), end-user industry (airport, automotive, food and beverage, retail/warehousing/distribution centers/logistics centers, general manufacturing, pharmaceuticals, post and parcel, electronics and semiconductor manufacturing, other end-user industries), and country. The market sizes and forecasts are provided in terms of value (USD) for all the above segments.
By Product Type
| Hardware |
| Software |
| Services |
By Equipment Type
| Mobile Robots | Automated Guided Vehicle (AGV) | Automated Forklift |
| Automated Tow / Tractor / Tug | ||
| Unit Load | ||
| Assembly Line | ||
| Special Purpose | ||
| Autonomous Mobile Robots (AMR) | ||
| Automated Storage and Retrieval System (ASRS) | Fixed Aisle | |
| Carousel | ||
| Vertical Lift Module | ||
| Automated Conveyor | Belt | |
| Roller | ||
| Pallet | ||
| Overhead | ||
| Palletizer | Conventional | |
| Robotic | ||
| Sortation System |
By End-user Industry
| Airport |
| Automotive |
| Food and Beverage |
| Retail / Warehousing / Distribution Centres / Logistic Centres |
| General Manufacturing |
| Pharmaceuticals |
| Post and Parcel |
| Electronics and Semiconductor Manufacturing |
| Other End-user Industries |
By Function
| Storage |
| Transportation |
| Sorting |
| Packaging / Palletising |
| Assembly / Kitting |
By Country
| China |
| Japan |
| India |
| South Korea |
| Australia |
| Indonesia |
| Thailand |
| Singapore |
| Malaysia |
| Taiwan |
| Rest of Asia Pacific |
| By Product Type | Hardware | ||
| Software | |||
| Services | |||
| By Equipment Type | Mobile Robots | Automated Guided Vehicle (AGV) | Automated Forklift |
| Automated Tow / Tractor / Tug | |||
| Unit Load | |||
| Assembly Line | |||
| Special Purpose | |||
| Autonomous Mobile Robots (AMR) | |||
| Automated Storage and Retrieval System (ASRS) | Fixed Aisle | ||
| Carousel | |||
| Vertical Lift Module | |||
| Automated Conveyor | Belt | ||
| Roller | |||
| Pallet | |||
| Overhead | |||
| Palletizer | Conventional | ||
| Robotic | |||
| Sortation System | |||
| By End-user Industry | Airport | ||
| Automotive | |||
| Food and Beverage | |||
| Retail / Warehousing / Distribution Centres / Logistic Centres | |||
| General Manufacturing | |||
| Pharmaceuticals | |||
| Post and Parcel | |||
| Electronics and Semiconductor Manufacturing | |||
| Other End-user Industries | |||
| By Function | Storage | ||
| Transportation | |||
| Sorting | |||
| Packaging / Palletising | |||
| Assembly / Kitting | |||
| By Country | China | ||
| Japan | |||
| India | |||
| South Korea | |||
| Australia | |||
| Indonesia | |||
| Thailand | |||
| Singapore | |||
| Malaysia | |||
| Taiwan | |||
| Rest of Asia Pacific | |||


Key Questions Answered in the Report
What is the projected 2031 value of United States material handling leasing and financing?
The market is forecast to reach USD 3.44 billion by 2031, reflecting a 15.43% CAGR over 2026-2031.
Which equipment category is growing fastest in U.S. warehouse financing?
Automated guided vehicles lead with a 16.02% CAGR forecast through 2031 as firms accelerate automation.
How do Section 179 deductions influence equipment leasing decisions?
Lessees can expense up to USD 1.22 million immediately, making operating leases the preferred structure for fast-turnover fleets.
Why are sale-and-leaseback deals becoming popular among warehouse operators?
They unlock trapped equity from existing fleets, funding automation upgrades without increasing balance-sheet debt, and are projected to grow at 16.81% CAGR.
Which regions are hotspots for new leasing activity?
California's Inland Empire, Texas distribution corridors, and the Southeast logistics belt exhibit the highest growth due to port modernization and e-commerce fulfillment expansion.
Page last updated on:


