Market Overview
| Study Period | 2020 - 2031 |
|---|---|
| Forecast Data Period | 2026 - 2031 |
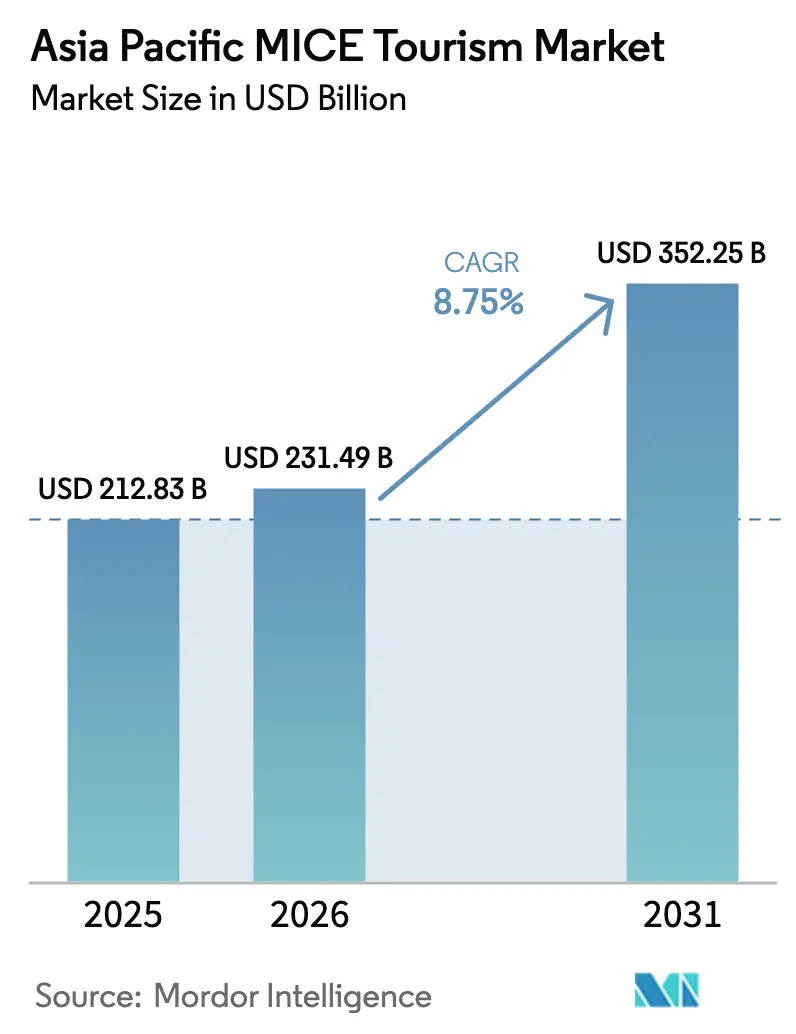
| Base Year Market Size (2025) | USD 212.83 Billion |
| Market Size (2026) | USD 231.49 Billion |
| Market Size (2031) | USD 352.25 Billion |
| Growth Rate (2026 - 2031) | 8.75% CAGR |
| Market Concentration | Low |
Major Players *Disclaimer: Major Players sorted in no particular order Image © Mordor Intelligence. Reuse requires attribution under CC BY 4.0. | |
Asia Pacific MICE Tourism Market Analysis by Mordor Intelligence
The Asia-Pacific MICE market size is expected to grow from USD 212.83 billion in 2025 to USD 231.49 billion in 2026 and is forecast to reach USD 352.25 billion by 2031 at 8.75% CAGR over 2026-2031. This up-cycle reflects the region’s swift post-pandemic rebound, the acceleration of hybrid formats, and steady gains in corporate travel spending, which is projected to reach USD 800 billion by 2027[1]Source: Global Business Travel Association, “BTI Outlook 2025,” gbta.org . Elevated business confidence is enabling companies to lock in multi-year event calendars even as geopolitical and cost risks persist. Large-scale venue expansions, airline capacity restoration, and digital sourcing platforms are lowering friction in cross-border event execution, while sustainability targets are prompting planners to prefer venues with demonstrable energy-efficiency certifications. Technology integration, especially AI-enabled translation and attendee analytics, is reshaping event design, shortening planning timelines, and allowing organizers to monetize virtual audiences.
Key Report Takeaways
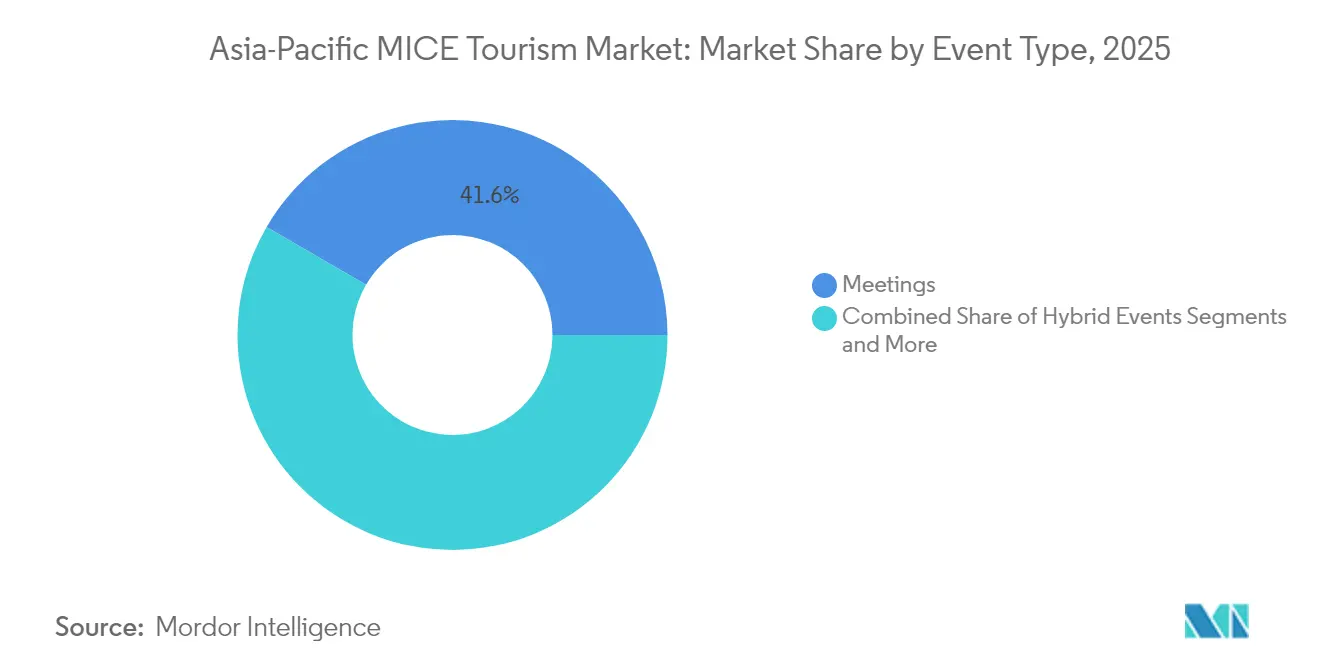
- By event type, meetings led with 41.62% revenue share in 2025, while hybrid events are set to expand at a 11.72% CAGR through 2031 in the Asia-Pacific MICE market.
- By industry vertical, IT and telecommunications captured 23.86% of the Asia-Pacific MICE market share in 2025; healthcare is forecast to grow at an 11.05% CAGR to 2031.
- By venue, convention and exhibition centers accounted for 44.85% of the Asia-Pacific MICE market size in 2025; cruise and alternative venues are advancing at a 12.54% CAGR.
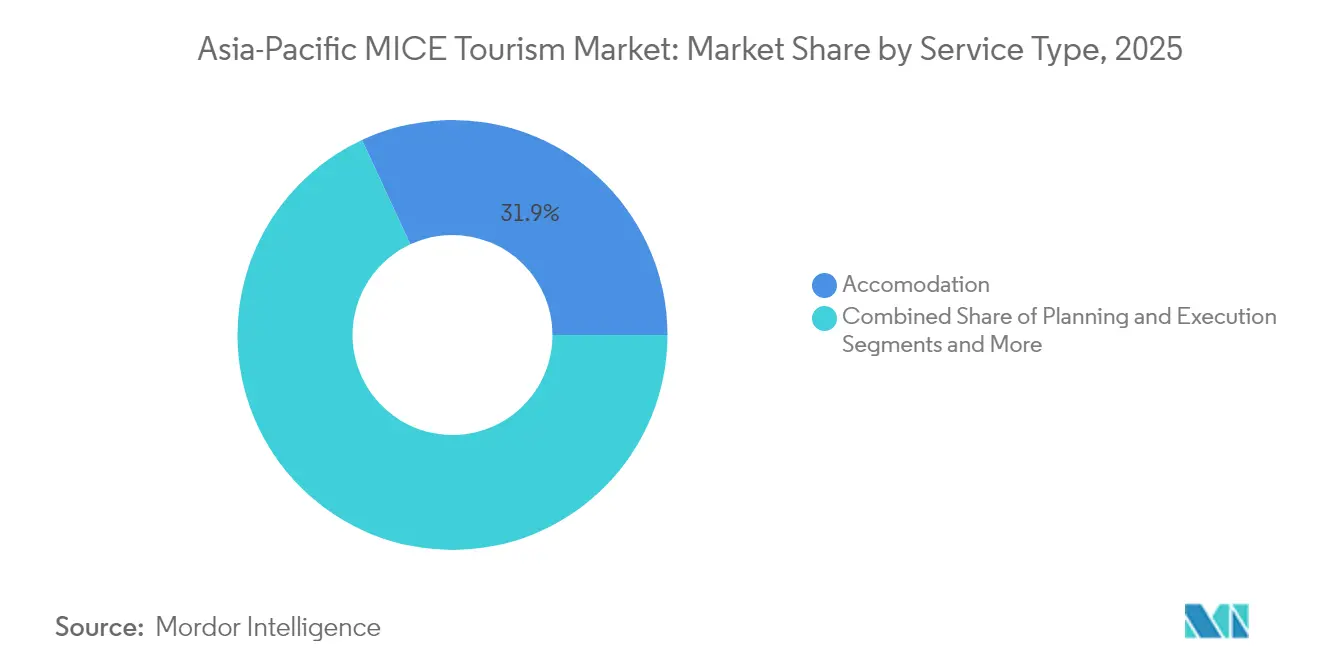
- By service, accommodation services controlled a 31.92% share in 2025, whereas transportation services are projected to post the fastest 13.88% CAGR in the Asia-Pacific MICE market.
- By geography, China held a 34.21% share in 2025, while Southeast Asia is expected to record a 12.41% CAGR to 2031.
- The top five providers, CWT Meetings & Events, BCD Meetings & Events, MCI Group, Reed Exhibitions Asia, and Pico Far East Holdings collectively commanded a significant share of the Asia-Pacific MICE market in 2025.
Note: Market size and forecast figures in this report are generated using Mordor Intelligence’s proprietary estimation framework, updated with the latest available data and insights as of 2026.
Asia Pacific MICE Tourism Market Trends and Insights
Drivers Impact Analysis*
| Driver | (~) % Impact on CAGR Forecast | Geographic Relevance | Impact Timeline |
|---|---|---|---|
| Digital Transformation and Hybrid Event Formats | +2.1% | Global, with early adoption in Singapore, Japan, South Korea | Short term (≤ 2 years) |
| Rapid Economic Growth in Emerging Markets | +1.8% | Southeast Asia, India, with spillover to China | Medium term (2-4 years) |
| Government Initiatives to Promote Business Tourism | +1.5% | Singapore, Thailand, Japan, Australia | Medium term (2-4 years) |
| Rising Presence of Global and Regional Corporations | +1.3% | China, India, Southeast Asia core markets | Long term (≥ 4 years) |
| Source: Mordor Intelligence | |||
Digital Transformation and Hybrid Event Formats
Integration of artificial intelligence, live-streaming, and immersive technologies is broadening audience reach and compressing event budgets. Real-time translation, automated camera direction, and 24/7 chatbots are standardising multilingual engagement and reducing on-site staff requirements. Corporations value the ability to cut travel-related emissions by 27% through advanced booking algorithms and virtual attendance options. Early adopting destinations such as Singapore and Seoul have built national grant schemes that link venue operators with domestic tech start-ups, fostering first-mover advantages. Market research shows that 44% of regional planners rank AI capabilities as the leading differentiator when selecting a venue partner.
Rapid Economic Growth in Emerging Markets
Southeast Asia’s GDP trajectory is spawning new regional headquarters that demand sophisticated MICE solutions. Public-private financing frameworks, such as Australia’s USD 2 billion engagement facility, are helping cities like Jakarta and Ho Chi Minh City build integrated convention districts. Destination marketing bodies in Thailand and Vietnam are aggressively pursuing large Chinese corporates by offering bundled visa processing and tax-rebate packages. Rising disposable incomes have lifted delegate volumes, with 78% of Asia-Pacific buyers confirming larger trip counts in 2024. New builds ranging from conference-ready hotels to stand-alone halls signal durable pipeline momentum.
Government Initiatives to Promote Business Tourism
Policy makers are prioritising business travel as an economic accelerant. Singapore’s Tourism 2040 plan aims to triple MICE revenue by clustering meeting space, retail, and transport nodes in a downtown hub[2]Source: Singapore Tourism Board, “Tourism 2040 Strategy Framework,” stb.gov.sg. Japan’s Global MICE Strong Cities initiative designates flagship convention locales and fast-tracks visa processing for high-value events[3]Source: Japan Tourism Agency, “Global MICE Strong Cities Programme,” mlit.go.jp. Thailand’s Southern MICE District Phuket Series showcases how specialised zones can unlock destination differentiation and spread visitor spending beyond core capitals. Impact studies from landmark centers report multiplier effects exceeding JPY 231 billion in annual regional GDP.
Rising Presence of Global and Regional Corporations
Multinationals are deepening Asia-Pacific footprints, driving sustained demand for board-level meetings, product roll-outs, and training seminars. Singapore has registered a 20% jump in corporate arrivals linked to headquarters relocations. Service suppliers are responding through multi-property alliances that let clients stage rotational programmes without renegotiating each city contract. Capital inflows into digital event management suites—underscored by a USD 20 million expansion budget at a leading travel management company—show confidence in future delegate volumes across verticals such as technology and healthcare.
Restraints Impact Analysis*
| Restraint | (~) % Impact on CAGR Forecast | Geographic Relevance | Impact Timeline |
|---|---|---|---|
| High Cost of MICE Event Organization | -1.2% | Global, with acute impact in premium destinations like Singapore, Japan | Short term (≤ 2 years) |
| Uneven Infrastructure Development Across Regions | -0.9% | Southeast Asia emerging markets, secondary cities in China and India | Medium term (2-4 years) |
| Fluctuating Corporate Budgets and Travel Policies | -0.7% | Global, with pronounced impact during economic uncertainty cycles | Short term (≤ 2 years) |
| Geopolitical Tensions and Instability | -0.8% | China-US corridor, with spillover to regional trade routes | Medium term (2-4 years) |
| Source: Mordor Intelligence | |||
High cost of MICE event organization
Venue rents, accommodation rates, and catering prices have climbed sharply in top-tier cities, prompting 73% of organizers to downgrade to four-star hotels or explore non-traditional sites such as cruise ships. Cost inflation is partly offset by greener hotels, which operate 17% below the price of less-efficient properties by passing energy savings to clients. Buyers expect bigger travel budgets in 2025, suggesting that corporations will absorb moderate price rises to retain live engagement. AI-powered sourcing platforms are shortening request-for-proposal cycles by 64%, enabling planners to negotiate stronger volume discounts.
Geopolitical tensions and instability
Diplomatic frictions create headline risk for marquee congresses that require multi-year lead times. Planners are mitigating exposure through hybrid contingencies, diversified venue selection, and modular program design. Cross-border policy frameworks, such as Australia’s Southeast Asia engagement strategy, offer stability corridors that keep delegate flows resilient. Technology and healthcare conferences show higher risk tolerance, given their mission-critical content, whereas discretionary product launches are more vulnerable to sentiment swings.
*Our forecasts treat driver/restraint impacts as directional, not additive. The impact forecasts reflect baseline growth, mix effects, and variable interactions.
Segment Analysis
By Event Type: Hybrid formats drive innovation
Meetings retained 41.62% revenue in 2025, anchoring the Asia-Pacific MICE market through predictable booking cycles and broad enterprise acceptance. Hybrid events, however, are growing at a 11.72% CAGR, converting latent virtual audiences into monetisable delegate pools. Large convention organisers deploy blockchain-enabled networking tokens to personalise agendas and measure sponsor return on investment. Conventions and exhibitions maintain critical mass for global launches, while incentive travel holds premium pricing due to its motivational impact. The Asia-Pacific MICE market size for the hybrid segment is projected to rise swiftly as more corporates embed digital components in standard meeting policies. Experiential design trends AR walk-throughs, ESG reporting dashboards, and contactless registration, give hybrid formats a competitive edge.
The Asia-Pacific MICE market benefits from platforms that integrate gamification, AI translation, and real-time sentiment analytics. Such tools help planners curate content pathways, extend on-demand viewing windows, and track engagement KPIs beyond headcount. Small meetings are expected to rise 78% in 2025, reflecting a return-to-office push and the value of face-to-face collaboration. Analysts note that incentive itineraries increasingly merge CSR activities with wellness programmes, aligning corporate culture with sustainability metrics.


By Industry Vertical: Healthcare acceleration outpaces IT leadership
IT and telecommunications contributed 23.86% of the Asia-Pacific MICE market share in 2025, owing to continuous product releases and developer conferences. Healthcare is forecast to post the fastest 11.05% CAGR to 2031 as pharmaceutical forums, regulatory workshops, and medical device expos multiply. The Asia-Pacific MICE market size for healthcare gatherings is expanding alongside new vaccine pipelines and cross-border clinical trials that mandate in-person peer review. Financial services, manufacturing, and energy continue to schedule regulatory briefings, supply-chain summits, and renewable-energy roadshows, respectively.
Growth in healthcare events is supported by purpose-built auditoriums, simulation labs, and translation booths that comply with medical accreditation standards. Destination appeal rises when ancillary attractions, such as heritage tours and culinary experiences, augment delegate itineraries. Venue operators are upgrading infection-control protocols and telemedicine demo zones to cement credibility with hospital groups and life-science firms.
By Venue Type: Alternative venues challenge convention dominance
Convention and exhibition centers commanded a 44.85% share in 2025, but cruise ships and unconventional sites are growing at a 12.54% CAGR on the strength of experiential differentiation. The Asia-Pacific MICE market size for cruise-based gatherings is expanding as corporates view all-inclusive packages as a hedge against rising city-center costs. Hotels and resorts secure mid-market demand through bundled rooms-plus-meeting packages, while corporate campuses meet confidential R&D requirements. High-profile projects such as Marina Bay Sands’ new tower and 15,000-seat arena attest to the resilience of flagship venues.
Alternative sites benefit from refreshed hardware—larger LED backdrops, 5G connectivity, and renewable-energy integration—that ensures broadcast-quality streaming and reduced carbon footprints. Urban entertainment complexes reposition under-utilised retail spaces for pop-up experiences, enabling organisers to match niche delegate profiles with themed environments.
By Service Type: Transportation growth reflects mobility demands
Accommodation held 31.92% revenue share in 2025, mirroring the Asia-Pacific MICE market’s reliance on integrated stay packages. Transportation services are on track for a 13.88% CAGR as planners juggle multi-city itineraries and door-to-door sustainability commitments. Investments in high-speed rail corridors and airport capacity expansions encourage organisers to extend programmes to secondary cities. The Asia-Pacific MICE market size for transport logistics is increasing as corporates prioritise seamless delegate movement. Planning and execution outsourcing remains stable, underpinned by compliance complexity and language diversity.
Event apps that integrate flight trackers, ride-share codes, and carbon calculators improve delegate satisfaction and help corporates achieve ESG targets. Venue operators located near inter-modal hubs, such as conference halls within 20 minutes of major airports, command pricing premiums by cutting journey time.
By Organisation Size: SME growth outpaces enterprise stability
Large enterprises controlled 58.15% of spending in 2025 through recurring leadership forums and global kick-offs. Small and medium enterprises are posting a 12.87% CAGR, reflecting democratized access to venue sourcing portals and pay-as-you-go virtual platforms. The Asia-Pacific MICE market size for SME clients is rising as governments subsidise digital adoption costs and local chambers promote export-oriented trade fairs. Cloud-based budgeting tools and modular service bundles enable smaller firms to host investor days and channel partner meets without legacy agency fees.
Regional grants link SMEs with certified event technologists, amplifying their ability to stage professional experiences that rival enterprise standards. Boutique venues with 500–600-seat capacities are in demand for scale-appropriate conferences, offering customisable layouts and hybrid-ready infrastructure.
Geography Analysis
China delivered 34.21% revenue in 2025, anchored by a dense convention network, domestic corporate scale, and state-led cluster strategies. The Asia-Pacific MICE market faces moderating growth in China as maturing demand intersects with visa and geopolitical friction, prompting organisers to hedge with flexible contingency clauses. Provincial hubs are differentiating through sector-specific exhibition districts aligned with industrial specialisations. Beijing and Shanghai retain flagship status due to airlift capacity and international hotel chains, yet second-tier cities are capturing spill-over demand through incentives and lower cost bases.
Southeast Asia is the fastest-growing sub-region at a 12.41% CAGR to 2031. Thailand’s success in securing the 2029 International Horticultural Expo confirms its readiness for mega-events and will inject millions of incremental visitor nights. Vietnam’s hotel pipeline, including new brands in Ho Chi Minh City, is positioning the country as a credible alternative for pharmaceutical launches and regional sales conferences. Malaysia and Indonesia leverage public-private partnerships to standardise service quality and cross-sell multi-city itineraries, while Singapore defends high-yield share by pairing superior connectivity with audited sustainability metrics.
India, Japan, Australia, and South Korea are mature yet innovative. India’s Jio World Convention Centre sets new domestic benchmarks for scale and digital backbone. Japan packages cultural assets with visa facilitations under its Tourism Agency, keeping average daily delegate spending among the region’s highest. Australia invests in Asia-facing air routes and visitor experience upgrades, acting as a bridge market for Western exhibitors. South Korea embeds AI in venue operations and partners with local tech incubators, giving organisers access to real-time analytics and automated language support.
Competitive Landscape
The Asia-Pacific MICE market remains moderately fragmented despite consolidation moves by global intermediaries. The top five providers blend venue sourcing, travel management, and content design, yet technology-first entrants are eroding share through self-service marketplaces. Accor is rolling out a digital meetings ecosystem that ties 5,600 hotels to a unified booking engine, creating scale economies in inventory management. Meanwhile, a leading TMC’s USD 20 million capital injection into its events division signals confidence in revival momentum.
Cvent processed USD 16.5 billion in sourcing volume in 2024, surpassing 2019 records and underscoring platform power. Its acquisition of an AI-based supplier network compresses procurement cycles and democratizes access for SMEs. Pico Group exploits experiential design capabilities—AR, VR, and gamified engagement—to carve defensible niches in brand activation. Regional specialist RX Tradex forecasts double-digit growth by leveraging local language talent and sector-specific databases.
Sustainability credentials are fast becoming table stakes. Venue operators disclose ISO 20121 certifications and embedded renewable-energy systems to qualify for multinational RFPs. Competitors unable to verify carbon footprints risk exclusion from shortlists driven by corporate ESG mandates. Pricing power is shifting toward suppliers that integrate technology, ESG data, and multi-market delivery under a single contract.
Asia Pacific MICE Tourism Industry Leaders
CWT Meetings & Events
BCD Meetings & Events
MCI Group
Reed Exhibitions Asia (RX
Pico Far East Holdings
- *Disclaimer: Major Players sorted in no particular order

Recent Industry Developments
- May 2025: Accor unveiled a global digital meetings and events platform covering 5,600 hotels and 2.5 million m² of event space.
- February 2025: Hyatt formed the Asia-Pacific Meetings & Events Alliance linking nine flagship properties for streamlined multi-city programmes.
- January 2025: Pan Pacific Hotels Group partnered with Tokyu Hotels to launch THE HOTEL HIGASHIYAMA KYOTO TOKYU, A Pan Pacific Hotel.
- September 2024: Pan Pacific Hotels Group partnered with Tokyu Hotels to launch THE HOTEL HIGASHIYAMA KYOTO TOKYU, A Pan Pacific Hotel.


Research Methodology Framework and Report Scope
Market Definitions and Key Coverage
Our study, according to Mordor Intelligence, treats the Asia-Pacific MICE tourism market as all business travel linked to Meetings, Incentives, Conventions, and Exhibitions, including event design, venue rental, lodging, local transport, food services, and on-site technologies incurred inside Asia-Pacific by domestic or inbound delegates.
Scope exclusion: pure leisure trips that are not attached to an organized MICE agenda are outside this assessment.
Segmentation Overview
- By Event Type
- Meetings
- Incentives
- Conventions
- Exhibitions
- Hybrid Events
- By Industry Vertical
- IT and Telecom
- Healthcare and Life Sciences
- BFSI
- Manufacturing
- Energy and Utilities
- Others
- By Venue Type
- Convention and Exhibition Centers
- Hotels and Resorts
- Corporate Campuses / Offices
- Cruise and Alternative Venues
- By Service Type
- Planning and Execution
- Accommodation
- Transportation
- Entertainment and Ancillary
- By Organization Size
- Large Enterprises
- Small and Medium Enterprises
- By Country
- India
- China
- Japan
- Australia
- South Korea
- South East Asia (Singapore, Malaysia, Thailand, Indonesia, Vietnam, and Philippines)
- Rest of Asia-Pacific
Detailed Research Methodology and Data Validation
Primary Research
Mordor analysts held structured interviews and pulse surveys with corporate travel managers, professional conference organizers, venue operators, and tourism-board officials across Greater China, India, Southeast Asia, Japan, and Australia.
These discussions confirmed delegate spend ranges, seasonality shifts, and uptake of hybrid formats, filling gaps left by desk research and guiding final assumptions.
Desk Research
We first collected baseline figures from open agencies such as UNWTO, the World Bank, the Global Business Travel Association, and the Asian Development Bank. We then added visitor counts, visa statistics, and venue pipelines published by tourism boards in China, Singapore, Australia, and India. These public feeds frame the demand pool.
Next, our team checked annual reports of listed hotel groups, airline seat-capacity filings, and construction permits to size supply. Paid databases that Mordor analysts license, including D&B Hoovers for operator revenues and Dow Jones Factiva for regional news flows, helped verify revenue splits and spot one-off shocks. The sources named are illustrative; many other references were reviewed for validation.
Market-Sizing & Forecasting
We build the 2024 base through a top-down reconstruction. Business-purpose arrivals and delegate day counts were multiplied by average on-site spend, which is then split by event type.
Sampled supplier roll-ups (hotel ballroom bookings, convention center calendars, and disclosed ASP × volume from large organizers) provide a bottom-up sense-check, and discrepancies above five percent trigger rework.
Key variables like corporate travel budgets, GDP per capita, hotel RevPAR, upcoming convention space, airline seat kilometers, and hybrid event penetration feed a multivariate regression that projects value through 2030.
Where country-level spend data were missing, we imputed costs using peer-city ratios validated during expert calls.
Data Validation & Update Cycle
Outputs undergo tolerance checks against historic patterns, peer country ratios, and prior editions.
Senior reviewers sign off only after anomalies are resolved.
Reports refresh each year, with mid-cycle tweaks if currency shocks, policy shifts, or major venue launches materially move the market.
Why Mordor's Asia-Pacific MICE Tourism Baseline Earns Decision-Maker Confidence
Published estimates often diverge because firms pick different service baskets, currencies, and refresh timings.
Key gap drivers here include narrower service scope in some studies, varying mix assumptions for hybrid events, and older base years that miss the 2024 rebound.
Benchmark comparison
| Market Size | Anonymized source | Primary gap driver |
|---|---|---|
| USD 212.83 B (2025) | Mordor Intelligence | - |
| USD 200.72 B (2024) | Regional Consultancy A | Excludes cross-border incentive itineraries and keeps 2024 prices frozen |
| USD 191.83 B (2024) | Trade Journal B | Relies on arrivals only, no supplier roll-up, static spend rate |
| USD 441.10 B (2025) | Industry Association C | Uses broader leisure add-ons and aggressive currency uplift |
Taken together, the comparison shows that Mordor's disciplined scope choices, dual-path validation, and annual refresh deliver a balanced baseline that users can trace back to clear, repeatable variables.


Key Questions Answered in the Report
What is the current size of the Asia Pacific MICE market?
The market is valued at USD 231.49 billion in 2026 and is projected to reach USD 352.25 billion by 2031.
Which event type is growing fastest in the Asia Pacific MICE market?
Hybrid events are expanding at 11.72% CAGR through 2031 due to technology-enabled audience reach and cost efficiencies.
Why is healthcare the fastest-growing industry vertical?
Post-pandemic regulatory requirements and the need for in-person medical education are pushing healthcare events to an 11.05% CAGR.
Which geography is the biggest market and which is the fastest-growing?
China leads with 34.21% revenue share in 2025, while Southeast Asia is forecast to grow at 12.41% CAGR to 2031.
How are rising costs affecting the Asia Pacific MICE market?
Higher rents and service inflation are nudging planners toward four-star hotels and alternative venues, yet AI-driven sourcing tools and larger 2025 travel budgets help offset the impact.
Page last updated on:


