
AI In Life Sciences Market Size and Share
Market Overview
| Study Period | 2020 - 2031 |
|---|---|
| Market Size (2026) | USD 4.51 Billion |
| Market Size (2031) | USD 13.64 Billion |
| Growth Rate (2026 - 2031) | 24.78 % |
| Fastest Growing Market | Asia Pacific |
| Largest Market | North America |
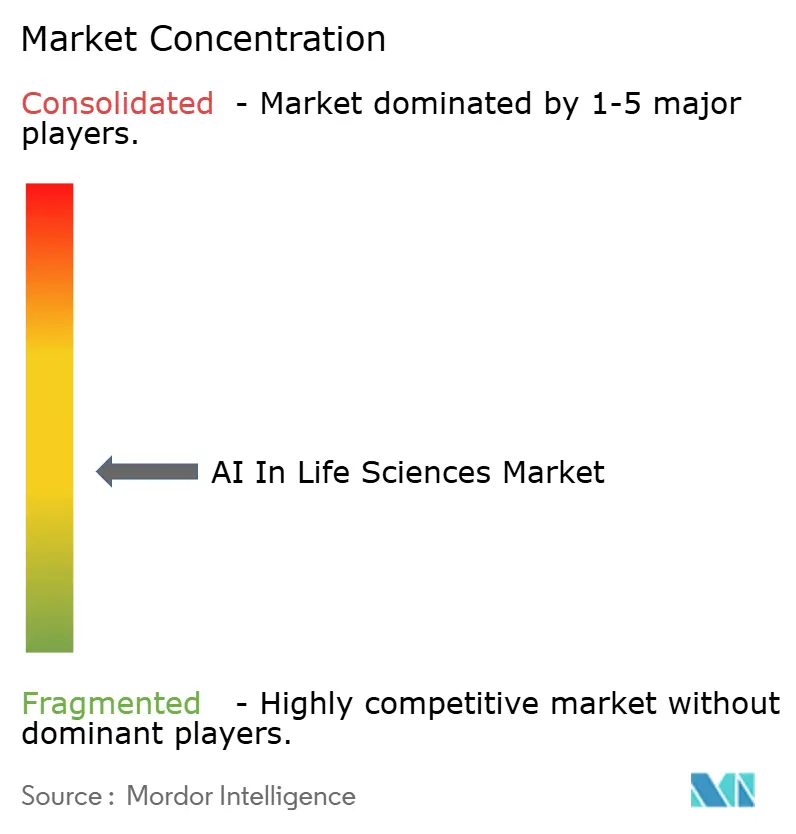
| Market Concentration | Medium |
Major Players *Disclaimer: Major Players sorted in no particular order Image © Mordor Intelligence. Reuse requires attribution under CC BY 4.0. | |
AI In Life Sciences Market Analysis by Mordor Intelligence
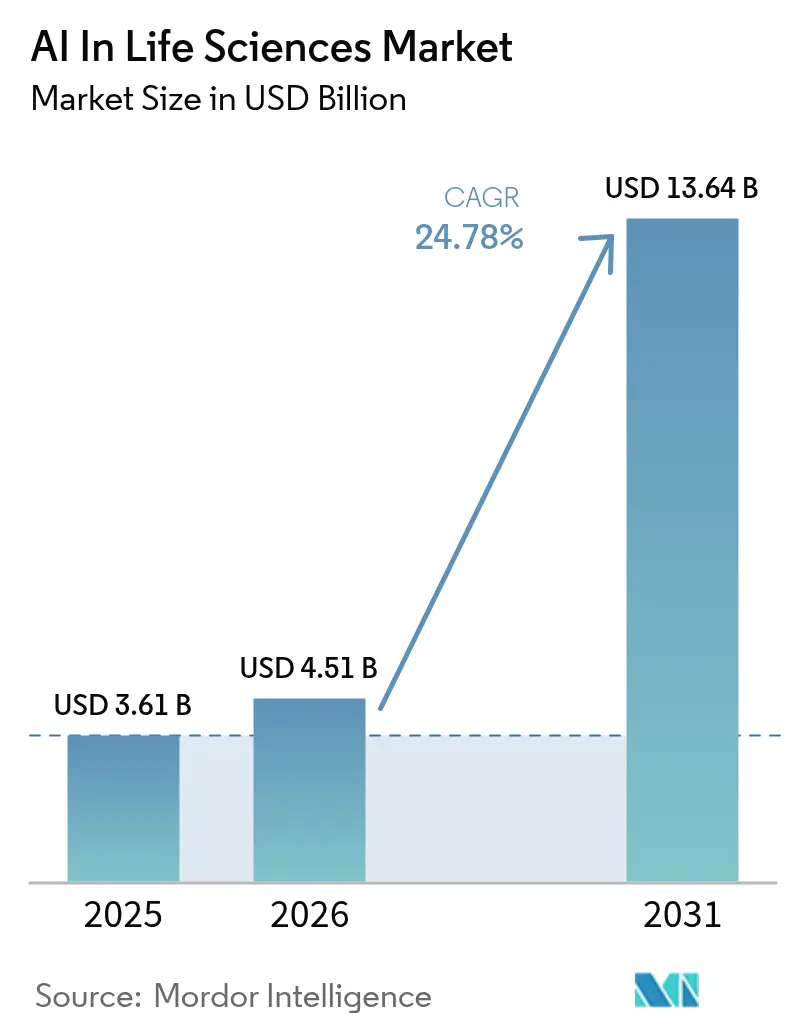
The AI in life sciences market size was valued at USD 3.61 billion in 2025 and estimated to grow from USD 4.51 billion in 2026 to reach USD 13.64 billion by 2031, at a CAGR of 24.78% during the forecast period (2026-2031). Adoption is accelerating because regulators now regard AI-derived biomarkers as legitimate evidence, and because federated data networks are making once-siloed clinical datasets available for model training. A 70% drop in compute cost per molecule achieved through hyperscaler–pharma alliances is widening access to large-scale simulation, while venture capital inflows into generative protein-design platforms have tripled since 2024. At the same time, only 6% of biopharma data meet FAIR standards, highlighting a parallel opportunity for data-quality solutions. Regionally, North America maintains scale advantages in talent and infrastructure, but Asian government programs are translating into the fastest growth outlook.
Key Report Takeaways
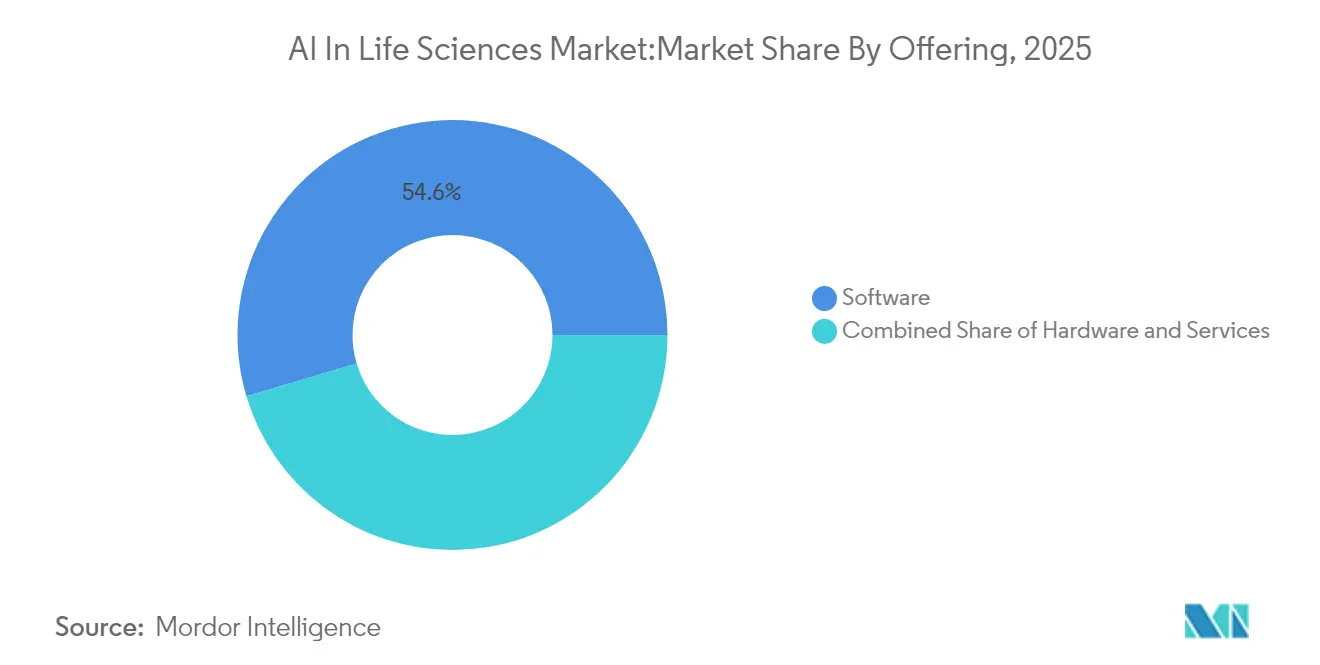
- By offering, software led with 54.60% of the AI in life sciences market share in 2025, while services are projected to record a 22.15% CAGR through 2031.
- By deployment model, cloud platforms accounted for 50.55% of the 2025 revenue base; on-premise solutions are paced for a 16.3% CAGR over 2026-2031.
- By analytics type, predictive systems held 2025 leadership, yet generative models are set for the sharpest upswing at 26.1% CAGR to 2031.
- By application, drug discovery captured 25.60% revenue share in 2025, whereas clinical-trials optimisation is rising at a 20.3% CAGR during the forecast window.
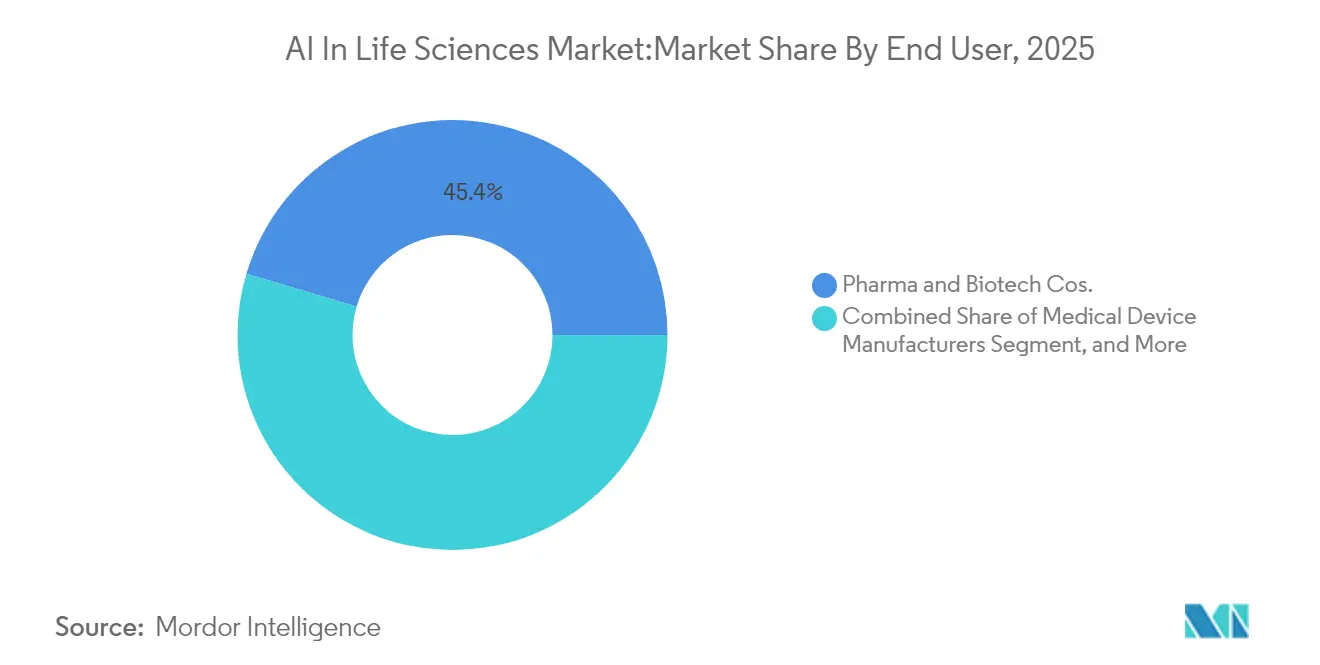
- By end user, pharmaceutical and biotechnology firms controlled 45.40% of 2025 demand; CROs represent the fastest expansion path at 17.2% CAGR to 2031.
- By geography, North America commanded 48.60% revenue share in 2025; Asia is poised for the highest regional CAGR of 21.3% through 2031.
Note: Market size and forecast figures in this report are generated using Mordor Intelligence’s proprietary estimation framework, updated with the latest available data and insights as of 2026.
Global AI In Life Sciences Market Trends and Insights
Drivers Impact Analysis*
| Driver | ( ~ ) % Impact on CAGR Forecast | Geographic Relevance | Impact Timeline |
|---|---|---|---|
| FDA RTOR-enabled AI biomarker approvals | 5.20% | North America; spill-over to Europe | Medium term (2-4 years) |
| EU Health Data Space federated model training | 4.80% | Europe; global multinationals | Long term (≥ 4 years) |
| China Bio-AI pilot programs | 3.70% | Asia, chiefly China | Medium term (2-4 years) |
| Hyperscaler partnerships cutting compute cost | 4.10% | Global; focus in NA and EU | Short term (≤ 2 years) |
| VC surge in generative-protein design | 3.30% | NA and EU; emerging Asia | Medium term (2-4 years) |
| Decentralised-trial mandates | 2.90% | Global early adopters | Medium term (2-4 years) |
| Source: Mordor Intelligence | |||
FDA RTOR-Enabled AI Biomarker Approvals
The US FDA’s Real-Time Oncology Review has shortened review cycles for AI-enabled biomarkers by up to 40%, allowing oncology programmes to reach market far sooner than under legacy pathways. Successful precedent in oncology broadened to neuro-degenerative and rare-disease indications in 2024, signalling regulator confidence in AI-generated endpoints. Each new approval creates knock-on value because the validated biomarker can be reused across separate pipelines, accelerating overall portfolio productivity. With the FDA establishing the global benchmark, other agencies are already evaluating similar expedited tracks, effectively globalising the opportunity.[1]Center for Drug Evaluation and Research, US Food and Drug Administration, “Real-Time Oncology Review Pilot Program,” fda.gov.
EU Health Data Space Unlocking Federated AI Model Training
Effective January 2025, the European Health Data Space (EHDS) is giving life-sciences developers API-based access to harmonised clinical, genomic and imaging datasets across 27 member states. Crucially, federated-learning rules permit model training without physical data transfer, preserving privacy but eliminating a historic barrier of fragmentation. Forecasts point to EUR 11 billion in ten-year efficiency savings via reduced duplication and faster evidence generation. Early adopters are re-architecting pipelines so that algorithms can learn on-site and update centrally—an approach that turns Europe’s stringent privacy stance into a competitive differentiator for compliant vendors.[2]European Commission, “European Health Data Space Factsheet,” ec.europa.eu
China’s 17th Five-Year Bio-AI Plan Fueling above 200 Pilot Programs
China’s latest national plan earmarks AI-biotech convergence as a strategic pillar. More than 200 pilots span genomics, digital pathology and automated chemistry, underpinned by grants and preferential procurement. Provincial competition for funding is producing dense regional clusters that combine local manufacturing with academic research, reducing reliance on imported software stacks. The policy blueprint targets an incremental USD 25 billion uplift to the domestic health-tech economy and positions Chinese suppliers to export turnkey AI solutions once regulatory equivalence with global norms is demonstrated.[3]State Council Information Office of the People’s Republic of China, “14th and 15th Five-Year Plans for Bio-Economy,” gov.cn
Hyperscaler Partnerships Cutting Compute Cost per Molecule by 70%
Joint engineering initiatives between hyperscalers and drug developers are optimising hardware configurations for molecular simulations, slashing per-molecule compute expense by roughly 70% since 2024. A prime example is NVIDIA’s collaboration with Recursion Pharmaceuticals, pairing customised GPU clusters with graph-based drug-discovery algorithms. Cost efficiency means that libraries of billions of synthetically accessible compounds can be screened in days rather than months, improving hit-rate probabilities and shrinking early-stage timelines. Companies securing preferred access to such infrastructure are winning disproportionate deal flow, as smaller peers struggle with inflated spot prices for scarce GPUs.[4]NVIDIA Corporation, “Recursion and NVIDIA Expand Compute Collaboration,” nvidia.com
Restraints Impact Analysis*
| Restraint | ( ~ ) % Impact on CAGR Forecast | Geographic Relevance | Impact Timeline |
|---|---|---|---|
| EU AI Act extending CE-mark timelines | −3.1% | Europe; companies marketing to EU | Medium term (2-4 years) |
| Low FAIR-compliant data in biopharma | −2.8% | Global, especially mature markets | Short term (≤ 2 years) |
| GPU shortage raising inference cost | −2.4% | Global; acute in NA and EU | Short term (≤ 2 years) |
| IP ambiguity on AI-generated molecules | −1.9% | Asia (Japan and South Korea) | Medium term (2-4 years) |
| Source: Mordor Intelligence | |||
EU AI Act Delaying CE-Mark Timelines for Clinical AI Systems
Classifying most clinical algorithms as “high-risk,” the EU AI Act, in force since August 2024, layers additional conformity-assessment audits onto the CE-mark process. Smaller innovators, often venture-backed, are hardest hit because they lack in-house regulatory teams, leading to launch delays estimated at 6–12 months for imaging and decision-support tools. Although large manufacturers can absorb the cost, the bottleneck is temporarily reducing the funnel of European AI devices, which in turn slows downstream data generation needed for algorithm refinement.
Only 6% of Biopharma Data Are FAIR-Compliant
Industry surveys indicate that just 6% of current R&D data satisfy FAIR principles, limiting machine-learning models’ ability to generalise across cohorts. Poor metadata, siloed storage and inconsistent ontologies inflate the data-wrangling phase that precedes model training. Organisations that invested early in knowledge graphs and data-governance offices show materially higher model accuracy, underlining the economic case for quality improvements. Vendors offering automated curation pipelines and ontology alignment stand to benefit as pharma budgets re-balance toward foundational data assets.
*Our forecasts treat driver/restraint impacts as directional, not additive. The impact forecasts reflect baseline growth, mix effects, and variable interactions.
Segment Analysis
By Offering: Software Dominates, Services Accelerate
The software component generated 54.60% of the 2025 revenue base, establishing code libraries and algorithm suites as the primary value driver within the AI in life sciences market. Leading platforms analyse omics data, suggest candidate molecules and predict trial enrolment feasibility, embedding directly into pharmaceutical pipelines. Vendors increasingly differentiate through explainability modules that document model lineage for auditors. Services, though representing a smaller slice, are expanding at a 22.15% CAGR across 2026-2031 as clients seek integration specialists who can align AI outputs with regulated workflows. Managed-service contracts that bundle software licences with validation protocols and post-market performance monitoring are gaining traction because they transfer compliance overhead from sponsors to vendors.Hardware, while modest in revenue share, is strategically important. Specialised accelerator boards designed for stochastic differential-equation solvers and high-throughput docking address current GPU supply constraints. Enterprises are adopting mixed infrastructure strategies—on-premise clusters for sensitive data and burst-to-cloud capacity for large screening jobs—to hedge against supply volatility and enforce data-residency rules. The AI in life sciences market size attached to hardware segments is forecast to grow at a mid-teens rate as new semiconductor entrants release domain-specific architectures.



By Deployment Model: Cloud Platforms Enabling Collaboration
Cloud deployments captured 50.55% of spending in 2025, reflecting the sector’s recognition that elastic computing and distributed collaboration outweigh initial security concerns. Hyperscalers now offer health-data-compliant environments with pre-configured audit logs, reducing validation cycles for 21 CFR Part 11 and GDPR. Multi-tenant sandboxing allows academic consortia and biotechs to share de-identified cohorts, accelerating external innovation. Hybrid architectures, however, are becoming the default. Organisations retain ultra-sensitive genomic archives on-premise but run federated analytic workloads in the cloud, improving utilisation rates without sacrificing sovereignty. On-premise solutions, boosted by sovereign-cloud regulations and latency-critical use cases, are projected to deliver a 16.3% CAGR through the period.Persistent data silos remain a barrier: 81% of surveyed firms cite difficulty reconciling EHR, imaging and omics data within a single environment. Consequently, platform vendors are packaging built-in extract-transform-load utilities and ontology mappers. This dynamic supports service-led revenue streams that complement subscription fees from software licences, anchoring long-run renewal rates within the AI in life sciences market.
By Analytics Type: Generative AI Reshaping Discovery
Predictive analytics retained top-line leadership in 2025, underpinned by statistical and machine-learning models that forecast toxicity, patient response and trial enrolment dynamics. Such capabilities are credited with raising Phase II success odds by up to 15 percentage points. Descriptive and prescriptive layers continue to aid data visualisation and operational decisions, particularly within manufacturing quality-control loops. The generative segment, however, is scaling fastest, with some vendors logging 26.1% CAGR to 2031. Deep diffusion models and transformer architectures can propose viable small-molecule libraries guided by multi-objective fitness functions. When linked to automated synthesis robots, discovery cycles compress from quarters to weeks, shifting the bottleneck from idea generation to biological validation. The AI in life sciences market size flowing through generative use cases is projected to account for a rising share of overall software spending.
By Application: Clinical-Trials Optimisation Gaining Momentum
Drug discovery applications accounted for 25.60% of the 2025 revenue pool, driven by AI-enabled target identification across multi-omics datasets. Integration of graph-neural networks with cheminformatic rules has broadened exploration of “undruggable” targets. The AI in life sciences market share for clinical-trials optimisation is poised to climb as the segment grows at a 20.3% CAGR during 2026-2031. Algorithms that mine real-world data to refine inclusion criteria are cutting screen-fail rates, while remote-monitoring wearables feed continuous biomarkers that improve safety signal detection. Pharmaceutical sponsors report potential 70% cost savings when adaptive trial designs further reduce protocol amendments. Imaging-based diagnostics, bioprocess optimisation and personalised-medicine decision support remain sizeable niches, each benefiting as foundational models become increasingly multimodal.
By End User: Pharma Leads, CROs Accelerate
Pharmaceutical and biotechnology enterprises represented 45.40% of spending in 2025 as they embedded AI into R&D, regulatory, manufacturing and commercial operations. Dual strategies are common: internal centres of excellence for proprietary datasets combined with external licensing for frontier algorithms. CROs form the fastest-expanding customer group at an 17.2% CAGR through 2031 because sponsors outsource analytics-heavy tasks to partners already holding multi-sponsor data troves. The AI in life sciences market size tied to CRO contracts is projected to grow as regulatory bodies encourage data standardisation that multiplies cross-study insights. Medical-device manufacturers, academic institutes and payers constitute the balance of demand, collectively driving ecosystem interoperability.
By Technology: Foundation Models Transforming Capabilities
Machine-learning frameworks—gradient-boosting, random forests and classical deep nets—provide the baseline tooling for pattern recognition in structured datasets. NLP now digests clinical narratives, adverse-event reports and regulatory guidance at scale. Computer vision supports high-content screening and histopathology, adding spatial context to molecular predictions. Deep-learning advances have catalysed foundation models that are pre-trained on hundreds of millions of protein sequences or molecular graphs, delivering zero-shot capabilities for new targets. Transfer learning permits rapid fine-tuning, slashing data requirements for niche diseases. Generative architectures constitute the most rapid-growth technology subset: diffusion and variational-autoencoder pipelines that integrate chemical rules and synthesizability constraints can now output bench-ready compounds in silico. Combined with active-learning loops, each experimental assay returns information that the model feeds back into itself, reinforcing a virtuous discovery cycle.
Geography Analysis
North America commanded 48.60% of 2025 global revenue, anchored by a deep venture capital base, favourable reimbursement codes for digital diagnostics and early regulator engagement. The AI in life sciences market size in the US alone is boosted by the FDA’s RTOR programme, which validates AI-enabled biomarkers that become reusable across multiple development programmes. Multistate health-information exchanges enable richer training sets, although interstate privacy rules still complicate data portability. Cloud-service adoption outpaces other regions because HIPAA-aligned blueprints shorten compliance audits, letting mid-tier biotechs leverage hyperscale compute without building in-house clusters.Europe remains the second-largest region, poised to accelerate once the EHDS federated networks scale. Industry consortia linking academic medical centres with pharmaceutical sponsors are piloting privacy-preserving cross-border training, likely to increase the AI in life sciences market share captured by European vendors as they leverage home-market regulatory familiarity. Counterbalancing this momentum, the AI Act’s high-risk classification introduces extra documentation layers that can elongate product cycles. Companies are responding by integrating regulatory checkpoints into agile sprints, a practice that, while lengthening early iterations, reduces late-stage remediation costs.Asia shows the highest growth trajectory at a 21.3% CAGR between 2026-2031. China exploits coordinated industrial policy to fund AI-enabled drug-discovery megaprojects; provincial biotech parks provide tax holidays and access to national-level supercomputing. Japan and South Korea specialise in robotics and automation, yet lingering IP ambiguity for AI-generated molecules creates a licensing risk premium. India’s contract-research ecosystem leverages large English-language medical records, positioning the country as an outsourcing hub for algorithm training and validation. Divergent national rules dictate a country-by-country go-to-market, but the aggregate opportunity is compelling, with localised cloud regions and sovereign-AI initiatives unlocking new datasets previously inaccessible to global players.South America and the Middle East and Africa are smaller today but constitute important frontier segments. Brazil’s national genomics programmes and Saudi Arabia’s genome project are generating population-specific datasets that draw AI developers seeking diversity in training inputs. Governments are allocating innovation grants to attract multinational partnerships, a trend that could raise the regions’ combined market share over the next decade as infrastructure and skills mature.


Regulatory Landscape
Regulation for AI in life sciences is moving toward lifecycle governance, combining medical-product rules with horizontal AI requirements. In the United States, the FDA has formalized approaches for managing iterative model changes through Predetermined Change Control Plans (PCCPs), including final guidance published in December 2024 for AI-enabled device software functions. This supports post-market modifications when changes stay within an approved plan. In April 2026, the FDA also issued a Federal Register request for information to shape a pilot focused on AI-enabled optimization of early-phase clinical trials, reinforcing the use of structured risk-management practices aligned with the NIST AI Risk Management Framework in regulated development workflows.
In Europe, the EU AI Act has been in force since August 2024 and applies alongside MDR/IVDR for many clinical and diagnostic AI systems categorized as high-risk, raising the compliance bar for documentation, conformity assessment, and post-market monitoring. A concrete implementation milestone is the European Commission deadline in February 2026 (Article 72(3)) to adopt implementing acts that establish a template for post-market monitoring plans for high-risk AI systems. In China, the National Medical Products Administration (NMPA) published Implementation Opinions in May 2026 on "Artificial Intelligence + Drug Regulation" to promote deeper AI integration in drug regulation and accelerate modernization, signaling stronger regulatory pull for compliant AI tooling across the product lifecycle.
Value Chain Analysis
The value chain spans (1) data generation and stewardship (EHRs, imaging, omics, real-world data), (2) data engineering and governance (harmonization, ontologies, privacy-preserving access), (3) model development and validation (predictive and generative AI, explainability, audit trails), (4) compute and deployment (cloud, hybrid, on-premise), and (5) downstream execution in discovery, clinical development, and manufacturing operations. A key bottleneck sits upstream: only a small share of biopharma R&D data are FAIR-aligned in current practice, which increases the cost and cycle time of data preparation and limits cross-study generalization. This elevates the role of data platforms, knowledge graphs, and services partners that can operationalize governance and traceability.
Partnerships increasingly connect AI discovery with process development and supply resilience, shifting the chain from standalone software procurement toward integrated programs involving pharma, techbio firms, and CDMOs. Examples include Gilead Sciences and Terray Therapeutics entering a multi-target collaboration in December 2024 that pairs generative AI with high-throughput experimentation, and Veranova partnering with Phorum.AI in May 2024 to deploy generative AI for chemistry and manufacturing optimization. On the manufacturing resilience side, Ginkgo Bioworks secured a USD 29 million ARPA-H contract in April 2025 with multiple partners to develop distributed API manufacturing approaches (cell-free expression). In July 2025, Phlow Corp. and Antheia highlighted an ongoing partnership to bolster onshore production using biosynthesis and continuous flow chemistry, underscoring a growing link between AI-enabled R&D decisions and scalable, compliant manufacturing pathways.
Competitive Landscape
The market is moderately consolidated. IBM, IQVIA and Oracle deliver full-stack platforms that integrate data harmonisation, model training, validation and post-market surveillance. Rather than pursuing all innovations internally, they form joint ventures and acquire niche providers, creating network effects through bundled offerings. The top five firms collectively control about 45% of global revenue, leaving scope for specialised challengers.
Focus differentiation is the hallmark of rising contenders. Atomwise and Insilico Medicine deploy closed-loop systems coupling generative chemistry with automated wet-lab verification, compressing early-stage timelines from years to months. Owkin pioneers federated learning, allowing hospital data to remain on-premise while model parameters travel—a critical requirement under Europe’s GDPR and similar regimes. Hyperscaler cloud credits, equity stakes, and co-marketing agreements are now central to market positioning because they offer startups subsidised compute that can be converted into rapid proof-of-concept results.
Strategic alliances also dominate go-to-market. Pharmaceutical sponsors sign multi-target, multi-year deals that combine upfront cash with stage-gated milestones, aligning incentives across discovery and development. Recent mega-deals confirm that AI partners supplying validated leads can capture economics comparable with traditional biotech licensing agreements. Competitive intensity is therefore shifting from purely algorithmic performance to encompassing proprietary training datasets, compute access and regulatory fluency.
AI In Life Sciences Industry Leaders
IBM Corporation
NuMedii Inc.
Atomwise Inc
AiCure LLC
Nuance Communications Inc.
- *Disclaimer: Major Players sorted in no particular order

Market Opportunities and Future Outlook
A near-term opportunity is compliance-ready AI that reduces friction across regulated development, especially tooling that operationalizes governance, human oversight, and post-market monitoring for models used in R&D decision-making and clinical workflows. In January 2026, regulators advanced convergence signals through published Good AI Practice guiding principles for drug development. This reinforces demand for vendor capabilities such as data provenance, model-change control, validation packages, and monitoring plans that can be mapped to FDA and EU expectations. It also supports service-led growth around validation, documentation automation, and managed performance monitoring, particularly for organizations running hybrid architectures and federated learning where auditability must span multiple data holders.
A second whitespace is industrial-scale compute and co-innovation models that translate hyperscale acceleration into domain-specific workflows, lowering the barrier for large virtual screening and multimodal foundation-model development. In January 2026, NVIDIA and Eli Lilly announced a five-year, USD 1 billion AI co-innovation lab using BioNeMo and related capabilities, and in April 2026 Novo Nordisk and OpenAI announced a strategic partnership to integrate AI across discovery, manufacturing, and commercial operations, expanding the addressable spend beyond discovery-only pilots. Data-access and federation programs also create a distinct opportunity for vendors that can deploy privacy-preserving analytics across borders. The European Health Data Space becoming effective in January 2025 enables API-based access and federated training across EU member states, which lifts demand for interoperable platforms and governance layers that can operate across heterogeneous clinical, genomic, and imaging sources.
Recent Industry Developments
- June 2026: IBM and Google Cloud announced a strategic partnership to scale enterprise AI, including industry-focused AI agents and delivery capabilities for regulated sectors such as life sciences. The integration of IBM Consulting Advantage with Google Cloud Gemini Enterprise targets repeatable workflows and faster deployment of governed AI across drug development and healthcare operations.
- May 2026: Cleveland Clinic, RIKEN, and IBM reported modeling a 12,635-atom protein using quantum computers, highlighted as the largest known protein simulation on quantum hardware to date. This advances the practical intersection of quantum-classical computing with molecular simulation, a capability that can complement AI-driven discovery by improving the fidelity of structure and interaction modeling.
- May 2025: Incyte and Genesis Therapeutics entered a collaboration with a USD 30 million upfront payment and milestone structure per target to deploy the GEMS platform for small-molecule discovery. The deal reinforces the market pattern of multi-target, platform-based partnerships where AI partners earn economics comparable to traditional discovery outsourcing while sponsors expand access to differentiated model pipelines.


Research Methodology Framework and Report Scope
Market Definition and Coverage
This market covers revenue generated from AI software, hardware, and related services used in life sciences workflows. It includes use across drug discovery, clinical trials, diagnostics, biotechnology, and patient monitoring, reported across major regions.
Scope exclusions: This sizing excludes general purpose IT infrastructure spend and non life sciences AI use cases that are not tied to a defined life sciences application outcome.
Segmentation Overview
- By Offering
- Software
- Services
- Hardware
- By Deployment Model
- Cloud / On-Demand
- On-Premise
- By Analytics Type
- Descriptive
- Predictive
- Prescriptive
- Generative AI
- By Application
- Drug Discovery
- Medical Diagnosis and Imaging
- Clinical Trials Optimisation
- Biotechnology and Bioprocessing
- Precision and Personalised Medicine
- Patient Monitoring and Real-World Evidence
- By End User
- Pharmaceutical and Biotechnology Companies
- Contract Research Organisations (CROs)
- Medical Device Manufacturers
- Academic and Research Institutes
- Healthcare Providers and Payers
- By Technology
- Machine Learning
- Natural Language Processing
- Computer Vision
- Deep Learning and Neural Networks
- Generative AI Models
- By Geography
- North America
- United States
- Canada
- Europe
- Germany
- United Kingdom
- France
- Nordics
- Rest of Europe
- Asia Pacific
- China
- Japan
- India
- South Korea
- Rest of Asia Pacific
- South America
- Brazil
- Rest of South America
- Middle East and Africa
- Saudi Arabia
- United Arab Emirates
- South Africa
- Rest of Middle East and Africa
- North America
Data Sources, Market Sizing, and Validation
Desk Research
For desk research, we map the demand pool using public indicators that show life sciences activity and digital adoption. The sources include US FDA and EMA publications, the World Health Organization, ClinicalTrials.gov, and OECD health statistics. Together, these help anchor measures such as trial volumes, therapeutic focus, and regulatory signals.
We also review company filings, investor presentations, and press releases to track AI product launches, partnerships, and revenue commentary, then link those statements back to specific life sciences use cases. Where needed, our analysts use paid subscriptions for company financials and intelligence, patent databases, and an import and export shipment level database to infer hardware flows and R and D intensity. This list is not exhaustive, and additional public sources were used to collect, validate, and clarify inputs.
Primary Interviews and Surveys
Primary work is used to confirm what buyers actually purchase, how deployments are priced, and where adoption differs by end user type and region. We spoke with pharma and biotech buyers, CRO stakeholders, healthcare delivery participants, and solution-side experts, then used those inputs to close gaps left by public reporting. Because revenue recognition and bundling vary across contracts in this space, follow-up interviews were done when early assumptions did not align with observed rollout patterns.
Distribution of primary research fieldwork respondents
| Company type | Respondent position | Region |
|---|---|---|
| Top tier: 35% | CXOs: 16% | APAC: 44% |
| Mid tier: 48% | Functional/Unit leaders: 26% | EMEA: 31% |
| Smaller Players: 17% | Managers: 58% | Americas: 25% |
Market-Sizing & Forecasting
Sizing is built using a top-down approach where life sciences activity indicators are converted into an addressable spend pool for AI tools and services, then allocated across key application areas. The inputs that matter include clinical trial starts and complexity, R and D pipeline intensity, cloud adoption in regulated environments, the mix of descriptive and predictive analytics moving toward generative AI, and typical contract structures for software subscriptions, usage-based fees, and services.
To keep the model grounded, totals are corroborated using selective bottom-up checks such as sampled vendor revenue disclosures, channel checks on average annual contract values, and volume-by-ASP estimates for AI-enabled platforms when unit signals are available. When bottom-up evidence is incomplete, we use adoption ranges by end user type, then apply conservative normalization so small outliers do not overstate the total.
Forecasting uses scenario analysis supported by expert input on budget cycles, regulatory comfort with AI-derived evidence, and the pace of federated data network adoption. Assumptions are then stress tested through sensitivity checks on pricing progression and utilization trends before the final time series is locked.
Data Validation & Update Cycle
Outputs are checked against independent signals, including regional life sciences R and D direction, reported AI program rollouts, and observed funding and partnership activity, so totals stay tied to real adoption. If a segment grows too fast or too slow relative to these signals, the underlying drivers are rechecked and the assumptions are corrected.
Before sign off, the work goes through multiple analyst reviews that focus on variance checks, currency consistency, and year over year movement by region and end user. Reports are refreshed annually, with interim updates triggered when a material event changes pricing, regulation, or adoption behavior. Right before delivery, a final pass is completed so clients receive the most current view.
Mordor Intelligence's Life Sciences Artificial Intelligence Market Sizing Compared With Other Published Estimates
Published market sizes for AI in life sciences can look far apart, even when the topic name appears the same, because each publisher defines the spend differently and uses different inputs for adoption and pricing. The most common reasons are differences in what is counted as AI revenue, how services are treated, how multi-year contracts are annualized, and how frequently assumptions are updated.
Some published totals fold in broader healthcare AI revenue or include adjacent enterprise software spend that is not tied to a life sciences workflow. In Mordor Intelligence's model, revenue is counted only when it maps to defined life sciences applications (like drug discovery, clinical trials, diagnostics, or patient monitoring), and general IT and non-use-case AI tooling is kept out so the demand pool stays specific.
Benchmark comparison
| Source | Market Size | Gaps in Research Methodology |
|---|---|---|
| Mordor Intelligence | USD 3.61 B (2025) | |
| Industry Publisher A | USD 3.50 B (2025) | Uses a similar application list, but the treatment of services and the way multi-year platform contracts are annualized is less explicit, which can compress reported revenue in the current year. |
| Global Publisher B | USD 2.73 B (2025) | More conservative adoption assumptions for regulated deployments and slower pricing progression, which reduces near-term totals even if the long-term growth path is strong. |
The table shows that the spread is mainly explained by scope discipline and the way adoption and contract value are translated into annual revenue. By keeping inputs tied to observable life sciences activity and then cross-checking with interview-based pricing logic, the final number stays traceable and repeatable for planning use.


Key Questions Answered in the Report
What is the current value of the AI in life sciences market?
The market is worth USD 4.51 billion in 2026 and is projected to expand to USD 13.64 billion by 2031 at a 24.78% CAGR.
Which region generates the highest revenue today?
North America leads with 48.60% share owing to strong venture funding, regulatory incentives such as FDA RTOR and mature cloud infrastructure.
What is driving the rapid uptake of AI in clinical trials?
Algorithms that refine inclusion criteria, enable remote monitoring and predict enrolment feasibility are pushing the clinical-trials optimisation segment to a 20.3% CAGR through 2031.
How will the EU Health Data Space influence AI adoption?
The EHDS enables federated learning across 27 member states, reducing data silos while maintaining privacy and is expected to add EUR 11 billion in efficiency gains over ten years.
Why are compute partnerships with hyperscalers important?
Collaborations with providers like NVIDIA have cut compute cost per molecule by roughly 70%, allowing drug hunters to screen far larger virtual libraries within practical budgets.
What challenges could slow market growth?
Key headwinds include extended CE-mark timelines under the EU AI Act, limited FAIR-compliant datasets and ongoing shortages of high-end GPUs that inflate inference costs.
Page last updated on:





