Apiculture Market Size and Share
Market Overview
| Study Period | 2021 - 2031 |
|---|---|
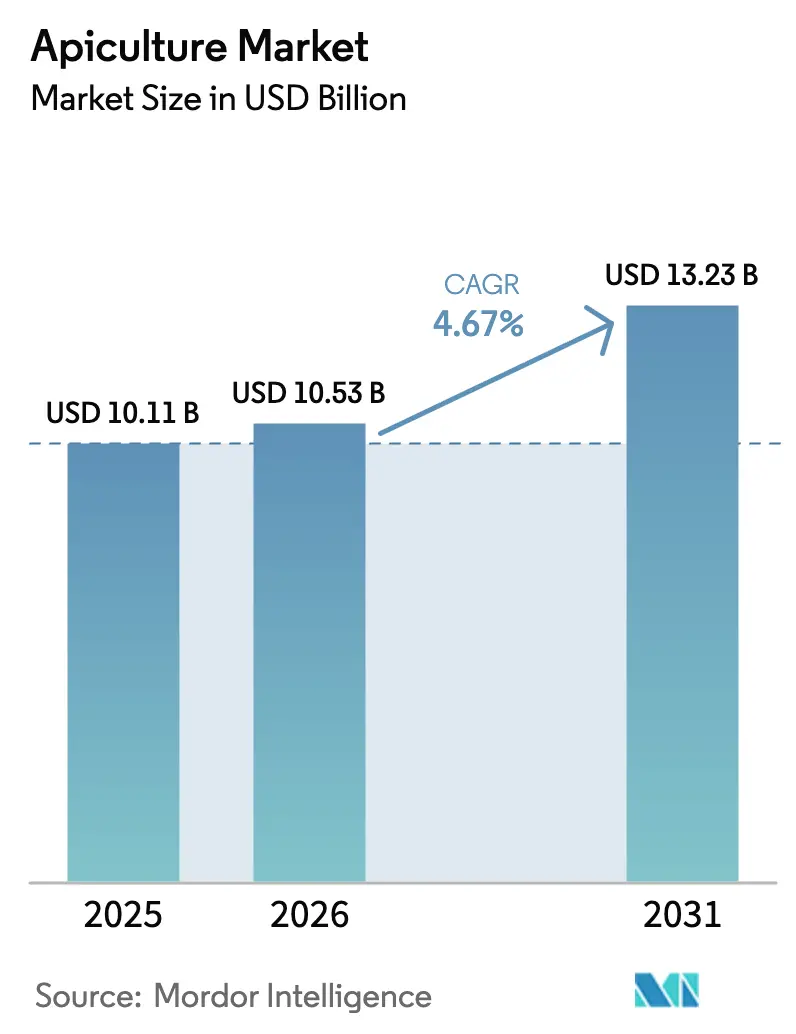
| Market Size (2026) | USD 10.53 Billion |
| Market Size (2031) | USD 13.23 Billion |
| Growth Rate (2026 - 2031) | 4.67% CAGR |
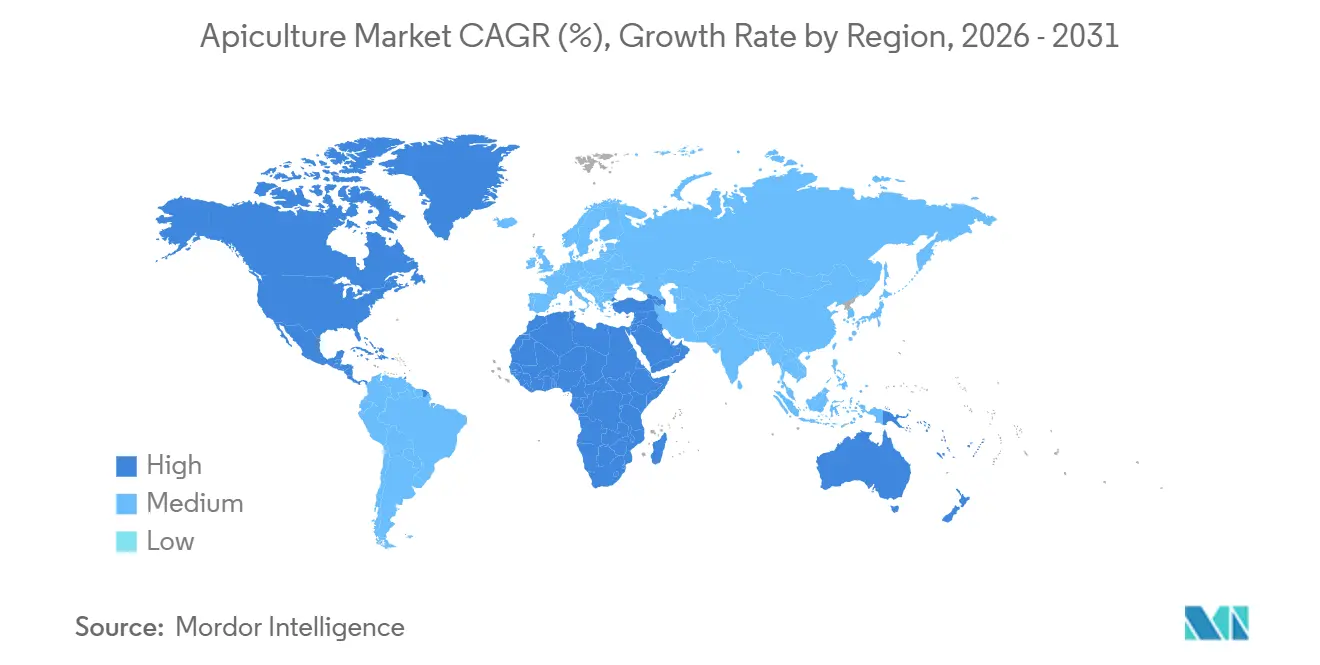
| Fastest Growing Market | North America |
| Largest Market | Asia Pacific |
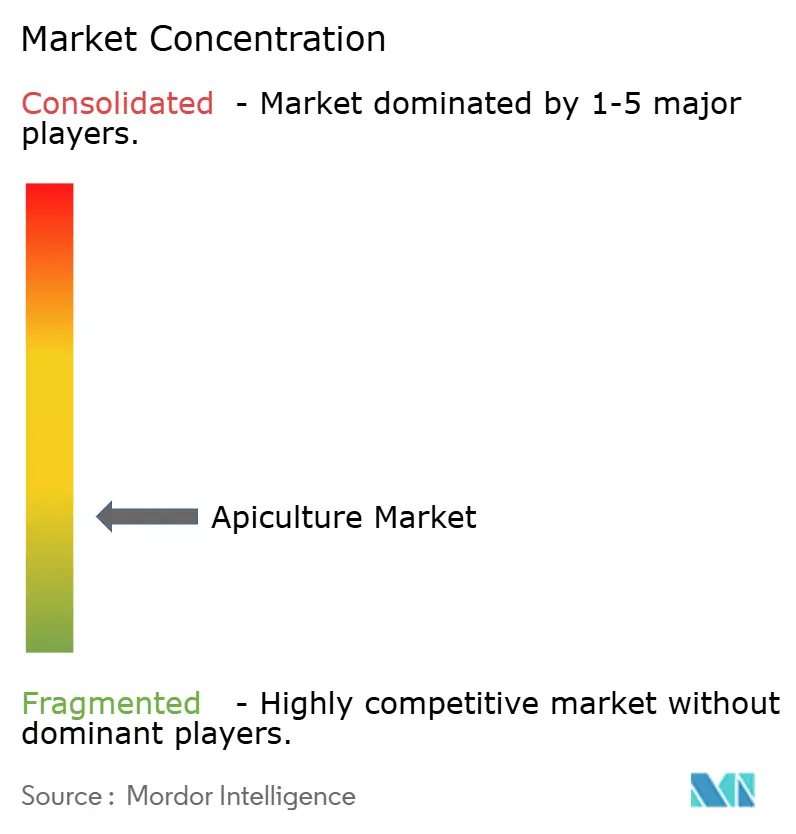
| Market Concentration | Low |
Major Players *Disclaimer: Major Players sorted in no particular order Image © Mordor Intelligence. Reuse requires attribution under CC BY 4.0. | |
Apiculture Market Analysis by Mordor Intelligence
The apiculture market size was valued at USD 10.11 billion in 2025 and is estimated to grow from USD 10.53 billion in 2026 to reach USD 13.23 billion by 2031, at a CAGR of 4.67% during the forecast period (2026-2031). This growth is primarily attributed to increasing consumer demand for natural sweeteners, functional bee products, and supply chains with enhanced traceability, driving the rising demand for apiculture products. However, the market faces challenges such as high colony-loss rates, pesticide exposure, and climate variability, which are collectively limiting supply levels. In the United States, honey consumption has seen a significant increase, reflecting a shift among consumers from refined sugar to natural alternatives. Despite this growing demand, colony surveys in 2025 reported a 56% loss, the highest decline since monitoring began, highlighting the need for solutions like integrated pest management (IPM) and precision beekeeping tools to mitigate these challenges effectively. The apiculture market remains highly fragmented, with numerous smallholders facing constraints such as labor shortages and adverse weather conditions. In contrast, larger honey packers are increasingly adopting vertical integration strategies to secure access to premium raw honey and live bee supplies, ensuring a stable and reliable supply chain. Additionally, the European Union's new honey traceability requirements under Directive 2024/1438 and the establishment of a 90-member Honey Platform to combat adulteration signal the implementation of stricter quality standards, which may influence market competition.
Key Report Takeaways
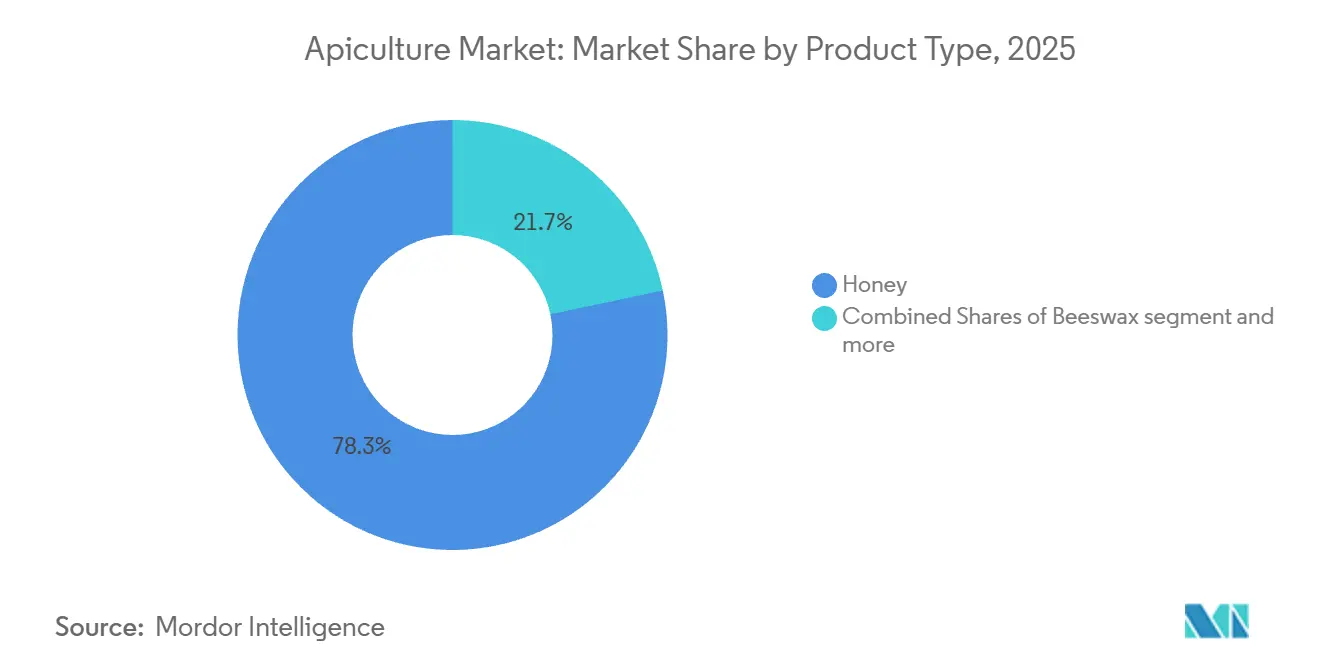
- By product type, honey captured 78.32% revenue share in 2025; live-bee sales are forecast to grow at a 6.12% CAGR to 2031.
- By production method, traditional practices supplied 81.43% of 2025 volume; modern techniques are projected to expand at a 6.31% CAGR through 2031.
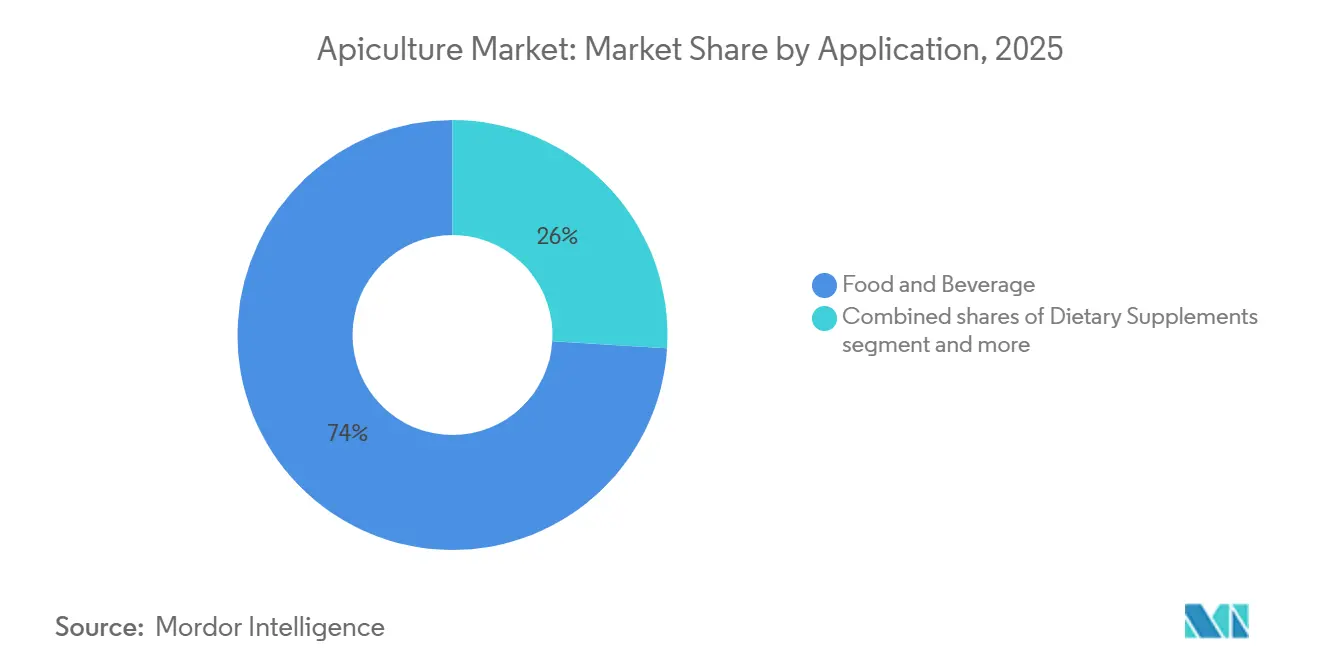
- By application, food and beverage held 74.02% share of the apiculture market size in 2025, whereas dietary supplements are advancing at a 6.01% CAGR to 2031.
- By geography, Asia-Pacific accounted for 34.99% apiculture market share in 2025; North America is set to record the fastest 5.61% CAGR to 2031.
Note: Market size and forecast figures in this report are generated using Mordor Intelligence’s proprietary estimation framework, updated with the latest available data and insights as of January 2026.
Global Apiculture Market Trends and Insights
Driver Impact Analysis*
| Driver | (~) % Impact on CAGR Forecast | Geographic Relevance | Impact Timeline |
|---|---|---|---|
| Surging global demand for natural sweeteners such as honey | +1.2% | Global, with strongest uptake in North America and Europe | Medium term (2-4 years) |
| Rising popularity of bee-derived wellness products | +0.8% | North America, Europe, Asia-Pacific urban centers | Medium term (2-4 years) |
| Increasing awareness about the health benefits of honey | +0.9% | Global, with accelerated penetration in Asia-Pacific and Middle East | Short term (≤ 2 years) |
| Growth in organic and natural personal care products | +0.7% | North America and Europe, spillover to Asia-Pacific | Medium term (2-4 years) |
| Integration of beekeeping into agroforestry and sustainable farming practices | +0.5% | South America, Asia-Pacific, Sub-Saharan Africa | Long term (≥ 4 years) |
| Increased use of bee venom in dermatology and anti-aging products | +0.4% | North America, Europe, East Asia (K-beauty markets) | Long term (≥ 4 years) |
| Source: Mordor Intelligence | |||
Surging global demand for natural sweeteners such as honey
Consumers are increasingly moving away from refined sugar and opting for honey, driven by growing evidence highlighting the metabolic risks associated with high-fructose corn syrup (HFCS) and the broader clean-label movement. This shift is not merely a matter of preference but is supported by scientific research. Peer-reviewed dose-response studies published in 2024 demonstrated that consuming 40 to 80 grams of honey daily led to improvements in glycemic control and lipid profiles among adults with prediabetes. These findings have positioned honey as a functional sweetener with health benefits, rather than simply a substitute for sugar. Foodservice operators and packaged-goods manufacturers are responding to this trend by reformulating their products to prominently feature honey, thereby creating additional demand that extends beyond traditional retail channels. This trend is particularly prominent in North America and Europe, where 75% of surveyed consumers indicated a willingness to pay a premium for products that include bee-friendly sourcing claims. This reflects a growing consumer interest in sustainability and ethical sourcing practices. However, challenges remain in ensuring supply chain transparency. Bulk imports of honey from regions such as Asia and South America often lack traceability, which exposes brands to risks of adulteration and undermines consumer trust. Addressing these issues is critical for maintaining the integrity of honey as a trusted and functional ingredient in the market.
Rising popularity of bee-derived wellness products
Propolis, royal jelly, bee pollen, and bee venom have transitioned from niche apothecary products to mainstream dietary supplements and functional foods, driven by clinical validation of their bioactive compounds. Propolis extracts, which are rich in flavonoids and phenolic acids, have shown antimicrobial and immunomodulatory effects in controlled trials. Royal jelly, containing 10-hydroxy-2-decenoic acid (10-HDA), has been linked to neuroprotective and anti-inflammatory properties. Bee pollen, marketed as a complete protein source with trace minerals, appeals to plant-based and performance-nutrition consumers, although allergenicity concerns require clear labeling. The wellness product category is growing rapidly in North America and urban Asia-Pacific markets, supported by higher disposable incomes and greater health awareness, which enable premium pricing. Bee venom, traditionally used in alternative medicine, is gaining recognition in dermatology. Melittin peptide formulations have demonstrated potential in stimulating collagen synthesis and reducing wrinkles, as shown in peer-reviewed dermatological studies. Korean beauty brands have successfully commercialized bee-venom serums and sheet masks, providing a model for Western market entrants. However, scaling these products requires strict quality control, as venom potency varies depending on bee genetics and extraction methods. Furthermore, regulatory frameworks for cosmetic and supplement claims remain inconsistent across regions.
Increasing awareness about the health benefits of honey
The health benefits of honey have driven consumer acceptance across demographic groups, particularly in emerging markets where traditional medicine aligns with modern health trends. The implementation of stingless bee honey standards in Southeast Asian and Pacific countries indicates broader recognition of honey varieties' nutritional and therapeutic properties. These standards ensure quality control and authenticity verification for different honey types, providing consumers with reliable product choices. The comprehensive studies demonstrate honey's effectiveness in various applications, from wound healing to immune system support. Research validation has strengthened consumer confidence in honey's therapeutic properties, especially in markets where traditional healing practices align with modern wellness preferences. The growing scientific understanding of honey's bioactive compounds and their mechanisms of action has further solidified its position in both conventional and alternative medicine markets.
Growth in organic and natural personal care products
Beeswax and honey are increasingly replacing synthetic emulsifiers and humectants in cosmetics and personal care formulations as brands address consumer preferences for recognizable, plant-derived ingredients. Beeswax serves as a natural thickener and occlusive agent in products such as lip balms, lotions, and hair pomades, while honey's hygroscopic properties improve moisture retention in skincare formulations. The organic personal care segment experienced double-digit growth in 2024, with North America and Europe leading in certified-organic product launches. This growth is driven by retailers like Whole Foods and Sprouts, which require clean-label compliance. Bee-derived ingredients align with the growing trend toward cruelty-free and sustainable sourcing. However, ethical beekeeping certifications, such as Bee Better Certified, developed by the Xerces Society in collaboration with Oregon Tilth, are still emerging and lack widespread adoption [2]Source: Bee Better Certified, “Program Overview,” beebettercertified.org. Formulators value beeswax for its compatibility with essential oils and botanical extracts, supporting premium positioning in the natural beauty market. At the same time, supply chain challenges persist, as beeswax production depends on honey extraction, and colony losses directly impact availability. To address these risks, brands are increasingly securing multi-year contracts or vertically integrating into beekeeping operations to ensure a stable supply.
Restraints Impact Analysis*
| Restraint | (~) % Impact on CAGR Forecast | Geographic Relevance | Impact Timeline |
|---|---|---|---|
| Impact of excessive pesticide and agrochemical use on bee health | -1.1% | Global, with acute effects in North America, Europe, and intensive-agriculture zones in Asia | Short term (≤ 2 years) |
| Labour-intensive nature of beekeeping limiting large-scale commercialization | -0.7% | Global, most pronounced in high-wage economies (North America, Europe) | Medium term (2-4 years) |
| Dependence on weather conditions for honey production | -0.6% | Global, with heightened volatility in drought-prone regions (California, Australia, Mediterranean) | Short term (≤ 2 years) |
| Fragmented market structure leading to inefficiencies in scalability | -0.5% | Global, particularly acute in Asia-Pacific and South America | Long term (≥ 4 years) |
| Source: Mordor Intelligence | |||
Impact of excessive pesticide and agrochemical use on bee health
Neonicotinoid insecticides and other systemic agrochemicals continue to significantly harm managed and wild bee populations, despite regulatory restrictions in Europe and partial bans in the United States. Surveys conducted by the United States Department of Agriculture (USDA) reported annual colony losses of 48.2% during the 2023-2024 season and 51% in 2022-2023. Pesticide exposure remains a primary factor, alongside Varroa mite infestations and diseases. Although the Environmental Protection Agency (EPA) imposed restrictions on neonicotinoid use in 2024, enforcement gaps and exemptions for certain crops have allowed residues to persist in pollen and nectar, which negatively affect bee navigation, immune function, and reproductive success. In the European Union (EU), member states implemented stricter bans, prohibiting the outdoor use of clothianidin, imidacloprid, and thiamethoxam. However, cross-border agricultural trade and legacy soil contamination continue to pose exposure risks. In California, beekeepers reported severe losses ahead of the 2025 almond bloom, with colonies losing approximately 60% of their populations between June 2024 and March 2025. This prompted Project Apis M to initiate investigations into wax and pollen contamination. These losses have cascading effects throughout the value chain. A reduced number of colonies increases pollination-service fees, lowers honey yields, and forces beekeepers to invest in costly mitigation measures, such as supplemental feeding and mite treatments. The economic impact is further compounded by the reliance of nearly all managed honeybee colonies in the United States on crop pollination, making colony health a critical factor for the production of high-value fruits, nuts, and vegetables.
Labour-intensive nature of beekeeping limiting large-scale commercialization
Beekeeping remains a physically demanding and seasonally concentrated activity that resists automation, limiting the market's scalability and attracting minimal interest from younger participants. Tasks such as hive inspections, honey extraction, and colony management require manual dexterity, heavy lifting, and tolerance for stings, creating significant barriers to entry and contributing to an aging workforce. Commercial operations managing hundreds or thousands of hives face acute labor shortages during peak harvest periods, often relying on seasonal migrant workers whose availability is influenced by immigration policies and wage competition from other agricultural industries. The adoption of Internet of Things (IoT) sensors and artificial intelligence (AI)-driven hive monitoring, offered by platforms such as ApisProtect, BeeHero, and Pollenity, provides partial relief by enabling remote health diagnostics and predictive alerts for swarming or disease outbreaks. However, these technologies cannot replace the manual tasks of splitting colonies, installing queens, or extracting frames. The labor-intensive nature of beekeeping also increases production costs, reducing profit margins for small-scale operators who lack economies of scale. In high-wage economies like the United States and Western Europe, labor expenses can account for 30% to 40% of total operating costs, making it challenging to compete with low-cost bulk imports from countries such as China, Argentina, and Vietnam. This dynamic perpetuates market fragmentation, as mid-sized operations struggle to justify investments in mechanization or advanced technologies. Consequently, the market remains divided between artisanal micro-producers and a small number of vertically integrated packers.
*Our forecasts treat driver/restraint impacts as directional, not additive. The impact forecasts reflect baseline growth, mix effects, and variable interactions.
Segment Analysis
By Product Type: Live-Bee Sales Outpace Honey as Pollination Economics Shift
Honey is expected to contribute 78.32% of product-type revenue in 2025, highlighting its strong presence across retail, foodservice, and industrial channels. Meanwhile, live-bee sales are projected to grow at a compound annual growth rate (CAGR) of 6.12% through 2031, driven by the rising demand for commercial pollination services. For example, California's almond industry alone requires 1.5 million colonies each February, with pollination fees increasing to USD 200 to USD 250 per hive due to limited colony availability. This trend has made pollination contracts more profitable than honey extraction for many operators. As a result, beekeepers are adapting their business models by focusing on optimizing colony strength and timing to maximize revenue from pollination services, even if it means accepting lower honey yields per hive.
Beeswax, the second-largest product segment, benefits from its applications in cosmetics, where it serves as a natural emulsifier, and pharmaceuticals, where it is used to coat tablets and form suppository bases. Additionally, new uses in 3D-printing filaments and biodegradable packaging are driving incremental demand. However, beeswax production remains closely tied to honey extraction frequency, as it is primarily a byproduct. Other bee products, such as propolis, royal jelly, and bee pollen, cater to niche wellness and supplement markets but are gaining popularity as clinical research validates their bioactive properties. Propolis extracts, which are rich in flavonoids, are increasingly included in immune-support formulations, while royal jelly, containing 10-hydroxy-2-decenoic acid (10-HDA), is attracting interest in nootropic and anti-aging segments.


By Production Method: Modern Techniques Gain Traction Amid Colony-Health Imperatives
Traditional beekeeping methods are projected to account for 81.43% of production volume in 2025, highlighting the dominance of small-holder operations in regions such as Asia-Pacific, South America, and Sub-Saharan Africa. These operations typically rely on fixed-frame hives, manual inspections, and generationally inherited seasonal migration practices. These systems emphasize low capital requirements and local knowledge, making them accessible to resource-limited producers. However, they face challenges such as limited scalability and increased vulnerability to pests, diseases, and weather fluctuations.
Modern beekeeping, growing at a compound annual growth rate (CAGR) of 6.31% through 2031, incorporates advanced technologies such as Internet of Things (IoT)-enabled hive monitoring, artificial intelligence-based health diagnostics, precision feeding, and integrated pest management. For instance, platforms like ApisProtect utilize in-hive sensors to monitor temperature, humidity, weight, and acoustic signatures, transmitting real-time data to cloud-based dashboards. These systems alert beekeepers to issues such as swarming, queenlessness, or Varroa mite infestations before visible symptoms arise. Similarly, BeeHero integrates sensor data with satellite imagery and weather forecasts to optimize pollination strategies and predict nectar flows, allowing for more efficient allocation of colonies across contracts. These technologies help reduce labor demands for routine inspections and enable remote management of widely dispersed apiaries, addressing the industry's persistent labor shortages and aging workforce.
By Application: Dietary Supplements Surge as Functional Honey Gains Clinical Validation
Food and beverage applications are expected to account for 74.02% of apiculture-product consumption in 2025. This is primarily driven by honey's widespread use as a sweetener in baked goods, beverages, sauces, and confections. However, dietary supplements are emerging as the fastest-growing end-use category, with a compound annual growth rate (CAGR) of 6.01% through 2031. This growth is supported by increasing clinical evidence and a shift toward wellness-focused consumer behavior. Honey's incorporation into functional foods, such as energy gels, protein bars, and probiotic yogurts, is blurring the line between culinary and supplement applications. Brands are utilizing honey's natural sugar content and antioxidant properties to align with clean-label trends.
Peer-reviewed studies published in 2024 indicated that consuming 40 to 80 grams of honey per day improved glycemic control and lipid profiles in adults with prediabetes. These findings enhance the credibility of functional food claims and enable brands to justify premium pricing. Dietary supplements containing bee pollen, propolis, and royal jelly are expanding from niche health-food stores into mainstream retail channels, driven by consumer interest in immune support and anti-aging benefits. Propolis capsules and tinctures, standardized for flavonoid content, are marketed for respiratory health and wound healing. Meanwhile, royal jelly supplements are positioned for cognitive function and hormonal balance, although regulatory requirements for health claims vary significantly across regions.
Geography Analysis
In 2025, the Asia-Pacific region is expected to hold 34.99% of the global apiculture market share, driven by China's position as the world's largest honey producer with an annual output of 460,000 tonnes, and India's expanding organic certification base, which reached 120,000 tonnes in 2024. China's dominance is supported by its extensive rural beekeeping networks, favorable climatic conditions across diverse ecological zones, and government programs promoting apiculture as a tool for poverty alleviation. However, the sector faces challenges such as quality control issues and adulteration scandals, which have impacted its export reputation. In India, the market is growing due to increasing domestic consumption, export opportunities in Europe and the Middle East, and initiatives like the National Beekeeping and Honey Mission, which provides subsidies for hive procurement and training programs.
North America is the fastest-growing region in the apiculture market, with a compound annual growth rate of 5.61% projected through 2031. This growth is primarily attributed to the rising demand for organic and raw honey, increasing fees for pollination services, and vertical integration efforts by branded packers aiming to gain better control over supply chains. In 2023, the United States produced 148 million pounds of honey but imported approximately 80% of its domestic consumption. This reliance on imports has resulted in persistent trade deficits and exposure to price fluctuations influenced by honey imports from countries such as Argentina, Brazil, Vietnam, and Ukraine.
Europe's apiculture market is shaped by strict organic standards, bans on neonicotinoid pesticides, and a fragmented production base spread across countries including Germany, Spain, Poland, France, and Italy. Germany and Spain are the largest honey producers in the region. The European Union's Farm to Fork Strategy and Biodiversity Strategy for 2030 prioritize pollinator protection, requiring member states to reduce pesticide use by 50% and restore pollinator habitats. These regulatory measures are creating favorable conditions for the adoption of organic and sustainable beekeeping practices.

Competitive Landscape
The apiculture market is marked by fragmentation, where small-scale producers operate alongside vertically integrated packers. However, consolidation is accelerating as branded players aim to secure upstream supply chains and establish premium market positions. For example, Sweet Harvest Foods' acquisition of Sweet River Honey in January 2025 highlights this trend. This acquisition provided access to hives and beekeeping expertise, reinforcing the company's focus on high-quality, traceable honey, following its 2022 merger with Nature Nate's Honey Co. Similarly, Wisdom Natural Brands acquired Canada's Drizzle Honey in November 2024 to expand its portfolio with sustainably sourced raw and superfood-infused honey. The company plans to leverage SweetLeaf's distribution network, which spans over 11,000 retail locations in the United States, to accelerate Drizzle's market entry.
Capilano Honey's strategic review, initiated in July 2025 with Rothschild and Company as advisers, attracted interest from domestic bidders such as Bega Cheese and international buyers. This highlights the value of established brands with retail scale and supply chain assets. These developments indicate a shift from fragmented, transactional sourcing toward integrated models that emphasize quality control, traceability, and brand narrative. Opportunities for growth exist in areas such as bee-venom cosmetics, where the anti-aging properties of the melittin peptide have yet to be fully commercialized outside of Korean beauty brands. Additionally, agroforestry-integrated beekeeping presents diversified revenue streams and habitat restoration benefits, appealing to sustainability-focused investors and certification bodies like Bee Better Certified.
Technology adoption is becoming a competitive advantage in the apiculture market. Internet of Things (IoT) platforms such as ApisProtect, BeeHero, and Pollenity enable remote hive monitoring, predictive health diagnostics, and optimized pollination deployment. These innovations reduce labor intensity and improve colony survival rates. However, scaling these technologies is challenging due to the capital investment and technical expertise required, resulting in a divided market. Large commercial operators are increasingly adopting data-driven management practices, while smallholders continue to rely on traditional methods. Certification programs, including Bee Better Certified, Regenerative Organic Certification, and organic standards administered by the United States Department of Agriculture (USDA) and the European Union (EU), are driving market segmentation [3]Source: Regenerative Organic Alliance, “Framework for Regenerative Organic Certification,” regenorganic.org. Brands are seeking third-party validation of pollinator-friendly practices to differentiate their products and command premium pricing.
Apiculture Industry Leaders
Ceras Industriales Marti
McCormick & Company Inc.
Beeswax
Mann Lake Bee & Ag
SJA Honey
- *Disclaimer: Major Players sorted in no particular order

Recent Industry Developments
- June 2025: Mann Lake Bee & Ag expanded the warehouse capacity at its Kentucky facility. The expansion aims to enhance storage capabilities and improve distribution efficiency for the company's agricultural products.
- April 2025: Betterbee to expand its research, education, and honeybee health initiatives while supporting beekeepers nationwide through expert advice and quality bee colonies, adapting to challenges like colony die-offs and climate-driven hive management strategies.
- March 2025: Nature Nate's Honey Co., a major honey producer in the United States, introduced Nate's hot honey minis. The company developed these portion-controlled honey products to complement meals and snacks.


Research Methodology Framework and Report Scope
Market Definitions and Key Coverage
Our study defines the apiculture market as all revenue generated from commercial husbandry of honey-bee colonies for primary products, honey, beeswax, live bees, propolis, pollen, and royal jelly, sold in bulk or packaged form at the first point of sale. Values are captured at producer gate and later reconciled with customs and processor data across five regions.
Scope exclusion: backyard hobby beekeeping, whose output never enters organized trade, is intentionally left out.
Segmentation Overview
- By Product Type
- Honey
- Beeswax
- Live-bees
- Others
- By Production Method
- Modern
- Traditional
- By Application
- Food and Beverages
- Dietary Supplements
- Pharmaceutical
- Cosmetics and Personal Care
- Industrial
- Others
- By Geography
- North America
- United States
- Canada
- Mexico
- Rest of North America
- Europe
- Germany
- United Kingdom
- Italy
- France
- Spain
- Poland
- Rest of Europe
- Asia-Pacific
- China
- India
- Japan
- Australia
- Rest of Asia-Pacific
- South America
- Brazil
- Argentina
- Rest of South America
- Middle East and Africa
- South Africa
- Saudi Arabia
- United Arab Emirates
- Rest of Middle East and Africa
- North America
Detailed Research Methodology and Data Validation
Primary Research
Mordor analysts spoke with commercial beekeepers, honey packers, veterinary suppliers, and export brokers across Asia-Pacific, Europe, the Americas, and Africa. These structured interviews validated yield assumptions, modern hive adoption rates, and price spreads, and they helped us sense-check early model outputs.
Desk Research
We began with country-level hive numbers, honey output, and export flows released by FAOSTAT, USDA, Eurostat, and China's MARA, then drew on apiculture associations such as Apimondia for yield and colony-health ratios. News archives in Dow Jones Factiva, plus company financials from D&B Hoovers, gave processor revenue and facility counts, while Volza shipment data helped benchmark export prices.
Next, we reviewed annual reports, 10-Ks, investor decks, and peer-reviewed journals on bee pathology to map cost drivers and disease impacts. This list is illustrative; many additional open and paid sources were consulted to verify figures and clarify trends.
Market-Sizing & Forecasting
We start with officially reported honey production and trade volumes, which are then converted to value through region-specific average selling prices. Results are corroborated with selective bottom-up roll-ups, such as sampled beekeeper turnover, processor capacity checks, and live-bee shipment counts, to fine-tune totals. Key variables tracked include average colony size, overwinter loss rate, share of box hives, retail honey price inflation, and regulatory shifts on antibiotic residues. A multivariate regression combined with scenario analysis projects demand to 2030; gaps in micro data are bridged using regional proxies agreed during expert calls. This is where Mordor Intelligence differentiates by continuously adjusting volumes for fresh colony-health alerts.
Data Validation & Update Cycle
We apply a two-step peer review; anomaly flags over five percent trigger re-contact with sources, and the entire model is refreshed annually, with interim tweaks when disease outbreaks, trade bans, or subsidy changes materially shift the baseline.
Why Mordor's Apiculture Baseline Earns Decision-Makers' Trust
Published estimates often diverge because research firms choose different product baskets, valuation points, and refresh speeds.
Key gap drivers include some publishers folding pollination service fees into market value, others using retail shelf prices without removing distributor margins, and several relying on single-country yield ratios for global extrapolation, whereas we update multi-country yield and price grids every year.
Benchmark comparison
| Market Size | Anonymized source | Primary gap driver |
|---|---|---|
| USD 10.07 B (2025) | Mordor Intelligence | - |
| USD 11.75 B (2024) | Global Consultancy A | Includes pollination revenue and downstream packaging values |
| USD 10.50 B (2024) | Industry Journal B | Uses fixed global yield factor and three-year-old price averages |
These contrasts show that our disciplined scoping, timely data refresh, and dual-layer validation give clients a balanced, transparent baseline they can trace back to clear variables and repeatable steps.


Key Questions Answered in the Report
How large is the apiculture market in 2026 and where is it heading?
The apiculture market size stands at USD 10.53 billion in 2026 and is projected to reach USD 13.23 billion by 2031, reflecting a 4.67% CAGR.
Which product segment is growing fastest?
Live-bee sales are expanding at a 6.12% CAGR through 2031 due to rising pollination-service demand from high-value crops.
Which region offers the highest growth prospects?
North America exhibits the fastest 5.61% CAGR, driven by premium honey demand and escalating pollination fees for almonds and other crops.
What certifications can boost product credibility?
Bee Better Certified and Regenerative Organic Certification validate pollinator-friendly and sustainable practices, supporting premium pricing in retail channels.
Page last updated on:


