Antivenom Market Size and Share
Market Overview
| Study Period | 2020 - 2031 |
|---|---|
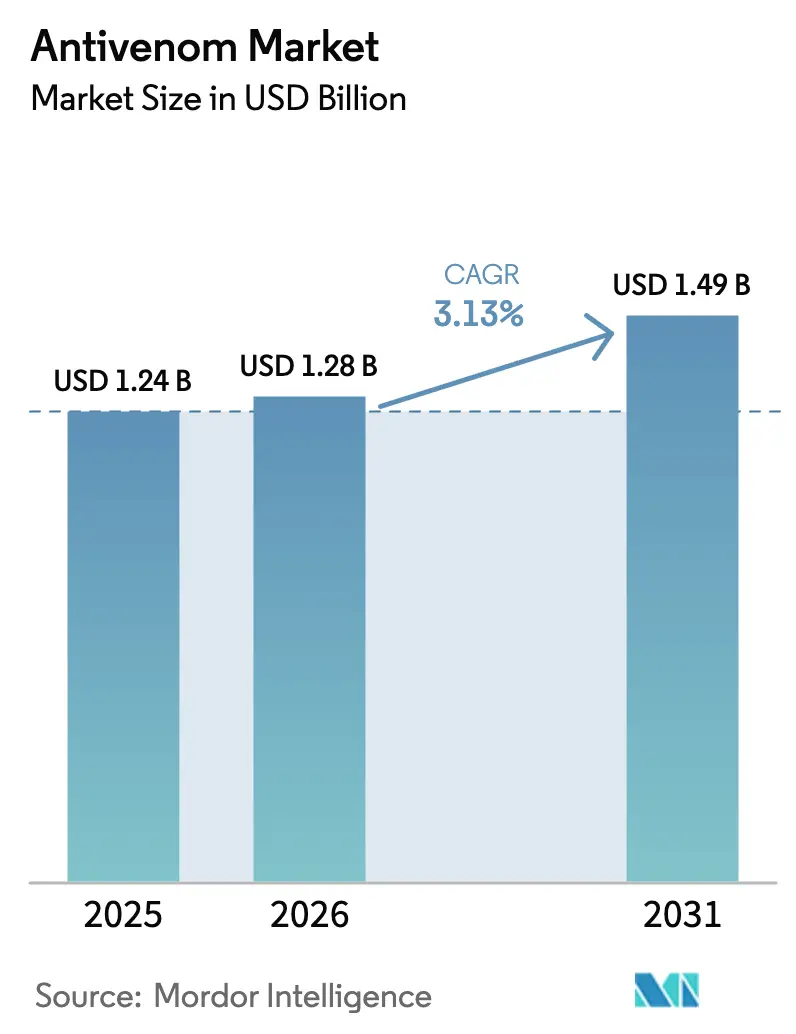
| Market Size (2026) | USD 1.28 Billion |
| Market Size (2031) | USD 1.49 Billion |
| Growth Rate (2026 - 2031) | 3.13% CAGR |
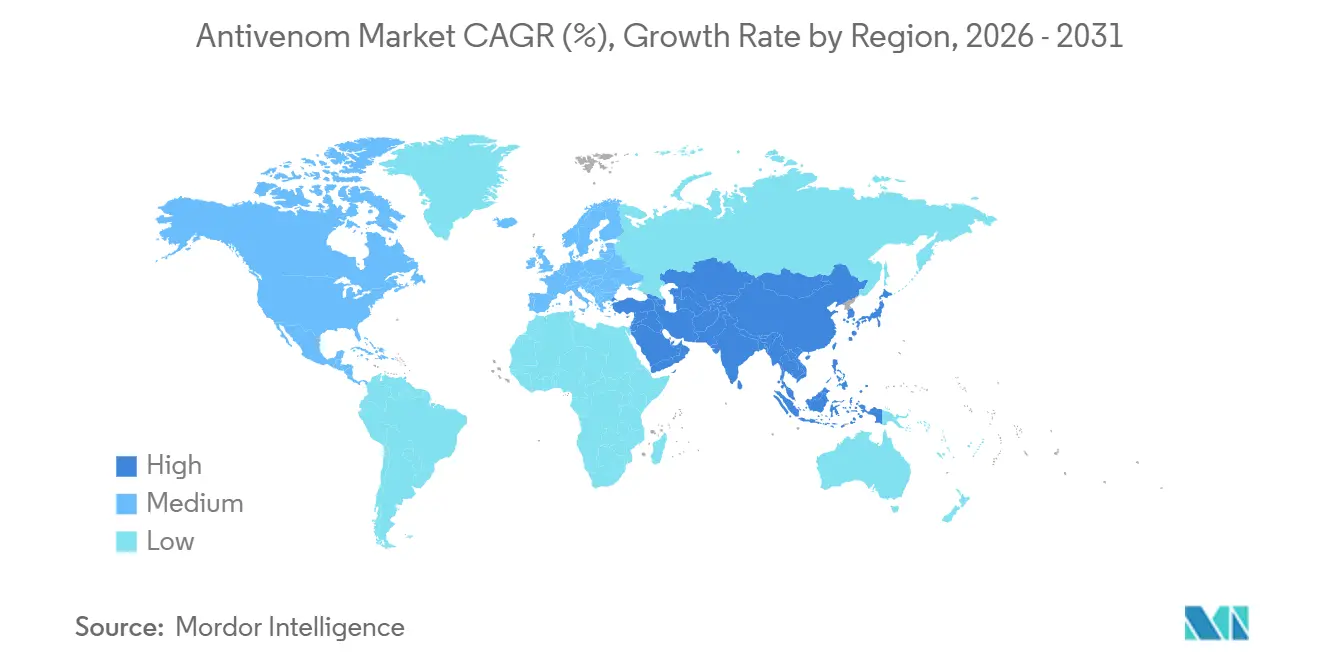
| Fastest Growing Market | Asia-Pacific |
| Largest Market | North America |
| Market Concentration | Medium |
Major Players *Disclaimer: Major Players sorted in no particular order Image © Mordor Intelligence. Reuse requires attribution under CC BY 4.0. | |
Antivenom Market Analysis by Mordor Intelligence
The Antivenom Market size is projected to be USD 1.24 billion in 2025, USD 1.28 billion in 2026, and reach USD 1.49 billion by 2031, growing at a CAGR of 3.13% from 2026 to 2031.
Rising snakebite incidence, government stockpiling, and WHO-driven quality standards are nudging demand upward, yet supply-chain gaps, cold-chain fragility, and high production costs temper momentum. Polyvalent equine formulations still dominate hospital formularies, but early clinical wins for recombinant monoclonal platforms foreshadow a gradual shift toward precision immunotherapy. Asia-Pacific, especially India and Southeast Asia, is moving fastest thanks to rural trauma infrastructure and mobile surveillance tools, while North America remains the highest-revenue region, supported by military and hospital contracts that enable premium pricing. Competitive intensity is climbing as the WHO prequalification weeds out substandard products and larger players consolidate to absorb GMP compliance costs.
Key Report Takeaways
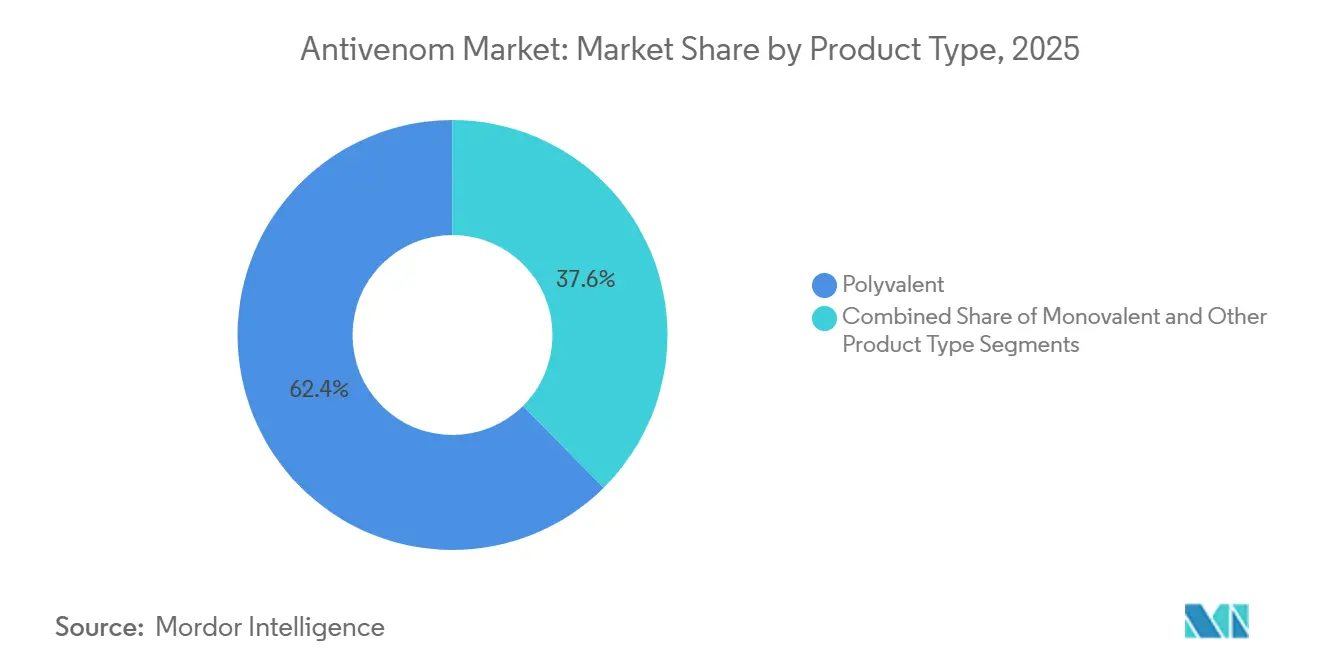
- By product type, polyvalent antivenoms captured 62.43% antivenom market share in 2025, whereas other product formats are projected to expand at a 5.65% CAGR through 2031.
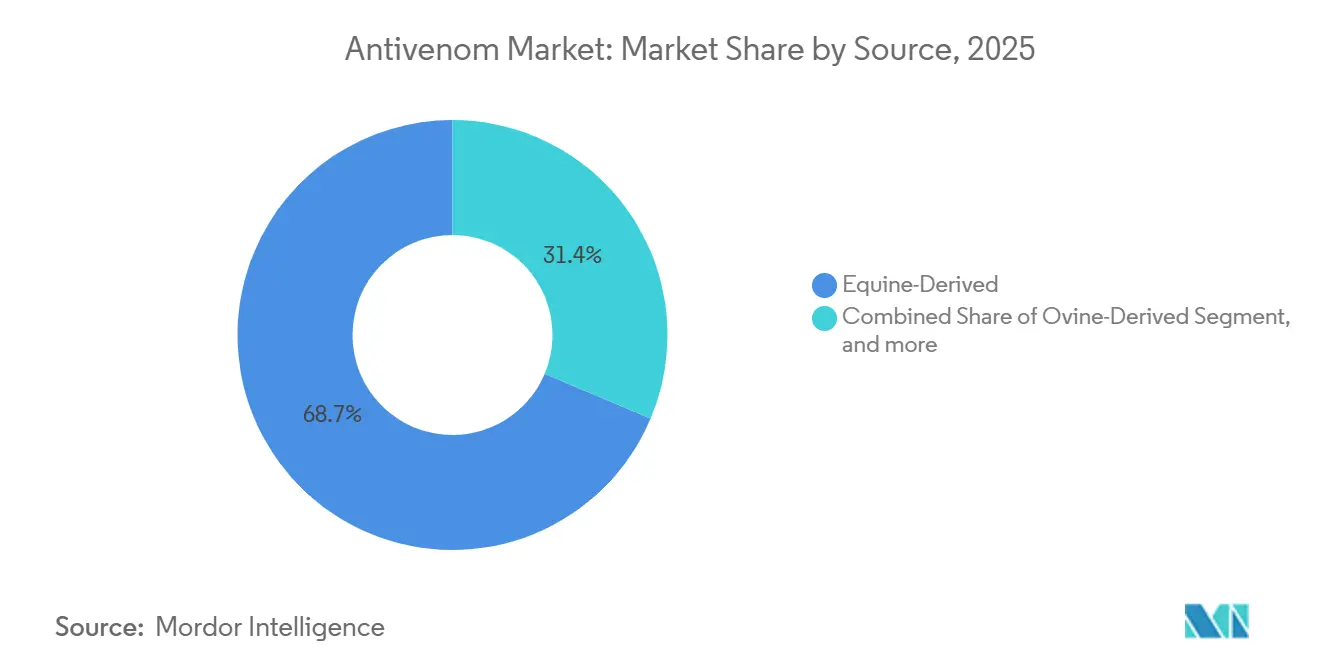
- By source, equine plasma accounted for 68.65% of the antivenom market size in 2025, yet recombinant DNA and monoclonal formats are advancing at a 5.78% CAGR to 2031.
- By end user, hospitals accounted for 71.32% of the antivenom market in 2025, while clinics and trauma centers are forecast to grow at a 6.32% CAGR through 2031.
- By geography, North America led with a 43.54% revenue share in 2025; Asia-Pacific is the fastest-growing region, set to grow at a 4.54% CAGR through 2031.
Note: Market size and forecast figures in this report are generated using Mordor Intelligence’s proprietary estimation framework, updated with the latest available data and insights as of January 2026.
Global Antivenom Market Trends and Insights
Driver Impact Analysis*
| Driver | (~) % Impact on CAGR Forecast | Geographic Relevance | Impact Timeline |
|---|---|---|---|
| Rising Incidence of Venomous Bites and Stings | +0.9% | South Asia, sub-Saharan Africa, Latin America | Medium term (2-4 years) |
| Expansion of Government Funding and Stockpiling Programs | +0.7% | Asia-Pacific, Middle East & Africa, South America | Medium term (2-4 years) |
| Advancements in Recombinant and Monoclonal Technologies | +0.5% | North America, Europe, spillover to Asia-Pacific | Long term (≥ 4 years) |
| Strengthening Rural Healthcare and Emergency Infrastructure | +0.4% | India, Brazil, Indonesia, parts of Africa | Medium term (2-4 years) |
| International Regulatory Harmonization and WHO Pre-Qualification | +0.6% | Global, early uptake in Africa and South Asia | Short term (≤ 2 years) |
| Growing Public Awareness and Digital Reporting Platforms | +0.3% | India, Southeast Asia, Latin America | Short term (≤ 2 years) |
| Source: Mordor Intelligence | |||
Rising Incidence of Venomous Bites and Stings
WHO records show 5.4 million snakebites a year, resulting in up to 138,000 deaths and 400,000 life-long disabilities[1]World Health Organization, “Snakebite Envenoming,” WHO.INT . India alone accounts for nearly half of global mortality, with peak cases during the monsoon planting season, when agricultural workers encounter kraits and cobras. Climate change is extending the range of venomous species into former temperate zones, enlarging the addressable patient pool. Under-reporting skews official counts downward; field studies indicate the real incidence could be 30-50% higher. Unless stockpiling and local production accelerate, demand may outpace the projected growth rate of the antivenom market, stressing current supply chains.
Expansion of Government Funding and Stockpiling Programs
Following WHO guidance, many high-burden countries now budget for proactive antivenom reserves rather than ad-hoc purchases. India mandates antivenom at primary health centers, guaranteeing offtake for domestic producers such as Serum Institute and Bharat Serums. Brazil’s public system relies on Instituto Butantan for national supply, illustrating vertical integration that insulates against import shocks. Military agencies in the United States and NATO allies also procure antivenoms for troops, creating a non-cyclical demand floor. Combined civilian and defense orders stabilize revenue, enabling manufacturers to invest in capacity upgrades.
Advancements in Recombinant & Monoclonal Technologies
A February 2024 Nature Communications study demonstrated a broadly neutralizing human monoclonal that cross-reacts with multiple elapid venoms[2]Ali Khalek et al., “Broadly Neutralizing Monoclonal Antibody Against Elapid Venoms,” Nature Communications, NATURE.COM. In October 2025, a bioRxiv paper introduced a nanobody-based candidate with improved tissue penetration. WHO released Target Product Profiles in January 2025, providing developers with clear benchmarks for efficacy and stability. Although no recombinant product has commercial approval, the regulatory groundwork is in place, and high-income payers are willing to pay a premium. As production costs decline, these platforms could capture a material share after 2030.
International Regulatory Harmonization and WHO Prequalification
WHO’s prequalified list now covers products from MicroPharm, Laboratorios Silanes, and Premium Serums, offering purchasers a vetted menu that discourages low-quality imports. A December 2024 workshop in Dubai united regulators from 23 countries and agreed on mutual recognition of risk-benefit assessments. WHO GMP audits in Mexico, Spain, Iran, and South Africa further signal that quality enforcement is widening beyond traditional pharmaceutical hubs. The emerging two-tier market rewards producers that invest in compliance and sidelines manufacturers with weak documentation, intensifying competitive pressure.
Restraint Impact Analysis*
| Restraint | (~) % Impact on CAGR Forecast | Geographic Relevance | Impact Timeline |
|---|---|---|---|
| Inadequate Cold Chain and Distribution Logistics | -0.4% | Rural Africa, South Asia, Amazon basin | Short term (≤ 2 years) |
| Venom Diversity Limiting Cross-Neutralization Efficacy | -0.3% | Africa, Asia-Pacific “venom hotspots” | Medium term (2-4 years) |
| Adverse Immunogenic Reactions to Animal-Derived Antivenoms | -0.2% | Global, higher reporting in developed markets | Long term (≥ 4 years) |
| Fluctuating Supply of High-Quality Equine/Ovine Plasma | -0.3% | Europe, Latin America, parts of Asia | Medium term (2-4 years) |
| Source: Mordor Intelligence | |||
Inadequate Cold Chain & Distribution Logistics
Antivenoms must be kept between 2–8 °C from the factory to the bedside, yet rural clinics often lack reliable power for refrigeration. Temperature excursions during last-mile transport degrade potency, wasting scarce inventory. Solar-powered refrigerators and portable carriers exist, but space is limited, competing with vaccines and insulin, leading to triage decisions based on turnover rather than clinical need. Ad hoc courier networks rarely monitor temperature, leaving health posts unaware of spoilage risks. Thermostable or lyophilized formulations could unlock untapped rural demand, but these technologies are still in early deployment.
Venom Diversity Limiting Cross-Neutralization Efficacy
Snake species display region-specific venom profiles, meaning a polyvalent antivenom effective in India might fail in West Africa. WHO’s regional Target Product Profiles require proof of neutralization against local dominant species. A March 2024 PLOS NTD study cataloged 127 marketed products and found many lacked published efficacy data for their target geographies. Thailand’s 2024 audit showed 42.7% of antivenom use was inappropriate, underscoring the clinical complexity[3]PLOS Neglected Tropical Diseases, “Global Antivenom Landscape,” PLOSNTDS.ORG. Recombinant antibodies targeting conserved venom epitopes promise broader coverage, but multi-regional clinical trials remain years away.
*Our forecasts treat driver/restraint impacts as directional, not additive. The impact forecasts reflect baseline growth, mix effects, and variable interactions.
Segment Analysis
By Product Type: Polyvalent Formulations Dominate Despite Efficacy Trade-Offs
Polyvalent antivenoms captured 62.43% of the antivenom market share in 2025, as emergency departments prefer broad-spectrum coverage to simplify inventory management. Other product formats such as lyophilized powders, Fab fragments, and experimental recombinant constructs are projected to expand at a 5.65% CAGR, signaling rising interest in precision therapy.
Hospitals value the one-vial-fits-many convenience of polyvalent products, yet these products carry antibodies irrelevant to each case, heightening the risk of adverse reactions. Regulatory guidance released in 2025 favors next-generation formats that meet tighter purity and stability metrics. Lyophilized versions remove cold-chain constraints, appealing to military and remote clinics, although reconstitution adds a time-critical step. As clinical evidence mounts, polyvalent dominance will erode gradually, making early investment in thermostable or recombinant lines a strategic play for 2030 and beyond.


By Source: Equine Plasma Anchors Supply, Recombinant Platforms Gain Traction
Equine plasma provided 68.65% of antivenom market size in 2025, reflecting a century of manufacturing know-how and relatively low variable cost. Ovine products remain niche but succeed where lower immunogenicity is valued, exemplified by BTG’s CroFab in the United States.
Recombinant monoclonal and nanobody candidates, though negligible in sales today, are slated to grow at 5.78% CAGR through 2031. They bypass horse husbandry constraints and offer scalable cell-culture production, but manufacturing costs are 3–5 times higher than for plasma-derived products. Europe and North America, where payers trade higher prices for safety, will likely host first launches. Equine plasma will remain the backbone of the antivenom market into the early 2030s, yet recombinant pipelines position leading firms for a gradual pivot.
By End-User: Hospitals Anchor Demand, Trauma Centers Drive Growth
Hospitals commanded 71.32% of antivenom market demand in 2025, as snakebite victims are routinely referred to tertiary facilities. Clinics and trauma centers are expected to post a 6.32% CAGR to 2031, reflecting policies that move stock closer to bite sites.
India requires antivenom at primary health centers, while Brazil deploys a mobile app to direct patients to stocked clinics. Smaller facilities need easy-to-administer formats and decision aids because staff may lack herpetology training. Bundling antivenom with smartphone algorithms that match species to product could reduce the 42.7% misuse rate reported in Thailand. Manufacturers that package dosing guides and offline decision tools can strengthen their value proposition in this fast-growing channel.
Geography Analysis
North America held 43.54% of the antivenom market revenue in 2025, supported by established hospital contracts and Defense Department procurement. Supply fragility persists; FDA extended Pfizer’s coral snake antivenin shelf life in 2025 because no alternative was available. Willingness to pay is high, enabling premium products like small-molecule varespladib-methyl to progress under Fast Track status.
Asia-Pacific is projected to register the fastest regional CAGR at 4.54% through 2031. India records 46,000 snakebite deaths annually, prompting domestic firms such as the Serum Institute and Bharat Serums to scale up production. Rural trauma infrastructure and 11 home-grown mobile snakebite apps improve patient routing. China’s Healthy China 2030 blueprint places antivenom on essential lists for township clinics, although detailed volumes remain undisclosed.
Europe, Middle East & Africa, and South America occupy the balance of demand. Sub-Saharan Africa now uses WHO’s eSURV platform in 46 countries, recording over 554,000 facility visits for snakebite since 2024. Public-private models, such as CSL’s Papua New Guinea donations, show how targeted programs can reach orphan geographies. Market expansion in these regions hinges on replacing substandard imports with WHO-approved options and securing donor finance.

Competitive Landscape
The moderate concentration of the antivenom market is defined by top players including CSL, Serum Institute of India, MicroPharm, Bharat Serums & Vaccines, and Instituto Butantan. WHO prequalification is tightening entry standards, disadvantaging low-cost suppliers that lack GMP credentials. MicroPharm’s 2024 purchase of Sanofi Pasteur’s equine portfolio signals consolidation aimed at scaling regulatory compliance costs.
Strategic patterns vary. Instituto Butantan controls venom extraction to final vial, giving Brazil supply security. CSL specializes in Australian and Papua New Guinean species, leveraging geographic expertise. Serum Institute provides broad polyvalent coverage across South Asia and holds long-term government tenders.
Emerging disruptors target white-space niches. Ophirex is developing varespladib-methyl, a small molecule that neutralizes phospholipase A2, while academic groups advance thermostable recombinant antibodies. Digital surveillance tools widen clinical insight but require offline functionality to reach rural Africa, a current gap in most apps. Incumbents with WHO-approved lines and robust distribution will likely preserve dominance through 2031, yet innovators that solve cold-chain or cross-neutralization challenges could capture premium segments.
Antivenom Industry Leaders
Pfizer Inc.
Merck KGaA (Sigma Aldrich)
Boehringer Ingelheim
CSL Limited
Bharat Serums and Vaccines Ltd
- *Disclaimer: Major Players sorted in no particular order


Recent Industry Developments
- December 2025: Australia’s onshore vaccine manufacturing advanced with the opening of CSL Seqirus’ new state-of-the-art influenza vaccine and antivenom facility in Melbourne, led by Minister Mark Butler. This development boosts local capacity for vaccine production and public health resilience.
- June 2024: MicroPharm Limited acquired Sanofi Pasteur’s antivenom equine immunoglobulin product range, comprising Viperfav, Bothrofav Scorpifav, Fav-Afrique, and Favirept. The transaction comprises the transfer of the intangible and some tangible assets to MicroPharm.


Global Antivenom Market Report Scope
As per the scope of the report, An anti-venom (or antivenin or antivenene) is a biological product used to treat venomous bites or stings. The anti-venom is created by extracting venom from the relevant species of animal, which includes snakes, spiders, insects, fish, etc.
The Anti-venom Market is Segmented by Species (Snake, Scorpion, Spiders, and Other Species), Anti-venom Type (Polyvalent Anti-venoms, Monovalent Anti-venom, and Other Anti-venom Types), and Geography (North America, Europe, Asia-Pacific, Middle East and Africa, and South America). The market report also covers the estimated market sizes and trends for 17 countries across major regions globally. The report offers the market size and forecasts in value (USD million) for the above segments.
| Polyvalent |
| Monovalent |
| Other Product Types |
| Equine-Derived |
| Ovine-Derived |
| Recombinant (DNA/Monoclonal) |
| Hospitals |
| Clinics & Trauma Centres |
| Military & Special-Purpose |
| North America | United States |
| Canada | |
| Mexico | |
| Europe | Germany |
| United Kingdom | |
| France | |
| Italy | |
| Spain | |
| Rest of Europe | |
| Asia-Pacific | China |
| Japan | |
| India | |
| Australia | |
| South Korea | |
| Rest of Asia-Pacific | |
| Middle East & Africa | GCC |
| South Africa | |
| Rest of Middle East & Africa | |
| South America | Brazil |
| Argentina | |
| Rest of South America |
| By Product Type | Polyvalent | |
| Monovalent | ||
| Other Product Types | ||
| By Source | Equine-Derived | |
| Ovine-Derived | ||
| Recombinant (DNA/Monoclonal) | ||
| By End-User | Hospitals | |
| Clinics & Trauma Centres | ||
| Military & Special-Purpose | ||
| Geography | North America | United States |
| Canada | ||
| Mexico | ||
| Europe | Germany | |
| United Kingdom | ||
| France | ||
| Italy | ||
| Spain | ||
| Rest of Europe | ||
| Asia-Pacific | China | |
| Japan | ||
| India | ||
| Australia | ||
| South Korea | ||
| Rest of Asia-Pacific | ||
| Middle East & Africa | GCC | |
| South Africa | ||
| Rest of Middle East & Africa | ||
| South America | Brazil | |
| Argentina | ||
| Rest of South America | ||


Key Questions Answered in the Report
What CAGR is expected for the antivenom market through 2031?
The market is forecast to expand at a 3.13% CAGR between 2026 and 2031.
Which region is projected to grow the fastest?
Asia-Pacific is expected to post the highest growth at a 4.54% CAGR, led by India, Southeast Asia, and China.
Why do polyvalent antivenoms still dominate hospital purchases?
Hospitals prefer broad-spectrum coverage that reduces the risk of stocking the wrong product, even though it may include non-target antibodies.
How are regulatory changes influencing supply quality?
WHO prequalification and shared risk-benefit frameworks are raising quality standards, pushing low-evidence products out of public tenders.
What innovations could ease cold-chain constraints?
Lyophilized or thermostable formulations and nanobody constructs can tolerate higher temperatures, reducing reliance on refrigeration.
Which companies recently consolidated their portfolios?
MicroPharm acquired Sanofi Pasteur's equine antivenom line in 2024 to scale up compliance with WHO and GMP requirements.
Page last updated on:


