
Antimicrobial Susceptibility Testing Market Size and Share
Market Overview
| Study Period | 2020 - 2031 |
|---|---|
| Market Size (2026) | USD 4.97 Billion |
| Market Size (2031) | USD 6.57 Billion |
| Growth Rate (2026 - 2031) | 5.74 % |
| Fastest Growing Market | Asia-Pacific |
| Largest Market | North America |
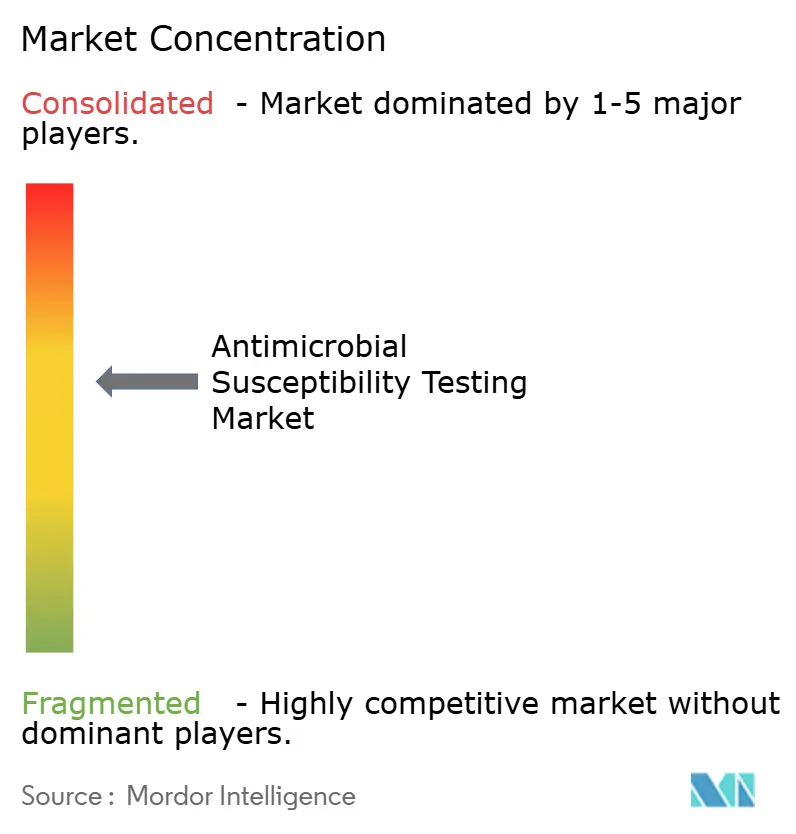
| Market Concentration | Medium |
Major Players *Disclaimer: Major Players sorted in no particular order Image © Mordor Intelligence. Reuse requires attribution under CC BY 4.0. | |
Antimicrobial Susceptibility Testing Market Analysis by Mordor Intelligence
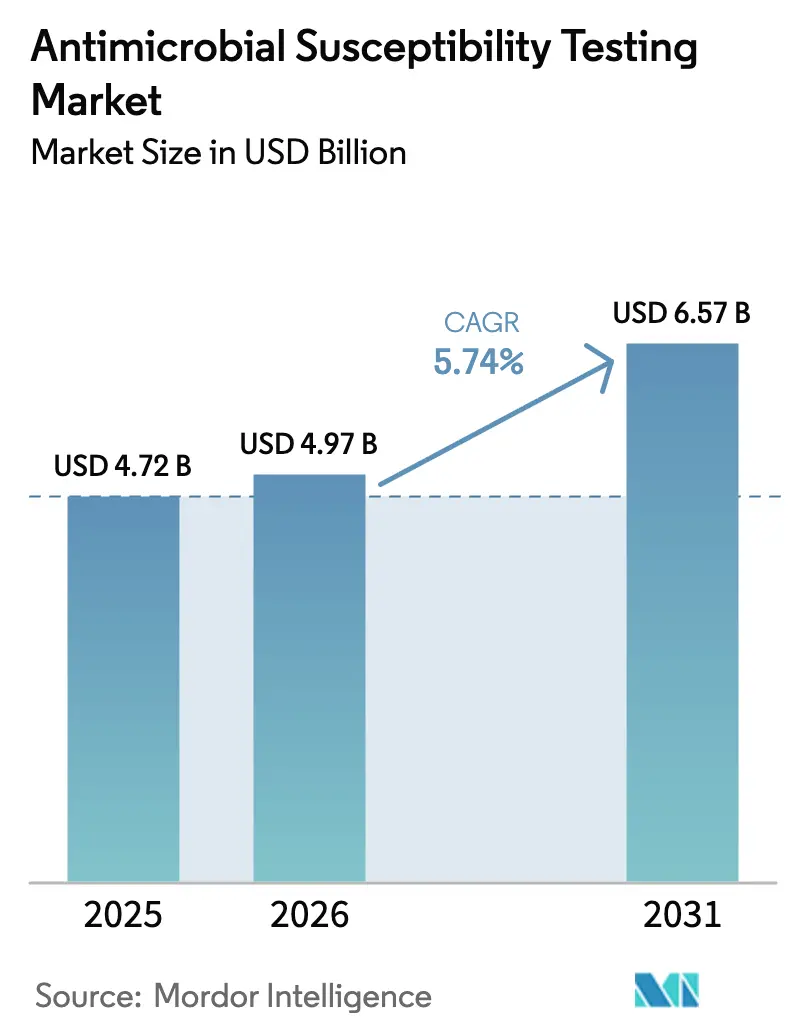
The Antimicrobial Susceptibility Testing Market size is projected to expand from USD 4.72 billion in 2025 and USD 4.97 billion in 2026 to USD 6.57 billion by 2031, registering a CAGR of 5.74% between 2026 to 2031.
This growth is driven by increasing antimicrobial resistance (AMR), stricter reimbursement policies requiring laboratory confirmation before prescribing, and regulatory approvals accelerating phenotypic result delivery. Automated platforms are increasingly replacing manual methods as hospitals prioritize same-day results; however, budget constraints in low-resource settings continue to sustain the use of disk diffusion methods. The Asia–Pacific region is emerging as a key growth area, supported by government investments in microbiology labs and heightened sepsis awareness, which are driving demand for instruments. Market players are focusing on faster result turnaround, enhanced data interoperability, and compliance with CLSI AUTO15/AUTO16 autoverification standards to meet the growing demand for machine-read outcomes that integrate directly into electronic health records. Additionally, pharmaceutical companies are embedding susceptibility profiling into Phase 1–3 clinical trials, expanding the market beyond routine diagnostics.
Key Report Takeaways
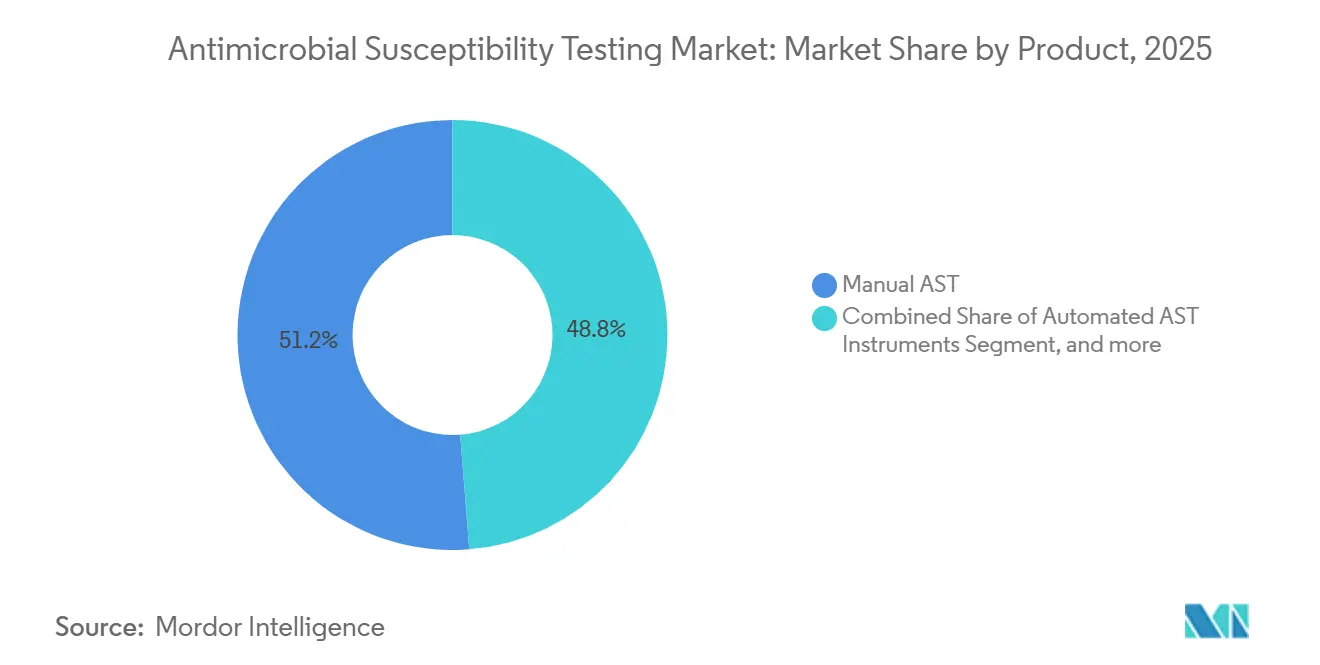
- By product category, manual methods accounted for 51.25% of the antimicrobial susceptibility testing market share in 2025, while automated instruments are expected to expand at a 7.54% CAGR through 2031.
- By testing type, antibacterial panels led with 42.43% revenue share in 2025; antiparasitic assays are the fastest riser, advancing at a 7.66% CAGR to 2031.
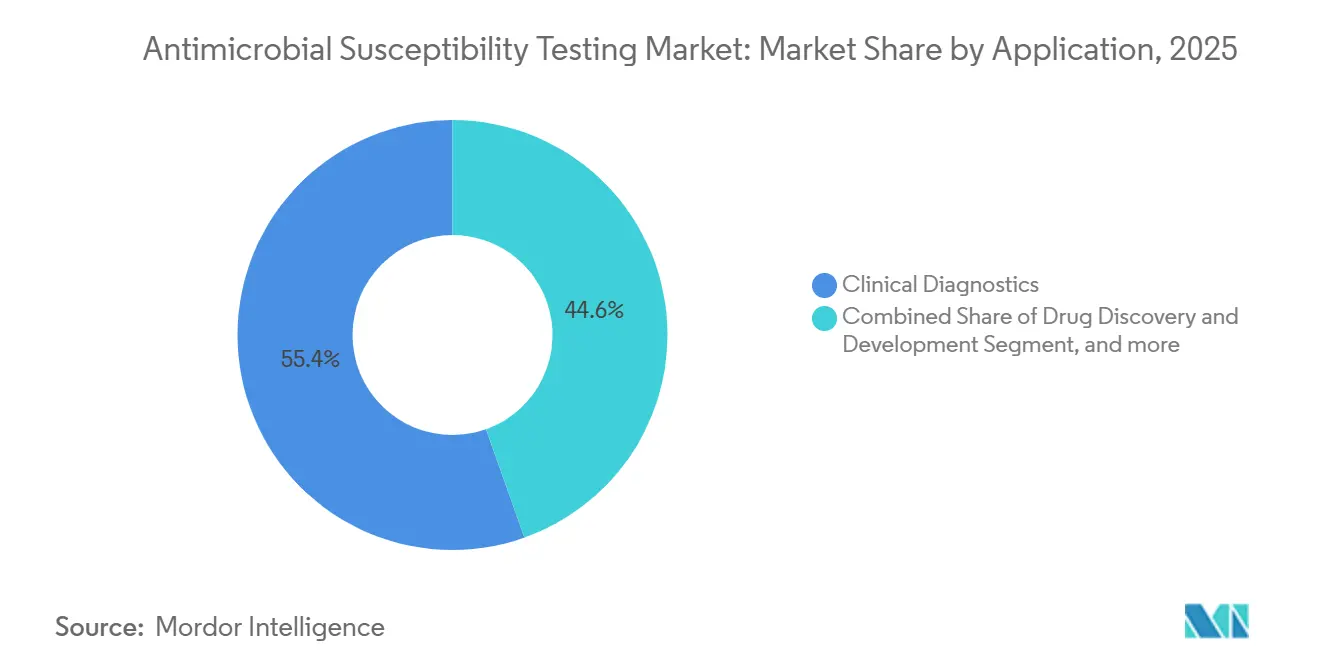
- By application, clinical diagnostics accounted for 55.43% of revenue in 2025, whereas pharmaceutical and biotechnology adoption is expected to accelerate at an 8.54% CAGR through 2031.
- By end user, hospital laboratories generated 41.63% of 2025 revenue, yet pharmaceutical–biotech users exhibit the highest growth at an 8.32% CAGR over the forecast window.
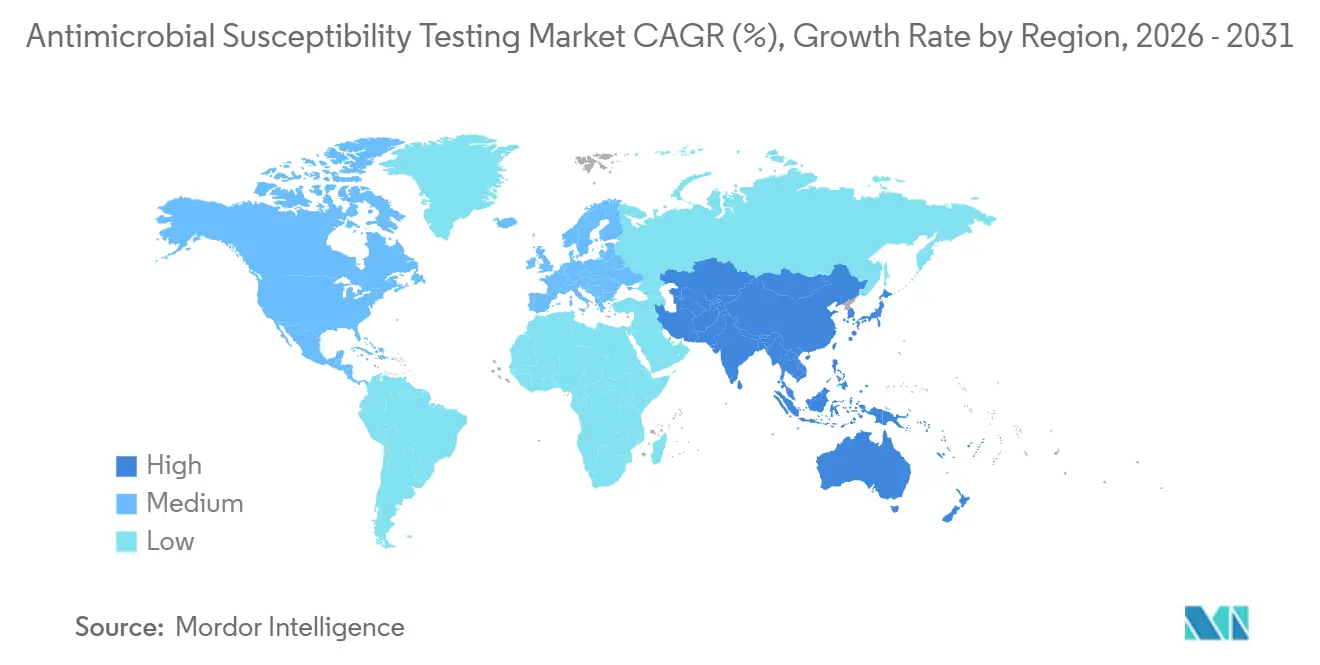
- By geography, North America retained 42.95% of 2025 revenue, while the Asia-Pacific is projected to post the quickest regional expansion at a 6.43% CAGR up to 2031.
Note: Market size and forecast figures in this report are generated using Mordor Intelligence’s proprietary estimation framework, updated with the latest available data and insights as of January 2026.
Market Trends and Insights
Drivers Impact Analysis of Antimicrobial Susceptibility Testing Market*
| Driver | (~) % Impact on CAGR Forecast | Geographic Relevance | Impact Timeline |
|---|---|---|---|
| Escalating Global Antimicrobial Resistance Burden | +1.8% | Global, acute in South Asia and Sub-Saharan Africa | Long term (≥ 4 years) |
| Pharmaceutical and Biotechnology Pipeline Integration of AST | +1.2% | North America and Western Europe R&D hubs | Medium term (2-4 years) |
| Precision Medicine Movement Toward Targeted Antimicrobial Therapy | +0.9% | North America, Western Europe, urban Asia-Pacific | Medium term (2-4 years) |
| Adoption of Rapid Phenotypic AST Platforms for Point-of-Care Decision Making | +1.4% | Early-adopter tertiary hospitals worldwide | Short term (≤ 2 years) |
| Government-Funded Stewardship Mandates Linking Reimbursement to Diagnostic Confirmation | +0.8% | United States, European Union, select Asia-Pacific markets | Medium term (2-4 years) |
| Cloud-Enabled AST Data Networks Powering Real-Time Resistance Surveillance | +0.6% | High-income regions with mature health-IT infrastructure | Long term (≥ 4 years) |
| Source: Mordor Intelligence | |||
Escalating Global Antimicrobial Resistance Burden
The 2024 Global Burden of Disease study attributed 1.14 million direct deaths to AMR in 2021 and warned that cumulative mortality could hit 39 million by 2050 if current trends persist[1]The Lancet AMR Collaborators, “Global Burden of Bacterial Antimicrobial Resistance,” THELANCET.COM. WHO’s 2025 GLASS report logged susceptibility data from 104 countries, up from 87 in 2023, and set a 2030 goal for 80% of members to achieve national diagnostic capacity. In India, intensive-care units reported New Delhi metallo-β-lactamase prevalence above 30%, driving calls for rapid carbapenem-sparing guidance. Europe’s EARS-Net processed 474,364 invasive isolates in 2024 and piloted cefiderocol panels to track resistance to last-resort agents. Yet fewer than 40% of labs in low-income countries can run standardized antimicrobial susceptibility testing (AST), leaving a gap for affordable, low-complexity platforms.
Pharmaceutical and Biotechnology Pipeline Integration of AST
Spero Therapeutics secured FDA approval in September 2024 for tebipenem HBr after Phase 3 trials that used real-time susceptibility data to refine dosing, trimming review timelines. GlaxoSmithKline’s gepotidacin program employed high-throughput AST to map resistance emergence and support 2024 breakpoint proposals to CLSI. FDA guidance issued that same year encourages co-submission of antimicrobials and companion AST assays, enabling synchronized market entry. Contract research organizations reported a 40% increase in AST service requests from biotech clients between 2023 and 2025, as investors demanded pharmacodynamic evidence ahead of Phase 2 funding rounds.
Precision Medicine Movement Toward Targeted Antimicrobial Therapy
The U.S. CDC launched its Electronic Test Orders and Results program in 2024 to directly integrate AST outputs into electronic health records, enabling earlier de-escalation of broad-spectrum therapy[2]Centers for Disease Control and Prevention, “Electronic Test Orders and Results Initiative,” CDC.GOV. Thermo Fisher’s Sensititre platform is helping hospitals comply with Joint Commission stewardship criteria that require susceptibility-based audits. A 2025 systematic review found rapid AST cuts hospital stay by 1.2–2.5 days and saves USD 3,000–8,000 per sepsis patient in high-income settings. The European Medicines Agency began enforcing susceptibility testing before veterinary use of critically important antimicrobials in 2024. Despite clinical value, private U.S. insurers reimbursed fewer than half of rapid phenotypic AST claims outside bloodstream infections as of mid-2025.
Adoption of Rapid Phenotypic AST Platforms for Point-of-Care Decision Making
bioMérieux’s VITEK REVEAL, FDA-cleared in June 2024, delivers phenotypic results 5.5–6 hours after a positive blood culture, enabling same-day sepsis therapy optimization. Accelerate Diagnostics’ Pheno system produces identification and susceptibility results in approximately 7 hours, bypassing overnight incubation. BARDA funded Selux Diagnostics in 2024 to craft a sub-4-hour point-of-care AST device for emergency departments, citing a 7% mortality increase per hour of delayed appropriate therapy. T2 Biosystems received FDA clearance in 2024 for the T2Resistance Panel, which identifies 13 resistance genes in 3–5 hours directly from positive blood culture, eliminating subculture delays. The FDA demands evidence that rapid AST alters prescribing and improves outcomes, while raising development costs and lengthening the time-to-market.
Restraints Impact Analysis of Antimicrobial Susceptibility Testing Market*
| Restraint | (~) % Impact on CAGR Forecast | Geographic Relevance | Impact Timeline |
|---|---|---|---|
| High Upfront Instrumentation Costs and Limited Reimbursement Pathways | -1.1% | Global, acute in low-resource and community hospitals | Short term (≤ 2 years) |
| Fragmented Global Regulatory and Breakpoint Harmonization Challenges | -0.7% | Divergence between CLSI and EUCAST regions | Medium term (2-4 years) |
| Genotype–Phenotype Discordance Limiting Confidence in Rapid Molecular Assays | -0.5% | Global, especially for complex resistance mechanisms | Medium term (2-4 years) |
| Laboratory Workforce Shortages in Low-Resource Settings | -0.6% | Sub-Saharan Africa, South Asia, parts of Latin America | Long term (≥ 4 years) |
| Source: Mordor Intelligence | |||
High Upfront Instrumentation Costs and Limited Reimbursement Pathways
Automated AST systems often cost more than USD 100,000, while consumables run USD 15–30 per test; yet, U.S. Medicare reimburses rapid phenotypic AST at only USD 18–22, forcing hospitals to absorb these losses[3]Centers for Medicare & Medicaid Services, “Clinical Laboratory Fee Schedule CY 2024,” CMS.GOV. As of mid-2025, private insurers covered fewer than 50% of claims, limiting uptake outside academic centers. India’s Atmanirbhar Bharat program funded USD 36.5 million for 12 reference labs—barely 0.1% of its estimated 100,000 labs—so most facilities still rely on 18- to 24-hour disk diffusion. A 2024 survey across Sub-Saharan Africa showed 60% of labs lack staff trained in automated AST, even when instruments are donated. Leasing and reagent-rental contracts ease capital expenditures (CAPEX) but shift costs to operational budgets, creating vendor lock-in.
Fragmented Global Regulatory and Breakpoint Harmonization Challenges
CLSI and EUCAST issued joint disk-potency procedures in 2025, yet interpretive criteria for agents such as cefiderocol still diverge, complicating multinational trials. EUCAST version 15.0, released in January 2025, updated eight drug–organism pairs, while CLSI’s M100-34 introduced alternate susceptible-dose-dependent categories in February, causing a one-month misalignment. FDA guidance advocates synchronous drug-diagnostic submissions, but regulatory calendars remain asynchronous. Genotype-phenotype discordance persists; a 2024 Nature study demonstrated that the detection of blaCTX-M did not always translate to phenotypic resistance, necessitating confirmation and incurring additional costs. Labs maintaining dual CLSI/EUCAST workflows double quality-control expenses and training requirements.
*Our forecasts treat driver/restraint impacts as directional, not additive. The impact forecasts reflect baseline growth, mix effects, and variable interactions.
Antimicrobial Susceptibility Testing Market Segment Analysis
By Product:
Automation Gains Traction but Manual Methods LingerThe segment generated the largest share in 2025, when manual procedures still accounted for 51.25% of the antimicrobial susceptibility testing market revenue, due to their low capital requirements. However, automated systems are forecast to advance at a 7.54% CAGR as laboratories chase faster turnaround times and data integration. bioMérieux’s VITEK COMPACT PRO, cleared in 2024, now ships with CLSI AUTO15-compliant autoverification, trimming errors tied to manual transcription. Consumables create sticky revenue; labs spend USD 15–30 per run on panels, media, and controls. Becton Dickinson’s EpiCenter software aggregates outputs across multiple hospitals, delivering stewardship dashboards that extend value beyond the hardware.
Capital constraints and regulatory inertia prolong manual usage, especially in low-income settings where national guidelines do not compel automation. Workforce shortages are shifting opinions: a 2024 cross-Africa survey found that 60% of lab directors viewed automation as a labor multiplier rather than a luxury. Vendors are also bundling identification and susceptibility; Bruker is adapting MALDI-TOF mass spectrometry to flag carbapenemase production, allowing laboratories to justify combined purchases. The dual benefit of speed and reduced hands-on time is expected to accelerate adoption, but success hinges on financing models that ease upfront cost burdens.



By Testing Type:
Antibacterial Dominance Faces Emerging Pathogen PressureAntibacterial panels accounted for 42.43% of 2025 revenue, underscoring their centrality to clinical practice. Nonetheless, antiparasitic assays are the fastest-growing sub-segment, with a 7.66% CAGR, driven by WHO reports of partial artemisinin resistance in six African nations, which demand phenotypic confirmation of kelch13 mutations. Antifungal testing is gaining urgency after Candida auris outbreaks; the CDC counted 3,270 clinical U.S. cases in 2024, fueling hospital adoption of Thermo Fisher’s Sensititre YeastOne system. Automated antifungal panels remain under-penetrated, presenting a white space for vendors. Antiviral AST remains niche, primarily limited to HIV and influenza surveillance.
Mycobacterial testing operates in a separate regulatory lane through the WHO’s Global Laboratory Initiative, relying on MGIT liquid culture and requiring biosafety infrastructure that is often absent in many local labs. The market also lacks integrated molecular-plus-phenotypic platforms for malaria and other parasites, opening development opportunities funded by BARDA and the Wellcome Trust. Collectively, these trends diversify revenue streams away from mature antibacterial offerings.
By Application:
Diagnostics Lead, Drug Discovery AcceleratesClinical diagnostics retained 55.43% of 2025 revenue, as hospitals rely on AST to guide prescribing; however, drug discovery is projected to grow at an annual rate of 8.54% through 2031. Spero Therapeutics’ tebipenem approval demonstrated that real-time AST could shorten the regulatory review process, while GSK utilizes high-throughput susceptibility screens during lead optimization. CROs consequently report a 40% rise in AST outsourcing demand between 2023 and 2025. Public health surveillance relies on GLASS, which processed 23 million isolates in 2025, but still struggles with inconsistent species identification and breakpoint use.
Veterinary adoption is growing following the European Medicines Agency's mandate for susceptibility testing before dispensing critical antimicrobials to livestock, creating an incentive for VetCAST-aligned panels. Environmental monitoring is emerging: a 2025 Nature study detected 82 AMR genes in Indian sewage, spotlighting the need for tools that track resistance outside clinical settings. These diversified applications reduce reliance on hospital budgets and create multi-segment resilience.
By End User:
Hospital Labs Dominate but Pharma Uptake ClimbsHospitals supplied 41.63% of 2025 revenue, because stewardship mandates tie reimbursement to timely AST. Yet, pharmaceutical–biotech buyers are the fastest-growing cohort, with an 8.32% CAGR, as developers integrate susceptibility data into trials. Reference laboratories exploit economies of scale to handle antifungal and antiparasitic panels that small hospitals cannot maintain cost-effectively. Academic centers contribute to method development but represent modest commercial volume.
Hospitals wrestle with reimbursement gaps; Medicare’s USD 18–22 per rapid test often fails to cover consumables and depreciation costs, slowing uptake in community settings. Reference labs, such as Quest and LabCorp, invest in automation to boost throughput, but falling fee-for-service rates pressure their margins. Pharma users, by contrast, accept premium pricing because faster AST can shave months off drug-approval timelines, enabling vendors to charge for customized, high-throughput panels.
Geography Analysis
North America Antimicrobial Susceptibility Testing Market
North America accounted for 42.95% of 2025 revenue, driven by CDC efforts to digitize test orders and results, as well as CPT codes that recognize rapid phenotypic AST. Still, reimbursement averaging USD 20 per test lags full cost recovery, limiting adoption to tertiary centers. Canada is piloting centralized provincial labs to serve remote regions, but differing reimbursement rules are slowing the national rollout. BARDA’s 2024 grant to Selux Diagnostics underlines the U.S. federal commitment to sub-4-hour sepsis testing.
Europe Antimicrobial Susceptibility Testing Market
Europe benefits from EUCAST’s annually refreshed breakpoints—version 15.0 added eight organism–drug pairs in 2025—and from EARS-Net surveillance, which covers 474,364 isolates. EMA rules now compel veterinary AST before prescribing the highest-priority antimicrobials, widening the customer base. Nonetheless, reimbursement disparities persist; Germany reimburses rapid AST under DRG, while southern Europe lacks dedicated codes. DARWIN EU real-world evidence supports post-market surveillance but has yet to harmonize payment models.
APAC Antimicrobial Susceptibility Testing Market
The Asia-Pacific region is the fastest-growing, forecast to grow at a 6.43% CAGR through 2031. India’s government allocated USD 36.5 million for 12 advanced microbiology centers, and China has integrated AST into provincial AMR surveillance. Japan’s universal coverage eases adoption, though hospital consolidation is shifting volumes to central labs. South Korea introduced tiered reimbursement in 2024 that pays more for rapid AST, aligning financial incentives with stewardship goals. However, rural labs still face staff shortages, echoing challenges seen in less developed regions. National AMR action plans in select emerging markets create smaller but notable growth pockets.

Regulatory Landscape
Antimicrobial susceptibility testing (AST) devices are regulated as in vitro diagnostics, with the United States primarily using the FDA 510(k) pathway under 21 CFR Part 866. In addition to device clearance by CDRH, FDA CDER is involved in establishing and updating antibacterial susceptibility test interpretive criteria (breakpoints), which drives label updates and panel content decisions for AST platforms used in clinical care and trials.
Standard-setting updates continue to affect compliance requirements and day-to-day workflows across regions. The FDA recognized CLSI M100 updates on an ongoing basis, and newer editions, including CLSI M100-Ed36 (published in January 2026), along with EUCAST breakpoint tables (with January 2026 validity of updated tables), increase the cadence of breakpoint change management for manufacturers and laboratories. In the European Union, IVDR (EU 2017/746) serves as the core framework for IVD market access, while EUCAST provides breakpoint and quality control guidance that laboratories and suppliers align to alongside country-specific implementation practices.
Competitive Landscape
Market concentration is moderate, with bioMérieux, Becton Dickinson, and Thermo Fisher maintaining strong positions through established installed bases and recurring consumable streams. bioMérieux has enhanced its competitive positioning with the VITEK REVEAL, offering a 5.5-hour phenotypic output tailored for sepsis workflows. Becton Dickinson is focusing on analytics by leveraging its EpiCenter platform to provide stewardship dashboards for multi-hospital networks. Thermo Fisher’s Sensititre, integrating EUCAST/CLSI breakpoints, supports accreditation audits, further strengthening its market presence.
Challengers are driving innovation with faster diagnostic modalities. T2 Biosystems’ T2Resistance Panel delivers results for 13 genes directly from blood culture in under 5 hours, appealing to emergency departments that prioritize rapid diagnostics. Accelerate Diagnostics offers 7-hour phenotypic results but faces the challenge of stabilizing its financial position following its 2024 restructuring. Resistell’s nanomotion AST claims a turnaround time of under 4 hours, though regulatory pathways for purely physical readouts remain underdeveloped. Vendors must also navigate CLSI AUTO15/AUTO16 integration requirements, a challenge that favors companies with advanced software capabilities.
Patent activity highlights a convergence of identification and susceptibility technologies. Bruker is adapting its MALDI-TOF platform for carbapenemase detection, creating opportunities to cross-sell to its existing identification customer base. Meanwhile, low-resource markets remain underserved, with two-thirds of laboratories in Sub-Saharan Africa lacking AST capacity. This gap presents a significant opportunity for rugged, energy-efficient diagnostic platforms.
Antimicrobial Susceptibility Testing Industry Leaders
bioMérieux SA
Becton Dickinson, and Company
Thermo Fisher Scientific Inc.
Bio-Rad Laboratories, Inc.
Danaher Corporation
- *Disclaimer: Major Players sorted in no particular order
Antimicrobial Susceptibility Testing Market Companies Covered in this Report
- Accelerate Diagnostics, Inc.
- Alifax Srl
- Beckton Dickinson
- bioMérieux
- Bruker
- Creative Diagnostics
- Danaher
- HiMedia Laboratories
- Liofilchem S.r.l.
- Luminex
- Mast Group Ltd.
- Merck
- QIAGEN
- Resistell
- Seegene
- T2 Biosystems, Inc.
- Thermo Fisher Scientific
Read Analysis of Antimicrobial Susceptibility Testing Companies

Market Opportunities and Future Outlook
A material whitespace remains in shortening time-to-actionable AST for acute care while maintaining results that hold up against reference standards and breakpoint updates. Recent clinical and proof-of-concept evidence points to how direct-from-sample and rapid phenotypic approaches can compress reporting timelines: a May 2026 clinical evaluation of the LifeScale AST system in Gram-negative bloodstream infections reported a median turnaround time of 8.6 hours versus 48.1 hours for standard methods, while February 2026 academic work on QolorPhAST described minute-scale workflows with reported agreement metrics for AST. These findings support earlier insertion of such systems into sepsis pathways, particularly as hospitals prioritize same-day decisions.
Regulatory and surveillance programs are also creating opportunities for vendors that can operationalize frequent breakpoint refreshes and support interoperability. FDA recognition of updated CLSI standards in 2026, including M100 and antifungal standards for yeasts and filamentous fungi, increases the value of software-led change control, autoverification, and panel update mechanisms that limit downtime when interpretive criteria change. On the demand side, WHO GLASS participation expanded to 141 countries and territories by late 2024, and ECDC initiated the EURGen-Net CRE25 survey in January 2026 across 37 countries, reinforcing the need for scalable AST data pipelines with consistent methodologies that can serve both routine diagnostics and resistance surveillance.
Recent Industry Developments in Antimicrobial Susceptibility Testing Market
- April 2026: Thermo Fisher Scientific announced a definitive agreement to sell its microbiology business, including antimicrobial susceptibility testing and culture media offerings, to Astorg for approximately USD 1.075 billion. The transaction reshapes ownership of a major installed-base portfolio and can influence competitive behavior in AST instruments, consumables, and workflow solutions as the business transitions to a dedicated investment platform. Closing was communicated for the second half of 2026, signaling a near-term shift in channel and product-strategy priorities for customers and partners.
- August 2025: Becton, Dickinson and Company received FDA 510(k) clearance for the BD Phoenix Automated Microbiology System for GN Eravacycline (K251713). The clearance supports broader adoption of updated antibacterial panels on an established automated AST platform and helps labs align testing menus with evolving treatment options. It also reinforces the importance of timely regulatory clearances tied to breakpoint and panel updates.
- March 2025: bioMerieux received FDA 510(k) clearance for VITEK COMPACT PRO, an identification and antimicrobial susceptibility testing system positioned for small and medium-sized laboratories. The clearance supports expansion of automation into resource-constrained labs that need faster turnaround and standardized reporting without the complexity of high-throughput systems. bioMerieux also communicated a phased commercialization approach, beginning in select countries with a broader rollout starting in Q2 2025.


Antimicrobial Susceptibility Testing Market Report Scope and Research Methodology
Market Definition and Coverage
This market covers the revenues generated from products and related services used to determine how sensitive pathogens are to antimicrobial drugs, so clinicians and labs can select an effective therapy. It includes routine and advanced testing in laboratory workflows that report susceptibility profiles.
Scope exclusions: over-the-counter rapid self-testing products intended for home use are excluded from this sizing.
Segments Covered in This Report
- By Product
- Manual AST
- MIC Strips
- Susceptibility Plates
- Disk Diffusion Kits
- Others
- Automated AST Instruments
- Semi-Automated Systems
- Fully Automated Systems
- Consumables and Reagents
- Software and Services
- Manual AST
- By Testing Type
- Antibacterial
- Antifungal
- Antiparasitic
- Antiviral AST
- Others
- By Application
- Clinical Diagnostics
- Drug Discovery and Development
- Epidemiology and Surveillance
- Veterinary Applications
- Environmental Monitoring
- By End User
- Hospital Laboratories
- Reference Laboratories
- Pharmaceutical & Biotechnology Companies
- Academic and Research Institutes
- Contract Research Organizations (CROs)
- Geography
- North America
- United States
- Canada
- Mexico
- Europe
- Germany
- United Kingdom
- France
- Italy
- Spain
- Rest Of Europe
- Asia-Pacific
- China
- Japan
- India
- Australia
- South Korea
- Rest Of Asia-Pacific
- Middle East And Africa
- GCC
- South Africa
- Rest Of Middle East And Africa
- South America
- Brazil
- Argentina
- Rest Of South America
- North America
Data Sources, Market Sizing, and Validation
Desk Research
Desk research was used to build the base structure of the model and keep assumptions grounded in real testing activity and disease burden trends. We referenced public source types such as the World Health Organization AMR updates, US CDC surveillance publications, and ECDC reports, which helped frame demand drivers and testing intensity by region.
To translate demand into value, the review also used pricing and volume context from sources such as FDA and CDC laboratory guidance, peer-reviewed journals on AST methods, and trade association materials for clinical microbiology labs. Company annual reports, investor decks, and reputable press releases were used to validate product mix direction, automation adoption, and the pace of rapid-method penetration. Select paid database subscriptions were used for company financials and intelligence, news and financials, and patent databases to sanity-check innovation focus and revenue exposure. These desk sources are illustrative only, and other public references were reviewed for data collection, validation, and clarification.
Primary Interviews and Surveys
Primary work focused on confirming what gets purchased and how it is priced across instruments, consumables, and service-related items tied to AST workflows. We spoke with diagnostic lab decision-makers, hospital laboratory teams, distributors, and technical specialists across APAC, EMEA, and the Americas. This helped clarify test-mix shifts and the practical adoption curve of automated and rapid AST in routine lab settings.
Distribution of primary research fieldwork respondents
| Company type | Respondent position | Region |
|---|---|---|
| Top tier: 30% | CXOs: 16% | APAC: 44% |
| Mid tier: 54% | Functional/Unit leaders: 26% | EMEA: 29% |
| Smaller Players: 16% | Managers: 58% | Americas: 27% |
Market-Sizing & Forecasting
Sizing starts with a top-down build where the treated and tested demand pool is reconstructed from infection burden signals and diagnostic testing capacity, and then converted into value using a practical product mix and average selling price logic. The model is checked through selective bottom-up approximations, such as rolling up sampled supplier revenue exposure by geography, and channel checks on instrument placements tied to recurring consumables.
The key inputs used in the model include AMR and healthcare-associated infection reporting trends, clinical microbiology test volumes and lab throughput indicators, the share of automated systems versus manual methods, consumables pull-through per instrument placement, and observed pricing ranges for panels, disks, gradients, and MIC-related formats. Where direct volume data is sparse in a country, proxy indicators such as hospital bed capacity growth, lab network expansion, and diagnostic spend direction are used, and interview feedback is then applied so implied utilization remains realistic.
For forecasting, scenario analysis is used to reflect different adoption paths for rapid and automated AST, supported by expert views on how guidelines, stewardship programs, and lab staffing constraints affect uptake. Growth rates are stress-tested against the expected pace of instrument replacement cycles and the recurring nature of consumables demand, which helps keep the forecast consistent year to year.
Data Validation & Update Cycle
Validation is done by triangulating outputs across multiple angles, including demand pool math, implied per-lab spend, and region-level growth signals from public surveillance and healthcare capacity data. If an output shows a sharp jump that does not align with known adoption cycles or policy shifts, the assumption is revisited and a follow-up check is triggered with a relevant respondent type.
Before sign-off, the model goes through multi-step analyst reviews that include variance checks by region and cross-checks across related diagnostics spend trends. Reports are refreshed annually, and interim updates are made when material events occur, such as major regulatory actions, large pricing resets, or notable technology shifts. Right before delivery, we run a final pass to ensure the latest public indicators and recent market movements are reflected.
Mordor Intelligence's Antimicrobial Susceptibility Testing Market Size Compared Against Other Published Estimates
Published market sizes for antimicrobial susceptibility testing often do not match, even when the growth story sounds similar, because firms are not counting the same set of revenues and are also not aligning on the same base year. Differences also come from how pricing is handled for consumables versus instruments, and how quickly adoption of automated and rapid methods is assumed to spread across routine labs.
One common reason is that some sources fold adjacent diagnostic revenues into the total, such as broader microbiology testing bundles or discovery and surveillance work that is not always tied to routine clinical AST purchasing. The study from Mordor Intelligence keeps the count focused on manual kits, automated instruments, reagents, software, and related services used specifically to generate susceptibility results, and it also excludes over-the-counter rapid self-testing products meant for home use. Other gaps are created by currency timing and the use of optimistic price progression for panels and cartridges without enough channel checks, which can lift the starting value even if the end market trend is similar.
Benchmark comparison
| Source | Market Size | Gaps in Research Methodology |
|---|---|---|
| Mordor Intelligence | USD 4.97 B (2026) | |
| Global Consultancy A | USD 5.67 B (2024) | Uses an earlier base year and can include broader application buckets such as discovery and epidemiology or surveillance, which may pull in spending not directly tied to routine AST lab purchasing. The higher figure can also reflect different inflation and currency timing assumptions for consumables-heavy workflows. |
| Industry Publisher B | USD 3.90 B (2024) | Runs on a different forecast window and may apply narrower pricing and product-mix assumptions that undercount automation-linked pull-through of consumables. Some models also rely on generalized diagnostic spend ratios, which can compress the value when AST intensity is rising faster than overall testing. |
The spread across sources is mainly explained by base-year choice and what gets counted as AST-related revenue, and then amplified by how consumables pricing and automation adoption are modeled. By keeping the inputs tied to test activity, product mix, and realistic utilization checks, we are able to present a market value that can be followed back to clear steps and adjusted when new evidence appears.


Key Questions Answered in the Report
How big is the antimicrobial susceptibility testing market in 2026?
The antimicrobial susceptibility testing market size is USD 4.97 billion in 2026.
What is the projected CAGR for antimicrobial susceptibility testing through 2031?
The market is forecast to expand at a 5.74% CAGR from 2026 to 2031.
Which region is expected to grow fastest?
Asia-Pacific is projected to post the quickest growth, advancing at a 6.43% CAGR through 2031.
Which product segment shows the highest growth?
Automated instruments are expected to expand at a 7.54% CAGR as laboratories seek faster turnaround and data integration.
Why are hospitals investing in rapid AST?
Rapid phenotypic AST shortens time-to-appropriate therapy in sepsis, which reduces mortality and hospital length of stay, generating cost savings.
What is the main restraint on market adoption?
High upfront instrument costs paired with reimbursement rates below USD 25 per test limit uptake, especially in community and low-resource settings.
Page last updated on:





