
Analog And Mixed Signal IP Market Size and Share
Market Overview
| Study Period | 2020 - 2031 |
|---|---|
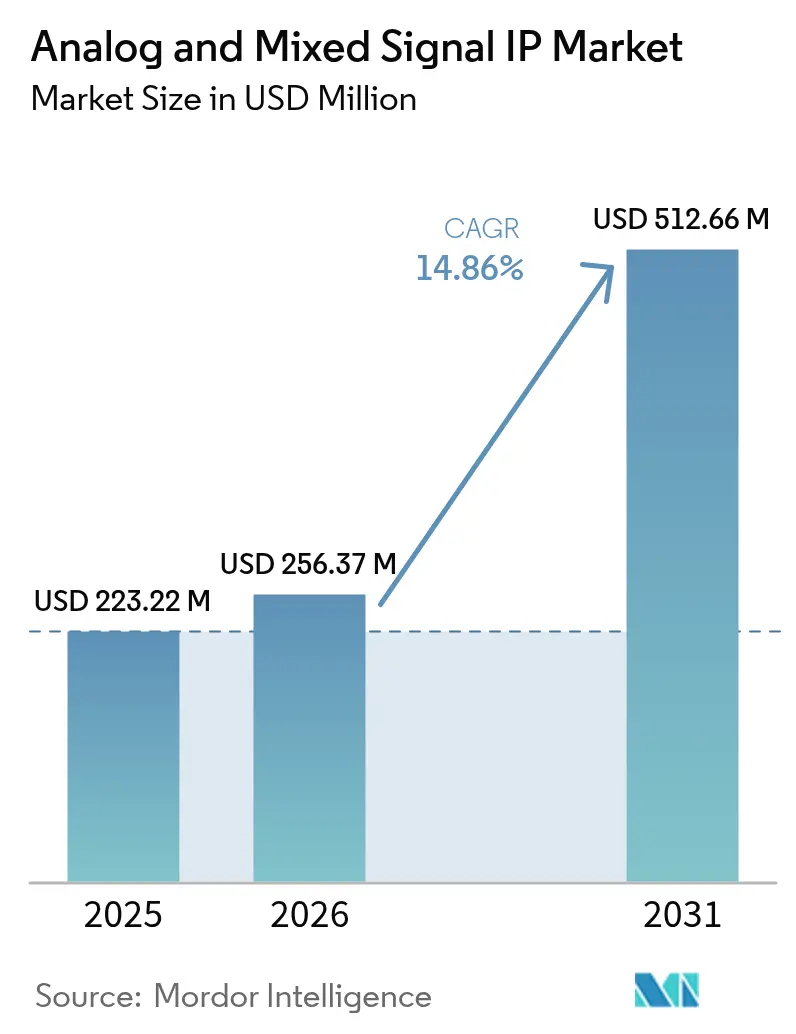
| Market Size (2026) | USD 256.37 Million |
| Market Size (2031) | USD 512.66 Million |
| Growth Rate (2026 - 2031) | 14.86 % |
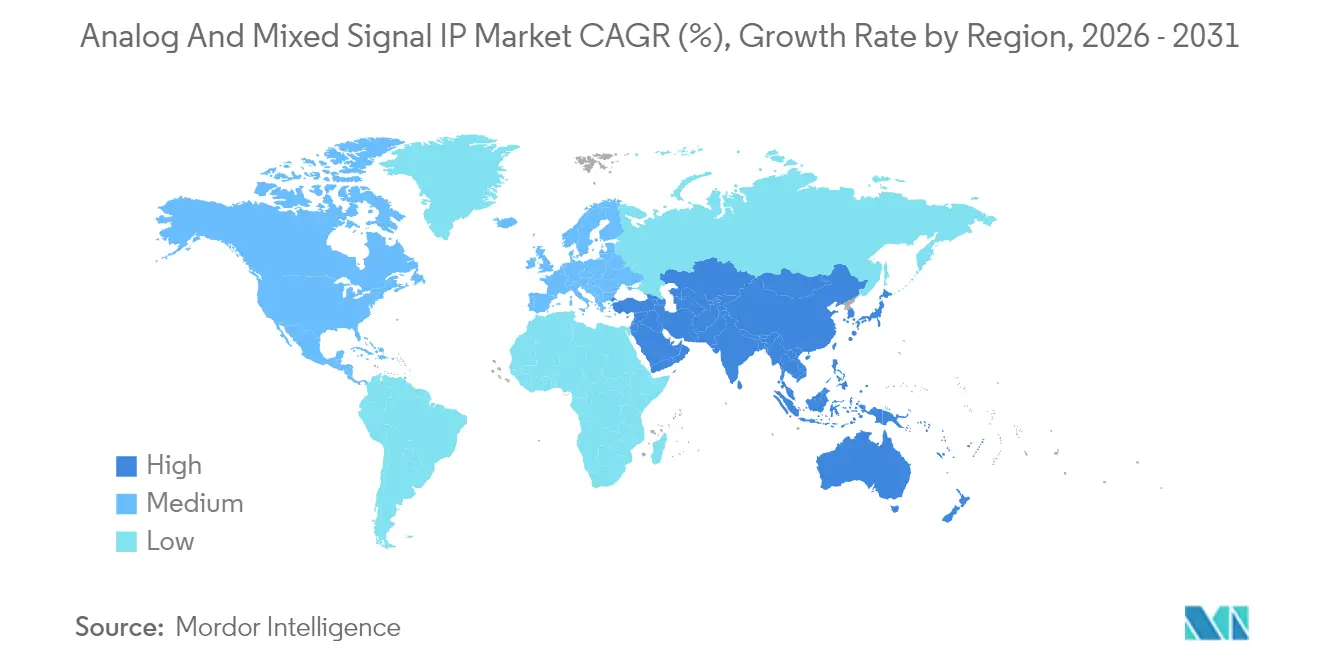
| Fastest Growing Market | Asia Pacific |
| Largest Market | North America |
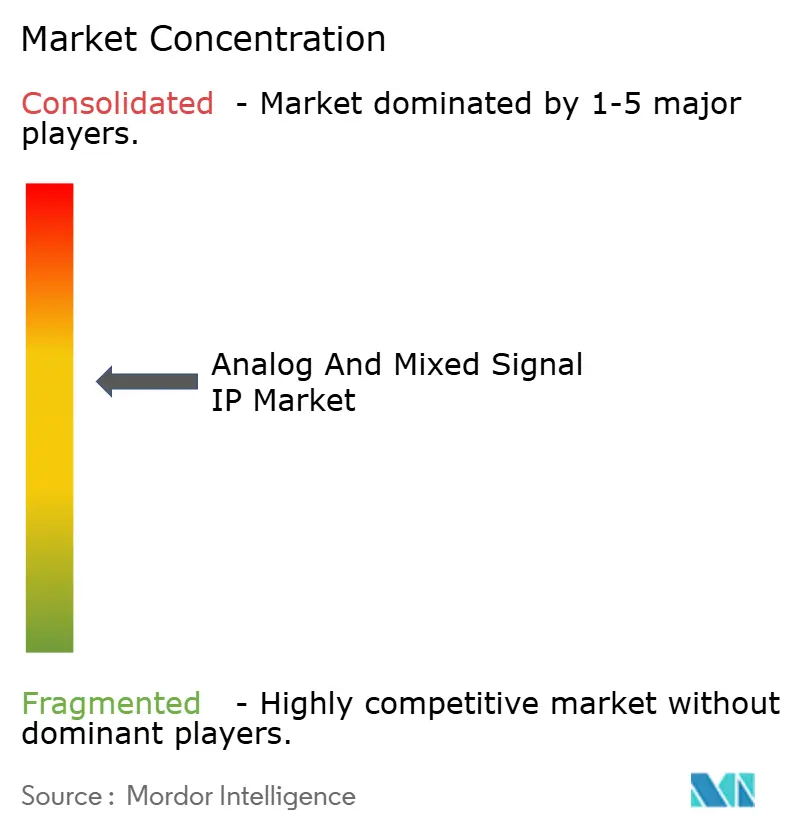
| Market Concentration | Medium |
Major Players *Disclaimer: Major Players sorted in no particular order Image © Mordor Intelligence. Reuse requires attribution under CC BY 4.0. | |
Analog And Mixed Signal IP Market Analysis by Mordor Intelligence
The analog and mixed signal IP market size was valued at USD 223.22 million in 2025 and estimated to grow from USD 256.37 million in 2026 to reach USD 512.66 million by 2031, at a CAGR of 14.86% during the forecast period (2026-2031). The expansion is underpinned by the pivot toward heterogeneous-integration system-on-chips, where data converters, power regulators, and RF transceivers must coexist on advanced digital nodes. Automotive original-equipment manufacturers consolidating more than 100 control units into zonal domain controllers are catalysing fresh IP-licensing deals, while edge-AI inference processors call for ultra-low-power analog front ends that legacy devices cannot deliver. In parallel, export-control rules on electronic-design-automation tools imposed on China in October 2024 have fragmented global supply chains, prompting local fabless firms to source domestic IP blocks to avoid project delays. Asia-Pacific remains the demand nucleus as state-backed fabs in China and joint ventures between Japanese firms and Taiwan Semiconductor Manufacturing Company secure advanced-node capacity. Fast-rising licensing activity for millimeter-wave RF front ends in smartphones and 5G base stations further lifts the analog and mixed signal IP market growth trajectory.
Key Report Takeaways
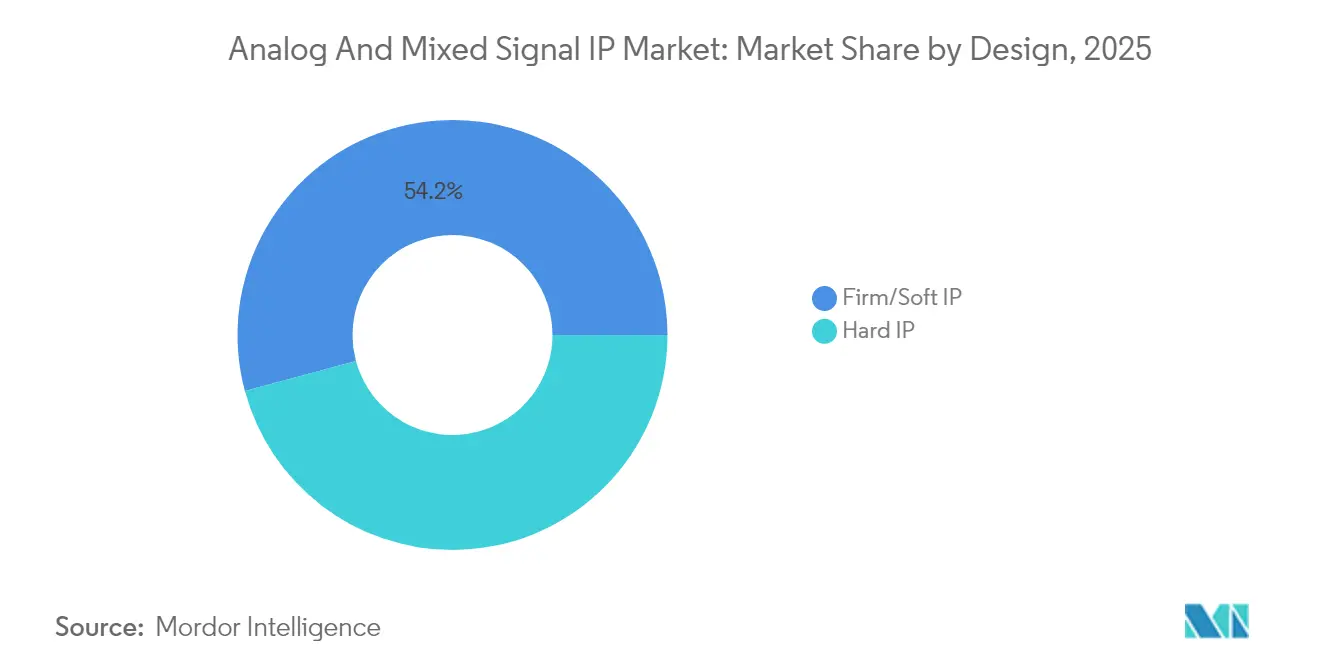
- By design format, firm and soft IP accounted for 54.19% of the analog and mixed signal IP market share in 2025, while hard IP is advancing at a 16.78% CAGR through 2031.
- By product type, power-management modules led with 36.25% revenue share in 2025; RF IP is forecast to expand at a 16.26% CAGR to 2031.
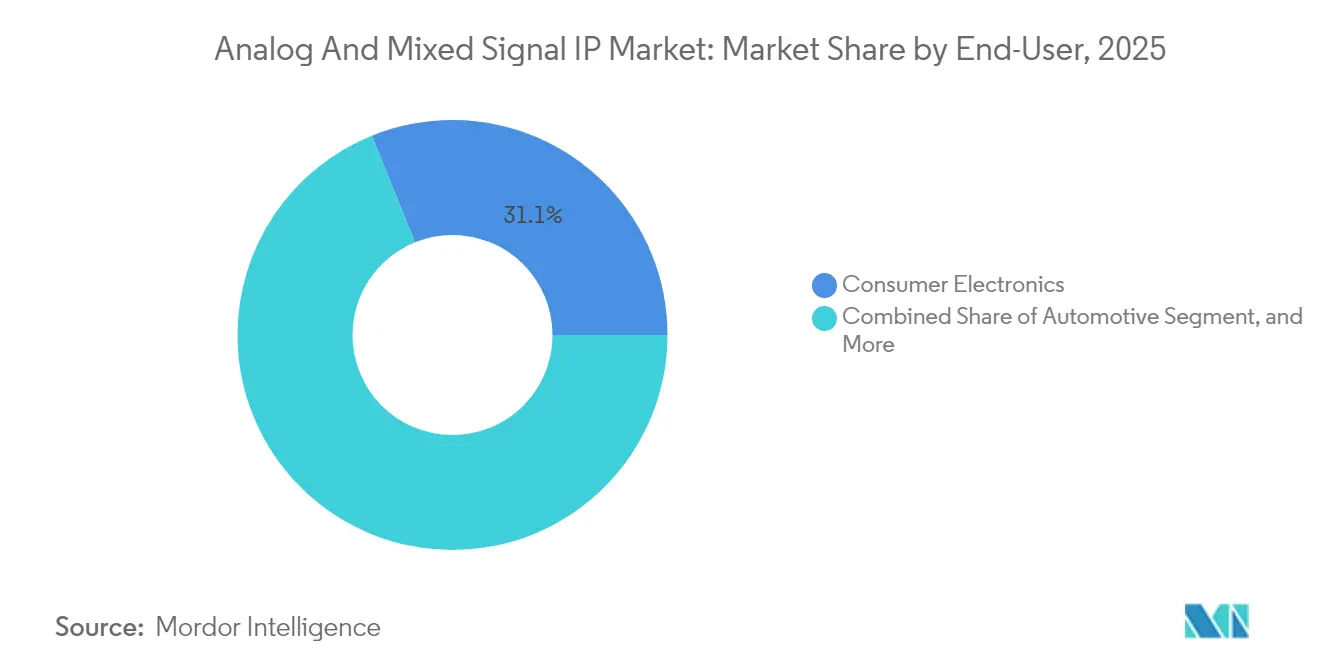
- By end-user industry, consumer electronics held 31.12% share of the analog and mixed signal IP market size in 2025 and automotive is progressing at a 15.52% CAGR through 2031.
- By process node, 20-nanometer to 45-nanometer technologies captured 42.05% share in 2025, whereas 7-nanometer and below nodes are growing at a 15.82% CAGR to 2031.
- By geography, Asia-Pacific commanded 40.65% share in 2025 and is projected to sustain a 15.65% CAGR through 2031.
Note: Market size and forecast figures in this report are generated using Mordor Intelligence’s proprietary estimation framework, updated with the latest available data and insights as of 2026.
Global Analog And Mixed Signal IP Market Trends and Insights
Drivers Impact Analysis*
| Driver | (~) % Impact on CAGR Forecast | Geographic Relevance | Impact Timeline |
|---|---|---|---|
| Growing Demand for Low-Power Connected Devices | +2.80% | Global, with concentration in Asia-Pacific | Medium term (2-4 years) |
| Rapid Proliferation of Edge AI Inference Workloads | +3.10% | North America and Asia-Pacific | Short term (≤ 2 years) |
| Expansion of 5G-Enabled RF Front-Ends in Smartphones | +2.50% | Global, led by Asia-Pacific and North America | Short term (≤ 2 years) |
| Automotive OEM Pivot to Zonal Architectures | +2.90% | Europe, North America, and China | Medium term (2-4 years) |
| Adoption of Chiplet-Based Heterogeneous Integration | +2.20% | North America, Asia-Pacific | Long term (≥ 4 years) |
| Heightened Focus on Security-Centric Analog IP (PUF) | +1.80% | Global, with early adoption in North America | Medium term (2-4 years) |
| Source: Mordor Intelligence | |||


Growing Demand for Low-Power Connected Devices
Internet-of-Things endpoints and wearable sensors need analog front ends operating below 1 milliwatt so their batteries last a decade, a target that discrete components struggle to meet. Gallium-nitride and silicon-carbide IP now deliver sub-100-nanoampere quiescent currents, enabling coin-cell-free industrial monitoring nodes.[1]IEEE Xplore, “Low-Power Design Techniques,” ieeexplore.ieee.org The European Ecodesign for Sustainable Products Regulation mandates energy-efficiency labels, accelerating uptake of ultra-low-power analog IP across consumer and industrial products.[2]European Commission, “Ecodesign for Sustainable Products Regulation,” ec.europa.eu Smartphone designers are licensing power-gating IP that shuts down idle analog paths, trimming standby drain by 40-60%.[3]Synopsys, “Analog Verification Challenges,” synopsys.com Demand is most intense in Asia-Pacific, where cost-sensitive wearables makers prize battery life over raw throughput. Consequently, the analog and mixed signal IP market increasingly positions ultra-low-leakage libraries as a default option for edge devices.
Rapid Proliferation of Edge AI Inference Workloads
Machine-learning inference at the network edge requires analog-to-digital converters sampling above 1 giga sample per second while sustaining more than 70 decibels of signal-to-noise ratio for real-time classification. Automotive radar systems rely on precision delta-sigma converters qualified to AEC-Q100 standards, driving fresh IP contracts for automotive-grade blocks. Hyperscale cloud providers deploying inference accelerators at cell towers embed analog front ends directly onto 5-nanometer ASICs to cut latency, compressing the standalone analog-chip supply chain. Smart cameras and industrial vision systems are pushing successive-approximation ADCs toward 16-bit resolution at 10 mega samples per second, a specification reliably met only by hard IP optimized for FinFET nodes. These needs shorten design cycles, reinforcing the analog and mixed signal IP market momentum among North American edge-AI startups.
Expansion of 5G-Enabled RF Front ends in Smartphones
Millimeter-wave 5G bands between 24 and 40 gigahertz require RF modules integrating low-noise amplifiers, power amplifiers, and antenna-tuning circuits that no discrete legacy chain can host within a handset footprint. Qualcomm’s Snapdragon X80 modem integrates 14 RF signal paths on one die, necessitating licensed impedance-matching and envelope-tracking IP. Beamforming antennas in 5G base stations depend on phase-locked-loop IP delivering sub-picosecond jitter to coordinate 64-element arrays. Chinese and South Korean handset makers license dual-mode RF transceiver IP to enable seamless sub-6-gigahertz and millimeter-wave handoffs. International Telecommunication Union specifications call for 20-gigabit-per-second peak rates, prompting vendors to deliver wideband analog front ends with 400-megahertz instantaneous bandwidth. As a result, the analog and mixed signal IP market registers a surge in millimeter-wave RF engagements.
Automotive OEM Pivot to Zonal Architectures
Traditional vehicles deploy 100-plus electronic control units, each hosting isolated analog interfaces. Zonal architectures consolidate them into 5-10 controllers positioned by vehicle zone, cutting harness weight by up to 40%. Tesla’s Hardware 4 platform integrates radar, lidar, and camera links into one zonal controller using licensed analog IP for sensor fusion and power sequencing. ISO 26262 safety norms require redundant voltage references and fault-detection circuits, raising analog IP complexity and licensing value. European OEMs are co-developing zonal IP that supports 48-volt nets and gigabit automotive Ethernet backbones. The shift to zonal systems materially lifts the analog and mixed signal IP market because each domain controller demands precision power management, ADCs, and interface blocks qualified to stringent automotive standards.
Restraints Impact Analysis*
| Restraint | (~) % Impact on CAGR Forecast | Geographic Relevance | Impact Timeline |
|---|---|---|---|
| Verification Bottlenecks for AMS Co-Simulation | -1.50% | Global, acute in North America and Europe | Short term (≤ 2 years) |
| Scarcity of Analog Design Talent in Sub-10 nm Nodes | -1.20% | Global, severe in Asia-Pacific | Long term (≥ 4 years) |
| Licensing Complexity in Multi-Die Systems | -0.90% | North America, Asia-Pacific | Medium term (2-4 years) |
| Geopolitical Export Controls on EDA/IP to China | -1.10% | China, spillover to Asia-Pacific | Medium term (2-4 years) |
| Source: Mordor Intelligence | |||
Verification Bottlenecks for AMS Co-Simulation
Analog blocks need continuous-time simulation engines that cannot benefit from the discrete-event acceleration used for digital logic, stretching verification cycles by three-to-five times. First-time silicon success at 7-nanometer nodes fell to 62% in 2024 because parasitic capacitance and substrate coupling undermine traditional SPICE models. Cadence introduced machine-learning-assisted parasitic extraction, yet uptake remains limited to tier-one firms able to fund specialized teams. Co-simulating power-management IP with digital cores can consume up to 50,000 CPU-hours per iteration, pushing tape-out by as much as 12 months. Smaller fabless houses over-design margins, compromising power efficiency to secure first-pass yields, which tempers near-term analog and mixed signal IP market growth.
Scarcity of Analog Design Talent in Sub-10 nm Nodes
North American universities graduate fewer than 500 analog designers per year, while industry demand exceeds 3,000 specialists, creating a structural shortfall. FinFET and gate-all-around architectures introduce threshold-voltage variability that requires hand-tuning skills gained only after years of practice. Median salaries for senior analog engineers reached USD 220,000 in 2024, 35% above digital roles, yet retention hovers below 60% as cloud providers and automotive OEMs bid aggressively. China faces an even sharper deficit, with fewer than 200 engineers able to design at 7-nanometer nodes, forcing domestic firms to license foreign IP. The shortage slows new-IP creation, constraining the analog and mixed signal IP market pipeline over the long term.
*Our forecasts treat driver/restraint impacts as directional, not additive. The impact forecasts reflect baseline growth, mix effects, and variable interactions.
Segment Analysis
By Design: Hard IP Gains as Chiplet Standards Mature
Hard IP captured a minority share in 2024, yet it is projected to grow at 16.78% CAGR through 2031 as chiplet-based architectures mature. Intel’s Meteor Lake processor demonstrated that pre-characterized voltage-regulator and clock-distribution hard IP can trim power by 20% relative to soft equivalents. Universal Chiplet Interconnect Express, ratified in 2024, formalizes die-to-die analog signalling, allowing vendors to ship plug-and-play tiles that guarantee performance across process nodes. The analog and mixed signal IP market increasingly sees premium fees USD 500,000 to USD 2 million up front plus 1-3% royalties for these hardened blocks, a price acceptable to high-volume smartphone and automotive suppliers.
Firm and soft IP, which held 54.19% of analog and mixed signal IP market share in 2025, remains vital in cost-sensitive consumer and Internet-of-Things devices where portability across foundries is paramount. Soft IP delivered as register-transfer-level code allows tailoring of analog topologies but forces extensive re-verification, stretching time-to-market by up to nine months. Foundries now pre-qualify hard IP for 3-nanometer gate-all-around processes, helping customers de-risk advanced-node projects. As chiplet ecosystems widen, the analog and mixed signal IP market size for hard IP is set to leap, though soft IP will persist in legacy nodes because its flexibility outweighs performance trade-offs.


By Product: RF IP Accelerates on Millimeter-Wave Demand
Power-management modules captured 36.25% revenue in 2025, underscoring their ubiquity across every semiconductor category from wearables to electric vehicles. Voltage-regulator IP capable of 0.5-volt to 48-volt operation while sustaining more than 90% efficiency is indispensable in zonal controllers and high-bandwidth-memory stacks. Yet RF IP is forecast to grow at a 16.26% CAGR on the back of millimeter-wave 5G rollouts and low-Earth-orbit satellite terminals. The analog and mixed signal IP market size for RF blocks serving 24-plus-gigahertz applications is swelling as handset makers need low-noise amplifiers with noise figures below 3 decibels and power amplifiers delivering 25 decibel-milliwatts.
High-speed SerDes and clock-data-recovery IP at 112-gigabit-per-second rates now reach 2-meter copper traces without retimers, saving USD 50-100 per port in data-center switches. Converter IP remains essential in industrial automation and medical imaging, while temperature sensors and oscillators address niche aerospace needs. The analog and mixed signal IP market strategically balances mature power-management products with high-growth RF opportunities, ensuring that vendors maintain diversified portfolios across power, RF, and data-conversion lines.
By End-User Industry: Automotive Electrification Drives Fastest Growth
Consumer electronics maintained 31.12% of total 2025 demand on sheer smartphone and wearable volumes. Apple’s A18 processor integrates 12 power domains managed by licensed analog IP that optimizes voltage and frequency, extending battery life 18% over its predecessor. Nevertheless, automotive applications are expanding at the fastest 15.52% CAGR as electric-vehicle battery-management systems monitor up to 200 cells with 16-bit ADCs exhibiting sub-1 least-significant-bit non-linearity.
ISO 26262 imposes systematic-fault coverage above 99%, driving demand for analog IP featuring built-in self-test circuits that add 20-30% die area. Volkswagen’s software-defined vehicle plan consolidates infotainment, telematics, and body-control functions onto three zonal processors with licensed analog CAN-FD and Ethernet IP. Telecommunications infrastructure, industrial automation, aerospace, and medical devices round out the customer base, but the analog and mixed signal IP market finds its most lucrative design-wins in vehicles where safety certification premiums command higher royalty rates.
By Process Node: Sub-7 nm Nodes Capture Premium Applications
Nodes at 20-45 nanometers held 42.05% share in 2025, powering industrial microcontrollers and cost-sensitive consumer gadgets. These technologies balance analog performance with wafer prices below USD 5,000 per 300-millimeter wafer. Yet 7-nanometer and below nodes are growing at a 15.82% CAGR, fuelled by hyperscale AI accelerators and flagship smartphones integrating analog blocks on cutting-edge silicon.
Samsung’s 3-nanometer gate-all-around process requires IP vendors to redesign voltage references for 20% higher transistor mismatch. Gate-all-around devices reduce short-channel effects but add parasites, compelling the analog and mixed signal IP industry to re-tool its libraries. Legacy 90-nanometer and 130-nanometer nodes face retirement, forcing customers to migrate to 65-nanometer platforms or risk end-of-life, a shift that creates trailing-edge opportunities for value-priced IP. Consequently, the analog and mixed signal IP market size expands at both ends premium royalties on advanced nodes and volume stability at mid-range geometries.
Geography Analysis
Asia-Pacific led with 40.65% analog and mixed signal IP market share in 2025 and is forecast to grow at 15.65% CAGR through 2031. China’s National Integrated Circuit Fund directed USD 47 billion into domestic analog IP programs in 2024 to reach self-sufficiency amid U.S. export controls. Japan’s foundry alliances with Taiwan Semiconductor Manufacturing Company secure capacity for 2-nanometer prototypes, supporting local automotive and industrial clients. South Korea licenses high-bandwidth-memory and chiplet interconnect IP for AI servers, while India’s 25,000-strong analog-engineering workforce handles outsourced IP development contracts from North America and Europe, lowering design costs for global customers.
North America held 28.12% share in 2025, driven by hyperscale data-center operators and vehicle OEMs. The CHIPS and Science Act earmarked USD 11 billion for advanced packaging and chiplets, stimulating local demand for die-to-die analog IP. Intel’s USD 20 billion Arizona expansion includes analog qualification labs, inviting third-party IP partners to validate on the 18A node. Canadian supplier Magna integrates certified analog IP into zonal controllers, while Mexico’s Guadalajara cluster emerges as a near-shore design hub for automotive and industrial segments.
Europe commanded about 22.28% share, with Germany, France, and Italy at the forefront. The European Chips Act commits EUR 43 billion (USD 47 billion) toward doubling regional semiconductor share by 2030 and prioritizes analog and power-management IP for electric-vehicle and renewable-energy systems. Infineon partnered with Cadence and ARM to enrich its automotive-grade IP, and STMicroelectronics co-develops gallium-nitride power IP targeting 95% charger efficiency. The United Kingdom’s Alphawave IP raised GBP 450 million (USD 575 million) to scale its SerDes and chiplet portfolios, strengthening Europe’s role in high-speed connectivity. South America, the Middle East and Africa collectively contribute under 9%, though Brazil’s electric-vehicle programs and Saudi Arabia’s smart-city projects produce niche opportunities.

Regulatory Landscape
Regulation affecting analog and mixed-signal IP commercialization is increasingly shaped by semiconductor trade controls and public-sector procurement rules, which influence the EDA flows, foundry PDKs, and third-party IP that can be used in cross-border programs. In the United States, a Section 232 presidential proclamation (January 2026) introduced a 25% ad valorem tariff on specified semiconductor articles effective January 15, 2026, while the Bureau of Industry and Security revised license review policy for exports tied to advanced computing commodities (January 2026). These measures raise compliance screening and documentation burdens for design houses and IP licensors serving global customers, particularly where China or Macau touchpoints exist.
In Europe, semiconductor policy is being organized around resilience and supply-chain coordination under the Chips Act framework, with a policy roadmap in 2026 elevating a Chips Act 2.0 initiative within a broader tech sovereignty package. For analog and mixed-signal IP vendors, these policy moves support the need for regionally qualified IP catalogs, traceable development flows, and tighter alignment with foundry ecosystems that can demonstrate compliant design enablement, especially for automotive and critical-infrastructure end markets where functional safety and quality expectations also apply (for example, AEC-Q100 and ISO 26262-aligned design requirements).
Competitive Landscape
The analog and mixed signal IP market exhibits moderate concentration, with Cadence Design Systems, Synopsys, and ARM collectively holding around 45-50% of licensing revenues by virtue of end-to-end portfolios covering data converters, power management, RF, and interfaces. Niche specialists such as Silicon Creations, Alphawave IP, and Rambus differentiate through ultra-low-jitter phase-locked loops, 112-gigabit SerDes, and physically unclonable-function security cores, respectively.[4]Financial Times, “Semiconductor IP Market Dynamics,” ft.com Foundries, notably Taiwan Semiconductor Manufacturing Company and GlobalFoundries, vertically integrate by bundling process-optimized analog libraries, tightening competition for independent vendors.
Patent filings for analog IP climbed 22% in 2024, led by Synopsys and Cadence with machine-learning-assisted layout and automated parasitic-extraction innovations. Subscription-based licensing models are gaining traction, lowering upfront costs for startups but pressuring near-term vendor revenues. Verification remains a key battleground: vendors investing in co-simulation platforms that blend SPICE with digital event-driven engines slash customer verification timelines by up to 60%.
White-space remains in automotive-grade analog IP certified to ISO 26262 ASIL-D across a –40 to 150 degrees Celsius range. Fewer than 10 companies offer full portfolios here, giving specialists pricing power. Emerging disruptors such as SemiFive leverage open-source RISC-V ecosystems to bundle analog IP with cores, reducing licensing friction for Internet-of-Things chips. As chiplet adoption scales, partnerships between hard-IP vendors and advanced-packaging houses will shape the next wave of competition in the analog and mixed signal IP market.
Analog And Mixed Signal IP Industry Leaders
Cadence Design Systems Inc.
Silicon Creations
VeriSilicon Holdings Co. Ltd
Renesas Electronics Corporation
Synopsys Inc.
- *Disclaimer: Major Players sorted in no particular order

Market Opportunities and Future Outlook
Advanced-node power delivery and on-chip observability are creating near-term whitespace as leading-edge SoCs add more power domains, tighten voltage margins, and introduce heterogeneous blocks that require verified analog collateral on the foundry process. Analog Bits demonstration of real-time on-chip power sensing and delivery functions (including integrated LDOs, glitch catchers, and remote PVT sensors) optimized for TSMC N2P at the TSMC 2026 Technology Symposiums indicates that analog IP is moving beyond individual blocks toward system-level power integrity and telemetry. This direction can shorten bring-up cycles and reduce overdesign on sub-3 nm nodes, favoring IP portfolios that come with characterization data, migration support, and AMS verification assets aligned to foundry signoff.
Automotive zonal architectures and 48V electrification continue to expand the scope of mixed-signal content per vehicle controller, which creates opportunities for vendors that can package safety- and reliability-oriented IP with integration guidance. Elmos Semiconductor highlighted a roadmap centered on zonal E/E integration for eFuse-protected 48V systems and next-generation ultrasonic sensor architectures, and T2M disclosed an analog/mixed-signal IP licensing engagement with a Tier-1 Korean customer spanning high-speed ADCs and power management units. In parallel, consolidation in adjacent analog/mixed-signal portfolios, such as Analog Devices completing its acquisition of Empower Semiconductor to enhance AI compute power delivery and system-level power management, points to continued demand for differentiated power-management know-how that can be productized as reusable IP and reference subsystems across data-center and edge-AI designs.
Recent Industry Developments
- July 2026: Infineon Technologies completed the acquisition of ams OSRAMs non-optical analog/mixed-signal sensor portfolio for EUR 570 million. The deal strengthens Infineons mixed-signal sensing footprint in automotive and industrial segments, increasing competitive pressure on third-party analog IP and sensor interface providers to differentiate on integration, qualification, and time-to-design-win.
- June 2026: Cadence Design Systems unveiled a fully autonomous virtual engineer capability for chip design, extending agentic AI into custom and analog workflows. By compressing repetitive implementation and verification tasks, the update supports faster integration cycles for analog and mixed-signal IP, especially when customers must re-characterize blocks across multiple advanced nodes and packaging contexts.
- September 2025: Analog Bits announced new power and energy management IP validated on TSMCs N2P and N3P processes and demonstrated the portfolio at the TSMC 2025 OIP Ecosystem Forum. Foundry-validated power-management IP at these nodes helps de-risk leading-edge SoC programs, supporting earlier commitment to licensed analog blocks as designs adopt more power domains and tighter margins.


Research Methodology Framework and Report Scope
Market Definition and Coverage
This market covers revenues generated from licensing and supplying analog and mixed-signal semiconductor IP blocks that are integrated into chip designs, where the value is counted at the IP level rather than finished silicon sales.
Scope exclusions: We exclude packaged analog IC component sales, wafer foundry revenue, EDA tool subscriptions, and design services that are not priced as IP.
Segmentation Overview
- By Design
- Firm/Soft IP
- Hard IP
- By Product
- A2D and D2A Converters
- Power Management Modules
- RF
- Other Products
- By End-User Industry
- Consumer Electronics
- Telecommunication
- Automotive
- Industrial
- Other End-User Industries
- By Process Node
- 7 nm and Below
- 8 nm - 16 nm
- 20 nm - 45 nm
- 65 nm and Above
- By Geography
- North America
- United States
- Canada
- Mexico
- South America
- Brazil
- Argentina
- Rest of South America
- Europe
- Germany
- United Kingdom
- France
- Italy
- Russia
- Rest of Europe
- Asia Pacific
- China
- Japan
- South Korea
- India
- Rest of Asia Pacific
- Middle East
- Saudi Arabia
- United Arab Emirates
- Turkey
- Rest of Middle East
- Africa
- South Africa
- Nigeria
- Rest of Africa
- North America
Data Sources, Market Sizing, and Validation
Desk Research
For desk work, we first aligned the market boundaries with how analog and mixed-signal IP is described in public technical and trade materials, and then we used these sources to shape assumptions that we later checked through interviews. Helpful anchors included public patent databases, standards and technical references from bodies such as IEEE, national trade and industry releases such as US Bureau of Economic Analysis releases for digital economy indicators, and semiconductor industry publications such as World Semiconductor Trade Statistics for end-market cycle context.
Next, we mapped demand signals that influence IP adoption and pricing using company filings and investor presentations, reputable press coverage, and selected university and peer-reviewed journal papers on mixed-signal design trends, including ADC and DAC integration, PMIC integration, and RF front-end needs. In a few cases, paid databases already available internally were used for company financials and internal intelligence, plus patent tracking, mainly to standardize how we tag IP-centric revenue lines and to cross-check timing across programs. These sources were illustrative, and we also relied on other public references for data collection, validation, and clarification.
Primary Interviews and Surveys
Primary work focused on expert interviews and structured surveys with IP suppliers, chip design teams, and ecosystem specialists who track process-node transitions and IP reuse in new SoC programs. The conversations were used to confirm what is actually priced as firm or hard IP, how categories such as data converters, power management modules, and RF blocks are typically contracted, and which end-use industries are pulling demand across major regions.
Distribution of primary research fieldwork respondents
| Company type | Respondent position | Region |
|---|---|---|
| Top tier: 29% | CXOs: 20% | APAC: 42% |
| Mid tier: 51% | Functional/Unit leaders: 39% | EMEA: 32% |
| Smaller Players: 20% | Managers: 41% | Americas: 26% |
Market-Sizing & Forecasting
Sizing was built mainly through a top-down model where design activity and adoption rates were used to reconstruct the addressable IP spending pool, then reconciled against observed commercialization patterns. We started with the split between firm or soft IP and hard IP, the mix across product families such as ADC and DAC converters, power management modules, and RF IP, and the process-node mix (7 nm and below, 8 to 16 nm, 20 to 45 nm, and 65 nm and above), because reuse behavior and pricing assumptions shift with node and qualification needs.
To keep the totals realistic, we ran selective bottom-up checks using sampled ASP assumptions multiplied by expected design starts and reuse counts in key end-use industries such as consumer electronics, telecom, automotive, and industrial. Where direct datapoints were limited, gaps were handled by applying node-level and industry-level proxy ratios that were validated using interview feedback, and then stress-tested so no single assumption could dominate the final number.
For forecasting, scenario analysis was used around a base case, since the market is sensitive to semiconductor cycle timing and process-node transition speed. Inputs that were tracked included new SoC tape-out intensity, automotive and industrial qualification timelines, export-control related supply-chain shifts, and the pace of heterogeneous integration. We adjusted these drivers using what practitioners expect for licensing terms and renewal cycles.
Data Validation & Update Cycle
Validation was done by triangulating model outputs against independent indicators that signal design activity and monetization, and by checking that regional and node-level results move in believable directions. When a number looked out of line, we revisited the driver behind it, checked the underlying math, and then re-ran sensitivity ranges before finalizing the estimate.
We followed a multi-step internal review where assumptions, inputs, and calculations were re-checked by another analyst before sign-off. The report is refreshed annually, and interim updates are triggered when a material event changes licensing behavior or end-market demand. Before delivery, we run a final pass to provide an updated view rather than relying on an older snapshot.
Mordor Intelligence's Analog and Mixed Signal Ip Market Size Measured Against Other Published Estimates
Published market sizes for analog and mixed-signal IP do not always match, because the market can be counted at different points in the value chain and because forecast windows and base years vary. The spread is usually explained by what each publisher includes as IP revenue, which product families are counted, and how process-node shifts are handled.
The main gap comes from whether adjacent revenue streams are folded into the total. In Mordor Intelligence, we count monetized analog and mixed-signal IP blocks and keep them separate from foundry revenue, packaged IC sales, and tool-related spending that can inflate totals. Differences also show up when one estimate assumes faster pricing expansion for leading-node hard IP, or when currency timing and refresh cadence are not aligned to the same market cycle, which can move small markets by a noticeable amount.
Benchmark comparison
| Source | Market Size | Gaps in Research Methodology |
|---|---|---|
| Mordor Intelligence | USD 223.22 M (2025) | |
| Global Consultancy A | USD 197.82 M (2023) | Uses an earlier base year and a shorter forecast window, and its scope description suggests broader grouping by application that can blur what is priced as IP versus adjacent semiconductor ecosystem revenue. |
| Industry Publisher B | USD 240.49 M (2026) | Starts from a later year and a longer forecast horizon, and it appears to apply a faster growth path that may assume stronger penetration and pricing uplift across multiple circuit types without the same node-mix normalization. |
Looking across the three figures, most of the variation is explained by base-year choice and what each publisher counts as addressable IP revenue, especially around hard IP at advanced nodes. By keeping the scope tied to IP-level monetization signals and then cross-checking the node and end-use mix through interviews, the estimate stays traceable to inputs that can be reviewed and repeated.


Key Questions Answered in the Report
How large is the analog and mixed signal IP market in 2026?
The analog and mixed signal IP market size is USD 256.37 million in 2026 with a forecast to reach USD 512.66 million by 2031.
Which region leads demand for analog and mixed signal IP?
Asia-Pacific holds the largest share at 40.65% in 2025 and is projected to grow at 15.65% CAGR through 2031.
What product category is expanding fastest within analog and mixed signal IP portfolios?
RF IP is the fastest-growing product line, forecast to expand at a 16.26% CAGR from 2026 to 2031.
Why is hard IP adoption accelerating?
Chiplet-based designs need pre-characterized analog tiles, and Universal Chiplet Interconnect Express enables plug-and-play hard IP integration, driving a 16.78% CAGR for hard IP.
Which end-user sector shows the highest growth momentum?
Automotive applications, especially electric-vehicle battery-management and zonal controllers, are advancing at a 15.52% CAGR through 2031.
What is the key restraint affecting market growth?
Lengthy verification cycles for analog and mixed-signal co-simulation reduce first-time silicon success, adding up to 12 months to tape-out schedules.
Page last updated on:





