
Americas Microcontroller (MCU) Market Size and Share
Market Overview
| Study Period | 2020 - 2031 |
|---|---|
| Forecast Data Period | 2026 - 2031 |
| Base Year Market Size (2025) | USD 725.23 Million |
| Market Size (2026) | USD 739.52 Million |
| Market Size (2031) | USD 815.33 Million |
| Growth Rate (2026 - 2031) | 1.97 % |
| Market Concentration | Medium |
Major Players_Market.webp) *Disclaimer: Major Players sorted in no particular order Image © Mordor Intelligence. Reuse requires attribution under CC BY 4.0. | |
Americas Microcontroller (MCU) Market Analysis by Mordor Intelligence
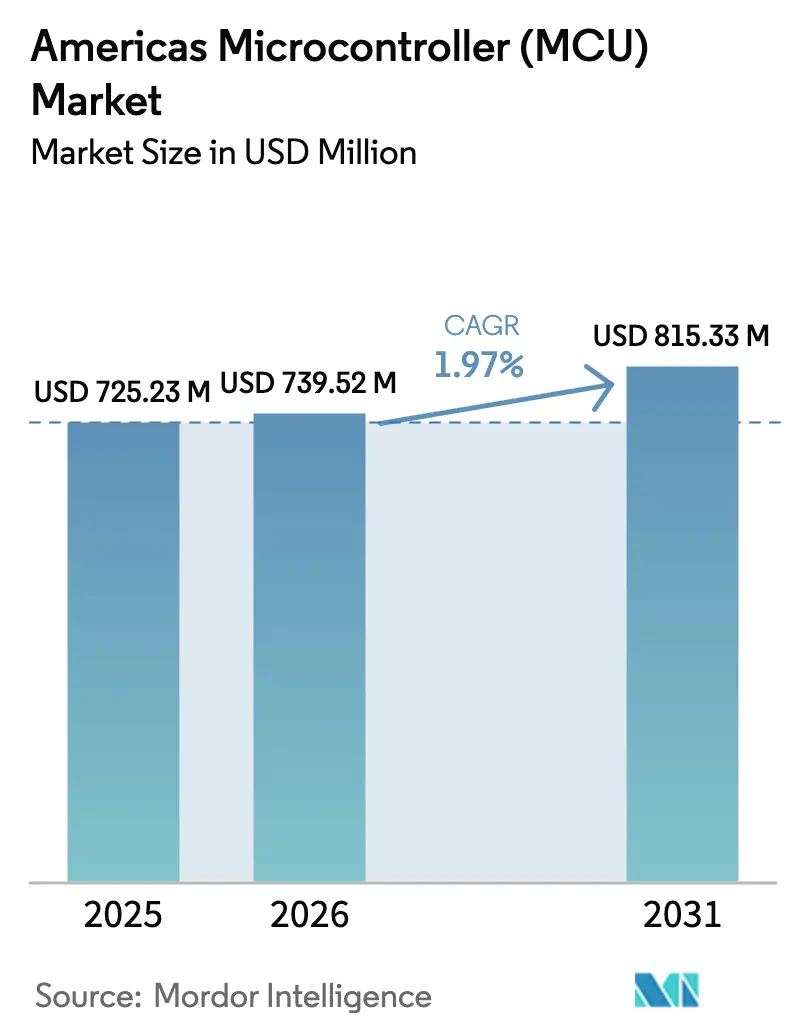
The Americas microcontroller market size is expected to grow from USD 725.23 million in 2025 to USD 739.52 million in 2026 and is forecast to reach USD 815.33 million by 2031 at 1.97% CAGR over 2026-2031. The measured growth reflects a transition from post-pandemic recovery to steady demand as automotive electrification mandates and IoT edge deployments multiply across factories, vehicles, smart homes, and wearables. Federal near-shoring incentives such as the USD 52 billion CHIPS and Science Act in the United States, alongside Brazil’s USD 186.6 billion Nova Indústria Brazil program, underpin fresh wafer-fab and design capacity that reduces exposure to Asian supply risk. Architecturally, the Americas microcontroller market is shifting toward higher-performance cores: 32-bit devices delivered 54.30% revenue in 2024, while 64-bit parts post the fastest 5.9% CAGR as software-defined vehicles and edge AI workloads require headroom. Demand from electric vehicles, FDA-cleared AI medical devices, and mandatory NIST IR 8425 cybersecurity standards reinforces unit volumes even as sub-28 nm capacity constraints linger.[1]National Institute of Standards and Technology, “NIST IR 8425: Recommended Criteria for Cyber-Security Labeling,” nist.gov
Key Report Takeaways
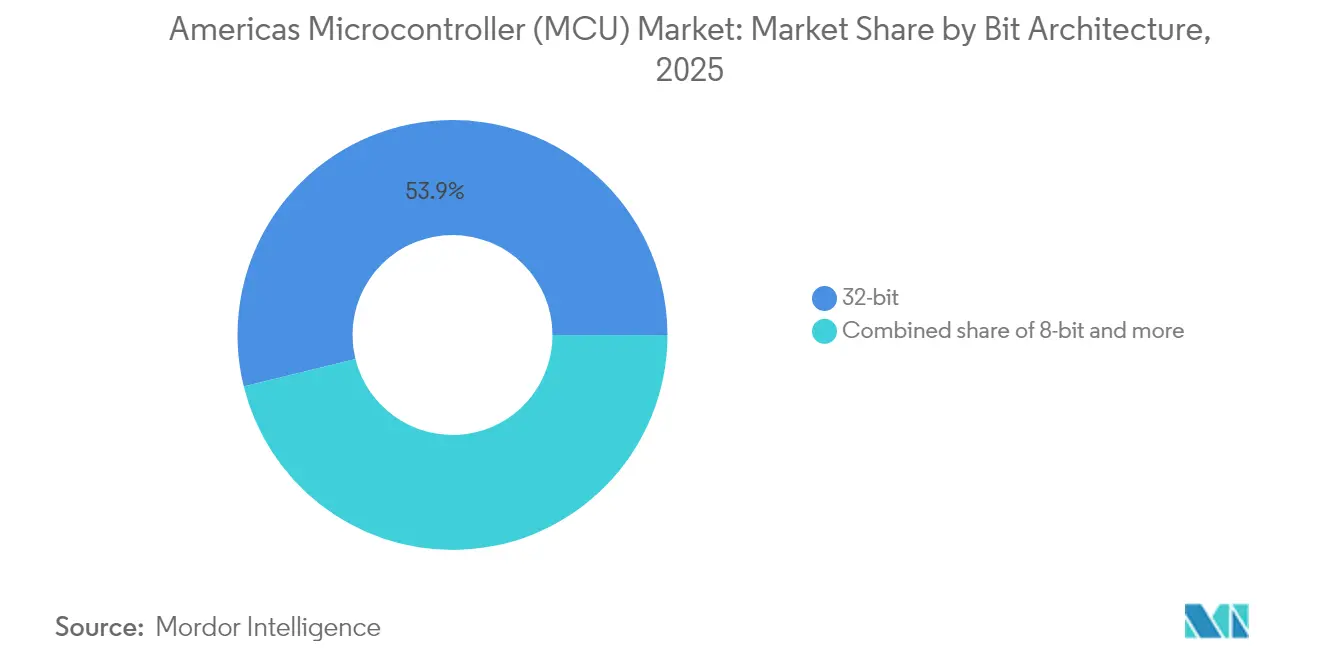
- By bit architecture, 32-bit devices led with 53.85% revenue share in 2025; 64-bit and above devices are projected to expand at a 5.54% CAGR through 2031.
- By end-user industry, the automotive sector held 29.25% of the Americas microcontroller market share in 2025, while healthcare and medical devices record the highest 5.78% CAGR to 2031.
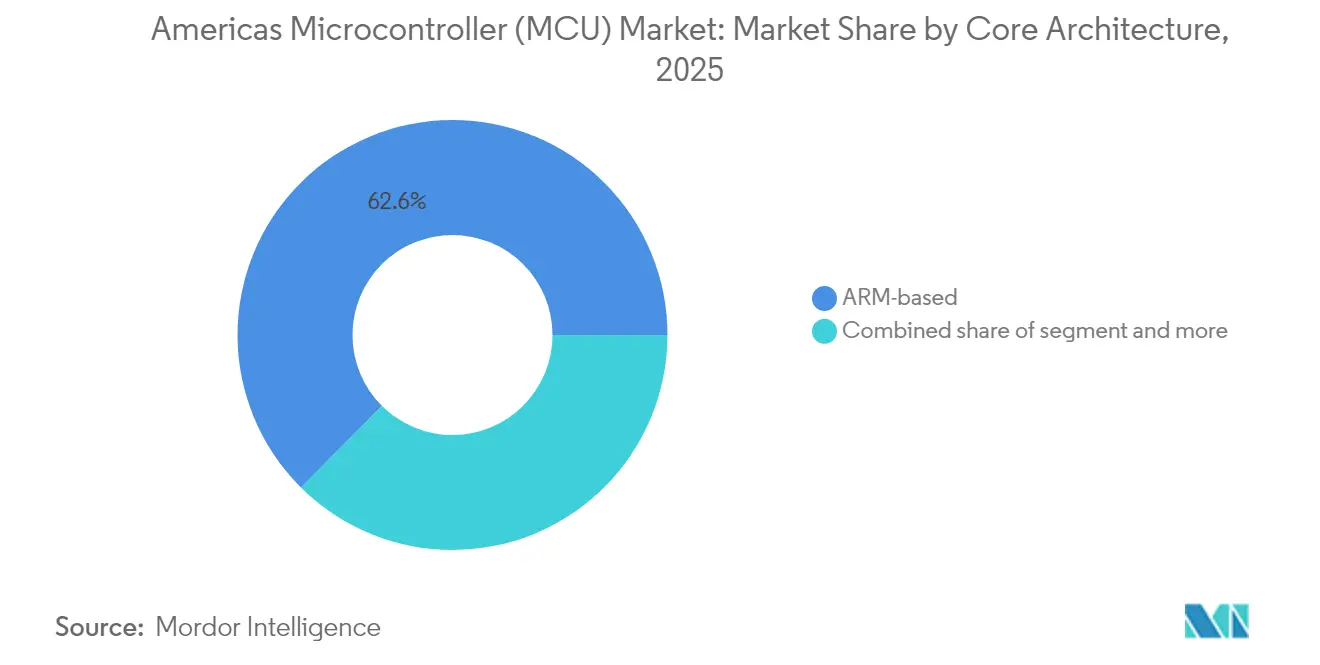
- By core architecture, ARM-based designs commanded 62.55% revenue in 2025; RISC-V designs post a 4.72% CAGR through 2031.
- By connectivity, non-wireless MCUs captured 71.10% of the Americas microcontroller market size in 2025, whereas wireless-enabled MCUs advance at a 6.44% CAGR to 2031.
- By geography, the United States accounted for 49.35% of 2025 revenue, while Brazil registers the fastest 6,720% CAGR through 2031.
Note: Market size and forecast figures in this report are generated using Mordor Intelligence’s proprietary estimation framework, updated with the latest available data and insights as of 2026.
Market Trends and Insights
Drivers Impact Analysis of Americas Microcontroller (MCU) Market*
| Driver | (~) % Impact on CAGR Forecast | Geographic Relevance | Impact Timeline |
|---|---|---|---|
| Automotive electrification push | 0.80% | North America and South America, with strongest impact in US and Brazil | Medium term (2-4 years) |
| Proliferation of IoT edge nodes | 0.60% | Global, with concentration in US industrial corridors and Brazilian smart cities | Short term (≤ 2 years) |
| Migration to 32-bit and ARM-based MCUs | 0.40% | Americas-wide, led by automotive and industrial applications | Medium term (2-4 years) |
| Government near-shoring incentives (CHIPS Act, Brazil PADIS) | 0.50% | US (25 states) and Brazil (Jalisco, São Paulo, Minas Gerais) | Long term (≥ 4 years) |
| Mandatory embedded-device cyber-security standards (U.S. NIST IR 8425) | 0.30% | US federal and state procurement, spillover to Canada and Mexico | Short term (≤ 2 years) |
| RISC-V cost disruption in entry-level SKUs | 0.20% | Americas-wide, strongest in cost-sensitive consumer and industrial segments | Medium term (2-4 years) |
| Source: Mordor Intelligence | |||
Automotive Electrification Push
Electric vehicles embed three to five times more semiconductors than internal-combustion cars, and every traction inverter, battery-management board, or body-domain controller consumes at least one performance MCU. NXP unveiled its 16 nm S32K5 family in March 2025 with embedded MRAM and an 800 MHz Arm Cortex core to consolidate legacy ECUs and host real-time AI inference. Renesas’ RH850/C1M-Ax MCU coordinates dual traction inverters in hybrids, cutting board count and wiring weight. New greenhouse-gas limits in Canada and stricter US EPA rules accelerate electrified powertrain adoption, keeping the Americas microcontroller market closely tied to automotive design cycles. Infineon’s first automotive RISC-V MCU under the AURIX brand, launched in March 2025, signals a cost-driven alternative that still meets ASIL-D safety targets.[2]NXP Semiconductors, “S32K5 Arm Cortex-M MCU Family,” nxp.com
Proliferation of IoT Edge Nodes
Industrial and consumer devices are gaining local intelligence that shrinks latency and lowers cloud fees. IEEE data show the intelligent industrial edge segment leaped from USD 11.6 billion in 2019 to USD 30.8 billion by 2025, with software now 41% of spend. Renesas forecasts USD 10 billion for wireless connectivity MCUs by 2030 as ultra-low-power cores run secure neural networks at the edge. Arduino’s Nano Matter board, built on Silicon Labs’ MGM240S, executes gesture recognition locally and speaks the interoperable Matter protocol, easing smart-home rollouts. NXP’s 2025 wireless outlook likewise highlights on-chip machine-learning accelerators that shift inference workloads away from data centers.
Migration to 32-bit and ARM-based MCUs
Demand for higher compute density and in-field upgrade capability is phasing out 8-bit and 16-bit controllers. STMicroelectronics’ Stellar MCUs adopt 18 nm FD-SOI and store secure OTA update images while keeping ASIL-D safety. Industry estimates place RISC-V penetration at 15% of global MCUs in 2024, reflecting interest in royalty-free cores. Microchip’s move to 64-bit RISC-V parts balances ongoing Arm support and underlines the diversification aim of tier-one suppliers.
Government Near-shoring Incentives
The USD 52 billion CHIPS Act has already triggered more than USD 540 billion in private semiconductor commitments, pushing new fabs into Arizona, Texas, New York, and Ohio. Brazil’s PADIS incentives within the Nova Indústria Brazil plan add BRL 7 billion yearly to back design houses and specialty foundry upgrades; the Kutsari Project created the first National Semiconductor Design Center in February 2025. Texas alone hosts USD 61 billion of ongoing capacity projects, with Samsung and Texas Instruments leading builds.[3]U.S. Department of Commerce, “CHIPS and Science Act Drives Historic Investment,” commerce.gov
Restraints Impact Analysis of Americas Microcontroller (MCU) Market*
| Restraint | (~) % Impact on CAGR Forecast | Geographic Relevance | Impact Timeline |
|---|---|---|---|
| Pricing commoditisation and margin squeeze | -0.40% | Americas-wide, particularly affecting high-volume consumer applications | Short term (≤ 2 years) |
| Persistent wafer-fab capacity bottlenecks below 28 nm | -0.30% | Global impact with Americas supply chain dependencies on Asian fabs | Medium term (2-4 years) |
| Software-complexity outpacing 8-/16-bit capabilities | -0.20% | North America industrial and automotive sectors, spillover to South America | Medium term (2-4 years) |
| IP-licensing and export-control compliance risks | -0.10% | US-Canada primarily, with regulatory spillover affecting Mexico and Brazil | Long term (≥ 4 years) |
| Source: Mordor Intelligence | |||
Pricing Commoditisation and Margin Squeeze
Volume segments such as wearables and entry-level smart-home sensors see ASP decline faster than input inflation. Microchip’s FY2025 net sales fell 42.3% despite healthy unit volumes, underscoring the knife-edge margin equation. RISC-V entrants with zero IP royalties intensify price competition, forcing established suppliers to differentiate through toolchains, reference designs, and long-term supply assurances.
Persistent Wafer-fab Capacity Bottlenecks Below 28 nm
Advanced high-performance MCUs increasingly need 22 nm or finer nodes, yet most regional fabs still run 40 nm and above. SEMI forecasts only 3% of CHIPS Act money earmarked for advanced packaging, a gap that constrains MCU throughput even as new wafer plants break ground. Legacy 28 nm lines remain critical for automotive safety MCUs that cannot redesign quickly, leaving the Americas microcontroller market exposed to Asia-centric supply shocks until local fabs complete in late 2027.
*Our forecasts treat driver/restraint impacts as directional, not additive. The impact forecasts reflect baseline growth, mix effects, and variable interactions.
Americas Microcontroller (MCU) Market Segment Analysis
By Bit Architecture:
64-bit Emergence AcceleratesIn 2025 the 32-bit class accounted for 53.85% of revenue and anchored the Americas microcontroller market. Demand centers on automotive body, chassis, and power modules where memory protection, FOTA support, and deterministic real-time performance outweigh raw compute. The Americas microcontroller market size for 32-bit devices is projected to climb at 2.05% CAGR through 2031 as legacy 16-bit sockets upgrade.
The 64-bit and above band, while below 10% share today, owns the fastest 5.54% CAGR. AI-heavy driver-monitoring cameras, software-defined vehicle domain controllers, and industrial vision systems each require expanded address space and advanced vector engines. Microchip’s PIC64 High-Performance Spaceflight Computing line brings RISC-V vector units that run machine-learning inference in radiation-hardened environments, giving defense primes a domestic alternative to custom ASICs.



By End-user Industry:
Healthcare Digitization Drives GrowthAutomotive remained the largest of all end-user buckets with 29.25% revenue in 2025. OEM roadmaps for level 2+ driver assistance, battery state-of-health analytics, and zonal architectures keep MCU attach counts high. The segment is predicted to advance at 2.96% CAGR as electrified platforms shorten refresh cycles.
Healthcare and medical devices post the fastest 5.78% CAGR. Continuous-glucose monitors, portable ultrasound, and AI-supported diagnostic imagers rely on low-power secure MCUs that handle sensor fusion and run FDA-cleared algorithms. The Americas microcontroller market share for healthcare is small today but expands quickly because hardware must comply with cybersecurity controls and detailed audit logging regimes set by the FDA.
By Core Architecture:
RISC-V Disruption AcceleratesARM-based designs held 62.55% revenue in 2025; wide tool support and power efficiency prop them up across almost every vertical. The Americas microcontroller market size attached to ARM cores is forecast to grow modestly as existing customers extend platforms rather than switch.
RISC-V units however add 4.72% CAGR, helped by start-ups that design cost-optimized SKUs free from royalty overhead. Infineon’s March 2025 automotive RISC-V MCU series, initially sampled to European OEMs, will ship from a Texas 300 mm line in late 2026. Adoption is particularly rapid in cost-sensitive consumer devices and simple industrial IO blocks.
By Connectivity:
Wireless Integration SurgesNon-wireless MCUs still supplied 71.10% of 2025 shipments, serving appliance controls, power-tool drivetrains, and safety-isolated industrial loops where wired buses dominate. Yet wireless-capable parts, growing 6.44% CAGR, pull ahead in terms of design wins as Thread, Wi-Fi 6, and ultra-wideband integrate onto a single package. Qualcomm and STMicroelectronics announced a reference platform that marries STM32 MCUs with Qualcomm AI wireless transceivers, trimming PCB area by 40% for next-gen smart-factory nodes.
Regulatory energy limits also spur low-sleep-current designs. Qorvo’s QPG6200L SoC consumes under 1 µA in deep sleep while maintaining tri-radio connectivity, enabling five-year battery life in door sensors.
Geography Analysis
United States and Canada Microcontroller (MCU) Market
The United States contributed 49.35% of 2025 revenue thanks to a USD 450 billion capex wave spanning 25 states. Texas claims the biggest slice after Samsung broke ground on a USD 17 billion Taylor fab and Texas Instruments expanded its Richardson campus. Canada fortifies back-end capacity: Ottawa granted USD 120 million to the Fabric network while IBM pledged USD 187 million for advanced packaging in Bromont, Quebec.
The Americas Microcontroller (MCU) Market
Brazil’s share is small today yet vaults on a 6,720% CAGR because PADIS tax incentives and the Kutsari Project create domestic chip design centers in São Paulo, Minas Gerais, and Pernambuco. Mexico leverages USMCA proximity, luring Foxconn and Nvidia to new AI server and superchip lines in Guadalajara. Secondary South American markets, including Argentina and Colombia, piggyback on MERCOSUR tariff breaks to import tooling and attract niche assembly houses.
Regulatory Landscape
The regulatory environment shaping the Americas MCU market in 2026 is increasingly influenced by US federal procurement and trade actions that affect approved bill-of-materials and supplier qualification. In February 2026, the FAR Council proposed a rule to implement Section 5949 of the FY2023 NDAA, restricting US federal procurement of certain semiconductor products linked to covered foreign entities (including SMIC, ChangXin Memory Technologies, and Yangtze Memory Technologies Corp). The proposal pushes OEMs and tier suppliers to tighten traceability and sourcing controls for embedded controllers used in government-facing programs.
On the trade side, a US Presidential Proclamation issued in January 2026 adjusted imports of semiconductors, semiconductor manufacturing equipment, and derivative products into the United States, including a 25% ad valorem duty on certain imports with defined exceptions tied to domestic technology supply-chain support and specific use cases. Alongside policy advocacy from bodies such as SEMI (2026 US policy strategy), these actions lift the compliance premium for MCU vendors and device makers selling into federally influenced verticals such as defense, critical infrastructure, and regulated industrial systems.
Value Chain Analysis
The Americas MCU value chain runs from IP and core ecosystems (ARM and RISC-V) through device and subsystem design, wafer fabrication (often at global foundries), assembly, test and packaging, distribution, and end-equipment integration across automotive, industrial automation, healthcare devices, and consumer electronics. Regional policy is starting to pull more upstream and midstream activity onshore: US near-shoring incentives under the CHIPS and Science Act and state-level programs such as the Texas Semiconductor Innovation Fund (nearly USD 950 million) are geared toward expanding manufacturing and design capacity. SEMI policy priorities in 2026 also emphasize maintaining access to critical inputs alongside domestic investment and R&D.
The R&D-to-manufacturing transition is a key linkage in the chain, particularly for secure and safety-grade MCUs that need validated toolchains and qualification flows. The US Department of Defense Microelectronics Commons functions as a public-private bridge connecting university labs and small business teams to prototyping and manufacturing pathways, supporting lab-to-fab maturation for defense-relevant microelectronics. On the capacity side, Texas Instruments' June 2025 commitment of more than USD 60 billion toward US manufacturing expansion adds a foundational-supply anchor for high-volume embedded control ICs that share manufacturing and packaging infrastructure with MCU portfolios.
Competitive Landscape
The Americas microcontroller market features moderate concentration. NXP Semiconductors, Texas Instruments, and Microchip Technology together command roughly 45% of regional revenue via broad portfolios that span 8-bit to 64-bit and integrate analog, connectivity, and security IP. NXP’s S32 CoreRide platform reduces software porting effort across vehicle zones and underpins long design-in cycles at OEMs. Texas Instruments differentiates through decades-long supply guarantees and fully characterized automotive temperature ranges. Microchip responds with MPLAB ecosystem updates, AI-assisted code generation, and a USD 880 million silicon-carbide capacity expansion in Colorado Springs.
Open-source ISA momentum stirs competition: Andes, Ventana, and SiFive license commercial RISC-V cores that allow tier-two MCU vendors to skip Arm royalties yet still ship certified development kits. Established players answer by widening security LSI, offering supply assurance contracts, and adding machine-learning accelerators. End users therefore choose between proven support networks and disruptive cost structures, balancing long-term availability against board spend.
White-space opportunities surround edge AI inference and medical wearable safety. Hardware-root-of-trust blocks meeting NIST IR 8425 and low-sleep-current radios propel premium ASPs in these niches despite overall commoditization pressures.
Americas Microcontroller (MCU) Industry Leaders
NXP Semiconductors N.V.
Texas Instruments Incorporated
Microchip Technology Inc.
STMicroelectronics N.V.
Renesas Electronics Corporation
- *Disclaimer: Major Players sorted in no particular order

Americas Microcontroller (MCU) Market Companies Covered in this Report
- Renesas Electronics Corporation
- NXP Semiconductors N.V.
- Microchip Technology Inc.
- Texas Instruments Incorporated
- Infineon Technologies AG
- STMicroelectronics N.V.
- ON Semiconductor Corporation
- Silicon Laboratories Inc.
- Nordic Semiconductor ASA
- Cypress Semiconductor Corporation
- Espressif Systems (Shanghai) Co., Ltd.
- GigaDevice Semiconductor Inc.
- Maxim Integrated Products, Inc.
- Analog Devices, Inc.
- Qualcomm Incorporated
- Intel Corporation
- Ambiq Micro, Inc.
- FUJITSU Semiconductor Memory Solution Ltd.
- Holtek Semiconductor Inc.
- Microsemi Corporation

Market Opportunities and Future Outlook
Security-driven redesign cycles and procurement constraints are creating near-term whitespace for MCU platforms that simplify compliance, provenance, and device-labeling readiness across US-influenced programs. The February 2026 proposed FAR rule implementing NDAA Section 5949 increases re-qualification and supply-chain due diligence pressure on OEMs and contractors for embedded controllers. That dynamic raises the value of suppliers that can provide transparent sourcing documentation, long-lifecycle availability, and validated security features, including hardware root of trust aligned to NIST IR 8425-style criteria in procurement and labeling workflows.
Domestic capacity buildouts and public R&D pathways are also expanding opportunities for localized design-in support, packaging access, and faster iteration for industrial, automotive, and defense-adjacent embedded systems. The evidence of this investment cycle includes Texas Instruments' plan to invest more than USD 60 billion to manufacture foundational semiconductors in the United States and the DoD Microelectronics Commons program connecting prototyping hubs to manufacturing transitions. In parallel, Texas-level incentives such as the Texas Semiconductor Innovation Fund and large-scale facility programs provide engagement channels for MCU vendors and module makers to co-locate engineering, validation, and supply assurance around new and expanding US manufacturing footprints, which is particularly relevant for sub-28 nm constrained product lines and automotive-grade qualification timelines.
Recent Industry Developments in Americas Microcontroller (MCU) Market
- April 2026: Microchip Technology added dsPIC33AK256MPS306 Digital Signal Controllers to the dsPIC33A family, supporting post-quantum cryptography and high-density power applications. The expansion directly augments MCU/DSC offerings for industrial and automotive edge deployments. It strengthens secure, high-performance edge compute options and supports post-quantum cryptography for regulated environments.
- March 2026: Texas Instruments Incorporated expanded its microcontroller portfolio with MSPM0G5187 and AM13Ex families and integrated TinyEngine neural processing unit for edge AI. The addition enhances TI's edge AI enabled MCU offerings in the Americas market. It accelerates on-device AI inference and supports zonal architectures for industrial and automotive sectors.
- January 2026: NXP Semiconductors N.V. launched the S32N7 super-integration vehicle processor series built on a 5nm foundation for vehicle digitalization. The product targets automotive MCU/SoC needs in the Americas market. It enables highly integrated vehicle ECUs with software-defined architectures and is developed in collaboration with Bosch, reinforcing automotive MCU leadership.


Americas Microcontroller (MCU) Market Report Scope and Research Methodology
Market Definition and Coverage
This market covers revenue generated from microcontrollers shipped and used across the Americas, counted at the point of sale into device makers and OEM supply chains, and reported in USD for the study years.
Scope exclusions: We exclude adjacent products such as microprocessors, discrete logic, and standalone memory, and we also avoid double counting distributor pass-through revenue when it is already captured in supplier shipments.
Segments Covered in This Report
- By Bit Architecture
- 8-bit
- 16-bit
- 32-bit
- 64-bit and Above
- By End-user Industry
- Automotive
- Consumer Electronics
- Industrial Automation
- Communications and Networking
- Healthcare and Medical Devices
- Others
- By Core Architecture
- ARM-based
- RISC-V-based
- x86-based
- Proprietary Cores
- By Connectivity
- Wireless-enabled MCUs
- Non-wireless MCUs
- By Geography
- North America
- United States
- Canada
- Mexico
- South America
- Brazil
- Argentina
- Rest of South America
- North America
Data Sources, Market Sizing, and Validation
Desk Research
Desk research was used to set the market boundaries, build the starting demand pool, and sense-check regional cycles that affect shipments and pricing. We typically reference public data such as US Census Bureau trade statistics, the US International Trade Commission import-export tables, SEMI updates on fab activity, and Federal Reserve industrial production series, which help explain electronics output swings and lead-time behavior.
For technology context, we used sources such as IEEE papers on embedded systems, USPTO patent databases to track design activity, and reputable press and company filings that clarify product roadmaps and end-market exposure. Where coverage improved, paid subscriptions were used for company financials and shipment databases, plus patent lookups, and these were then cross-checked against public disclosures. This list is not exhaustive, and we reviewed many other sources to collect data, validate assumptions, and close open questions.
Primary Interviews and Surveys
Primary work was run to test the model assumptions that desk sources do not reliably explain, especially around pricing moves, lead-time normalization, and how design wins translate into unit volumes. We spoke with component suppliers, distribution-side stakeholders, and device makers across North America and South America, then used follow-up checks to resolve any large variances in end-use splits and shipment timing.
Distribution of primary research fieldwork respondents
| Company type | Respondent position |
|---|---|
| Top tier: 32% | CXOs: 12% |
| Mid tier: 54% | Functional/Unit leaders: 33% |
| Smaller Players: 14% | Managers: 55% |
Market-Sizing & Forecasting
Sizing starts with a top-down reconstruction that links Americas electronics production and trade flows to MCU consumption, then applies end-use penetration rates for embedded control across vehicles, industrial automation, consumer devices, and connected infrastructure. To keep the totals grounded, we corroborate the outcome with selective bottom-up checks such as sampled ASP times estimated unit shipments for key MCU classes, alongside supplier and channel checks on regional shipment direction.
Key inputs used in the model include the split of demand by end-use industry, typical MCU content per application (for example, control modules in vehicles and factory equipment), observed import and export movements for semiconductor devices, estimated inventory correction cycles, and average selling price progression by bit architecture and connectivity features. Where data is thin for smaller countries, we handle gaps by using proxy indicators like industrial output and vehicle production, followed by primary checks to avoid over-extending proxies.
Forecasts are built using scenario analysis supported by a simple multivariate regression, where the main drivers include regional manufacturing activity, auto production trends, and expected embedded adoption in industrial and IoT designs. Assumptions are reviewed with interview feedback so the forecast reflects practical design-cycle timing rather than only macro growth.
Data Validation & Update Cycle
Outputs are triangulated across multiple angles, including trade and production signals, supplier commentary, and consistency checks on implied units and implied ASPs. If a country or end-use shows a jump that does not align with these independent signals, the inputs are re-opened and the related primary contacts are re-checked before moving to sign-off.
A multi-step analyst review is followed so arithmetic, scope alignment, and key assumptions are verified by a second set of eyes. Reports are refreshed annually, and interim updates are made when material events occur, such as major capacity shifts, supply disruptions, or step-changes in demand from automotive and industrial programs. Before delivery, a final pass is performed so clients receive the latest updated view.
Mordor Intelligence's Americas Microcontroller Market Estimate Compared With Other Published Estimates
Published market values for microcontrollers in the Americas can look far apart because underlying counting rules differ even when the product name sounds the same. The main differences usually come from whether revenue is captured at the semiconductor shipment level or at the module and board level, how distributors are treated, and whether the geography is strictly the Americas or partially blended with global allocations.
Import-export directionality, implied unit-to-revenue checks, and end-use output indicators are the evidence points that keep Mordor Intelligence tied to shipment-level MCU revenue in the Americas rather than mixing in microprocessors or higher-level electronics assemblies. Other figures can also move because some studies use aggressive price expansion, some apply a fixed ASP, and some refresh less frequently, which matters in a market shaped by inventory digestion and lead-time swings.
Benchmark comparison
| Source | Market Size | Gaps in Research Methodology |
|---|---|---|
| Mordor Intelligence | USD 725.23 M (2025) | |
| Regional Consultancy A | USD 1.05 B (2025) | Uses a broader definition that appears to include MCU-based modules and embedded boards, and it also blends distributor value-add into revenue, which can inflate totals versus shipment-level counting. |
| Trade Journal B | USD 612.40 M (2025) | Built mainly from a limited supplier survey and a conservative price curve, and it under-represents automotive and industrial demand where content per system is higher and design cycles are longer. |
The spread in the table is mostly explained by scope boundaries and how pricing and channel revenue are treated. By keeping the count at MCU shipment revenue and then validating it with independent trade and demand signals, the estimate remains traceable to clear inputs and can be repeated when new annual data and primary checks are added.


Key Questions Answered in the Report
What is the current size of the Americas microcontroller market?
The market is valued at USD 739.52 million in 2026 and is set to reach USD 815.33 million by 2031, growing at a 1.97% CAGR.
Which end-user industry generates the most revenue?
Automotive leads with 29.25% of 2025 revenue, helped by rising electric-vehicle and ADAS deployments.
Which segment is expanding fastest?
Healthcare and medical devices show the highest 5.78% CAGR through 2031, supported by FDA-cleared AI devices and stricter cybersecurity rules.
How dominant are ARM-based microcontrollers in the region?
ARM-based designs held 62.55% revenue share in 2025, although RISC-V parts are gaining on a 4.72% CAGR.
Why is Brazil’s growth rate so high?
Brazil benefits from the Nova Indústria Brasil incentives and the Kutsari Project, giving the country a forecast 6,720% CAGR to 2031.
What risks could slow market growth?
Price commoditisation in high-volume consumer lines and sub-28 nm wafer shortages could trim overall CAGR by 0.7 percentage points.
Page last updated on:





