Amblyopia Treatment Market Size and Share
Market Overview
| Study Period | 2020 - 2031 |
|---|---|
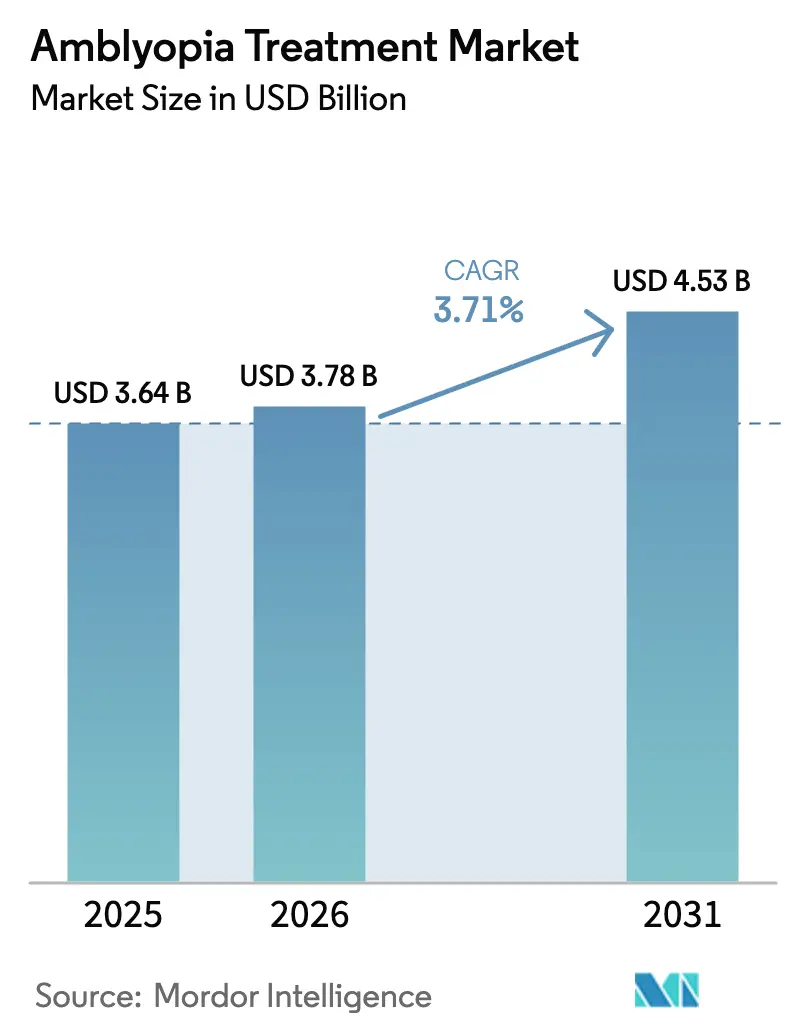
| Market Size (2026) | USD 3.78 Billion |
| Market Size (2031) | USD 4.53 Billion |
| Growth Rate (2026 - 2031) | 3.71% CAGR |
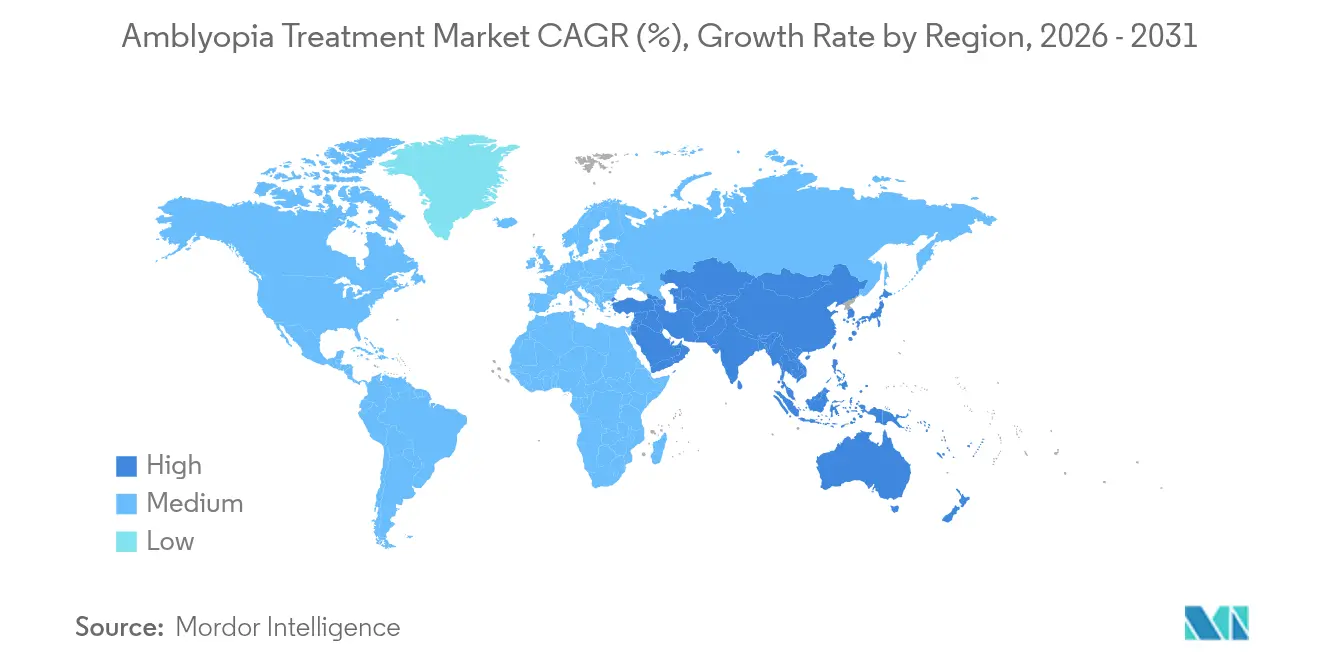
| Fastest Growing Market | Asia-Pacific |
| Largest Market | North America |
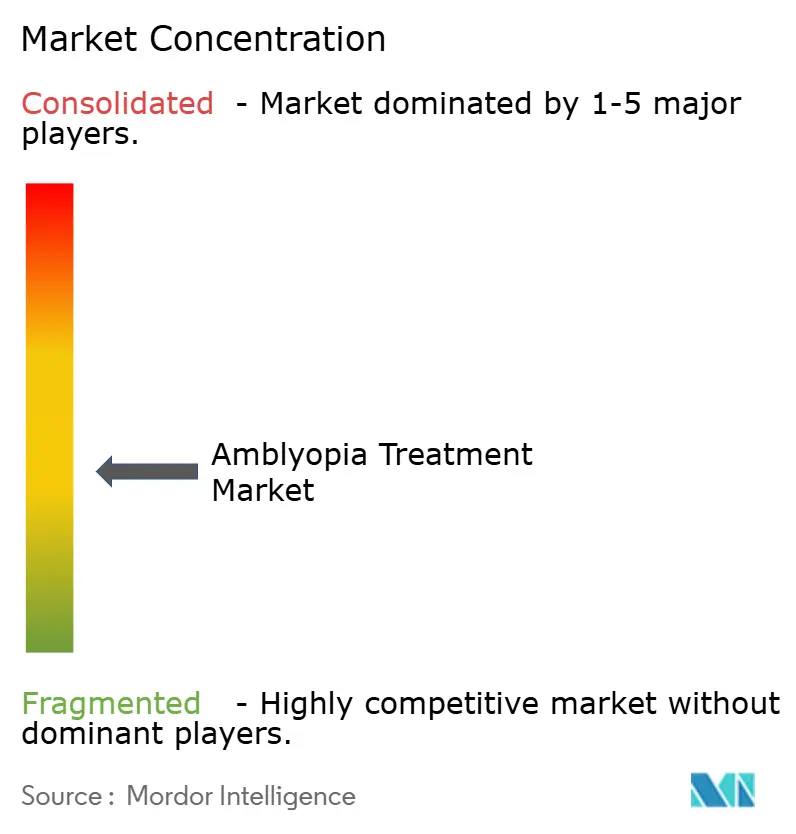
| Market Concentration | Medium |
Major Players *Disclaimer: Major Players sorted in no particular order Image © Mordor Intelligence. Reuse requires attribution under CC BY 4.0. | |
Amblyopia Treatment Market Analysis by Mordor Intelligence
The Amblyopia Treatment market size is expected to grow from USD 3.64 billion in 2025 to USD 3.78 billion in 2026 and is forecast to reach USD 4.53 billion by 2031 at 3.71% CAGR over 2026-2031.
This growth reflects a shift from patch-based therapy toward FDA-cleared digital platforms, broader insurance reimbursement, and greater pediatric screening coverage. Digital therapeutics gain traction because adherence rates approach 94%, markedly higher than the 83.9% reported for conventional patching. Expanding low-dose atropine approvals, rising prevalence linked to myopia, and AI-driven diagnostics also create tailwinds for the amblyopia treatment market. Regionally, North America maintains revenue leadership, while Asia-Pacific records the fastest uptake as governments invest in pediatric eye-health infrastructure and smartphone screening apps bridge rural gaps. Corporate strategies center on partnerships that fuse diagnostics, therapy, and monitoring into unified home-care ecosystems.
Key Report Takeaways
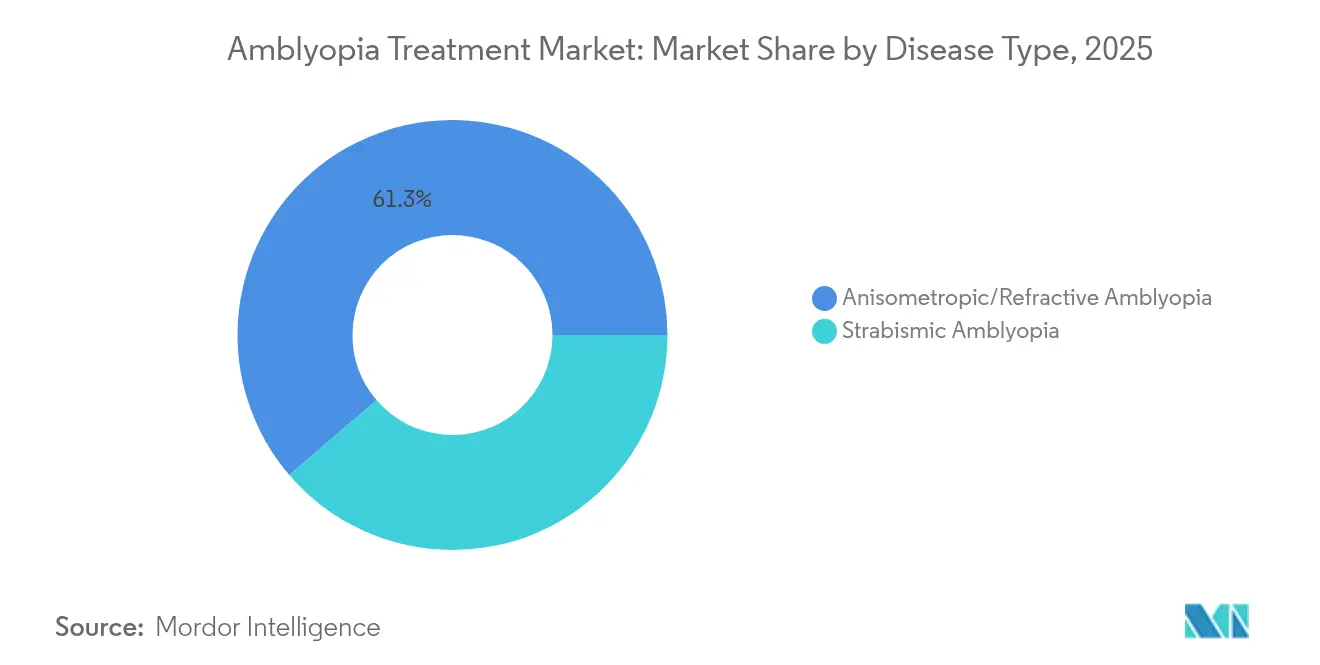
- By disease type, strabismic amblyopia held 38.72% of the amblyopia treatment market share in 2025, while deprivation amblyopia posted the highest 7.14% CAGR through 2031.
- By treatment modality, occlusion therapy accounted for 59.12% of the amblyopia treatment market size in 2025; digital therapeutics are expanding at a 6.08% CAGR to 2031.
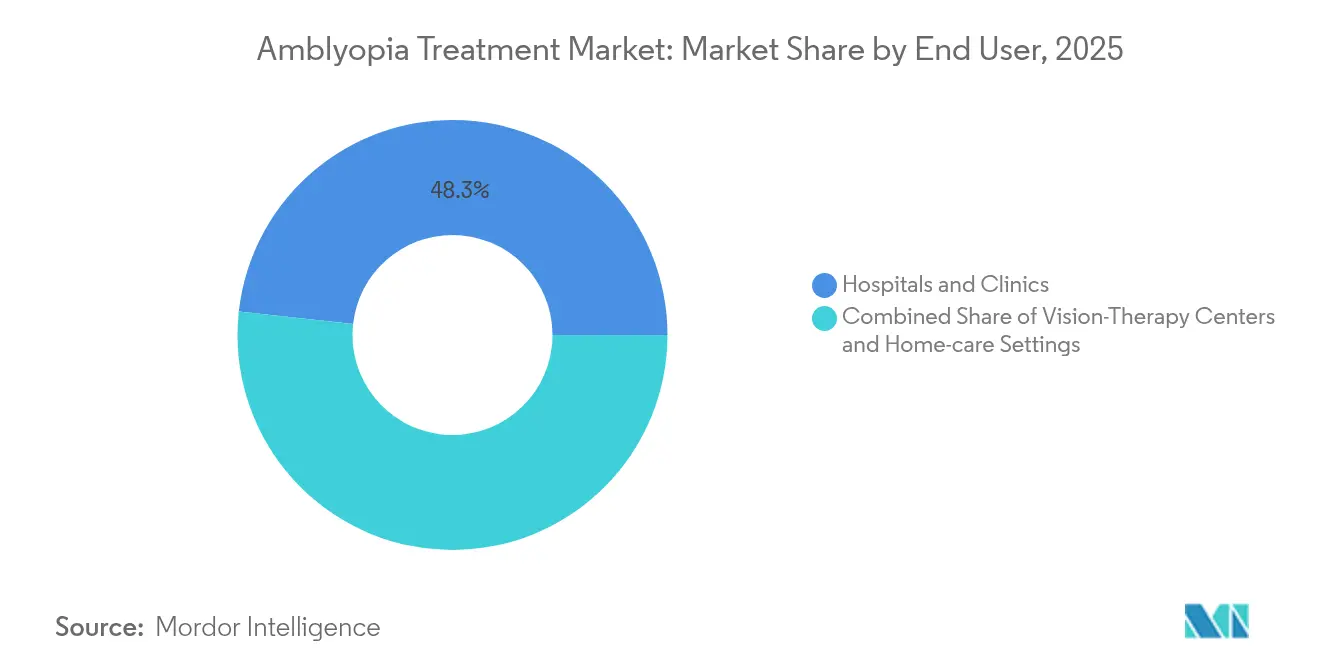
- By end user, hospitals and clinics controlled 48.25% revenue in 2025, whereas home-care settings are projected to advance at an 8.02% CAGR.
- By geography, North America captured 41.15% of the amblyopia treatment market share in 2025, and Asia-Pacific is poised for a 6.74% CAGR through 2031.
Note: Market size and forecast figures in this report are generated using Mordor Intelligence’s proprietary estimation framework, updated with the latest available data and insights as of 2026.
Global Amblyopia Treatment Market Trends and Insights
Drivers Impact Analysis*
| Driver | (~) % Impact on CAGR Forecast | Geographic Relevance | Impact Timeline |
|---|---|---|---|
| Rising Global Prevalence of Amblyopia | +0.8% | Global, with highest impact in Asia-Pacific | Long term (≥ 4 years) |
| Growing Adoption of Low-Dose Atropine Therapy | +0.6% | North America & Europe, expanding to APAC | Medium term (2-4 years) |
| Technological Shift Toward Digital/VR Therapeutics | +1.2% | North America & EU core, spill-over to APAC | Short term (≤ 2 years) |
| Expansion of Structured Pediatric Vision-Screening Mandates | +0.5% | Global, with early gains in developed markets | Medium term (2-4 years) |
| AI-Driven Binocular-Vision Diagnostics Enabling Personalization | +0.4% | North America & EU, pilot programs in APAC | Long term (≥ 4 years) |
| Rapid Smartphone Penetration Enabling Home-Based Vision Games | +0.3% | Global, accelerated adoption in LMICs | Short term (≤ 2 years) |
| Source: Mordor Intelligence | |||
Rising Global Prevalence of Amblyopia
Shanghai Children’s Hospital found a 24.24% prevalence among 920 screened children, with anisometropia responsible for 68.99% of unilateral cases.[1]BMC Ophthalmology, “Epidemiology of Amblyopia in Shanghai Pediatric Population,” bmcophthalmol.biomedcentral.com Earlier detection aligns intervention with critical neuroplastic windows, directly lifting demand in the amblyopia treatment market. Deprivation cases benefit most, because unilateral congenital cataracts require surgery within eight weeks to avert irreversible loss.[2]Italian Journal of Pediatrics, “Timing of Congenital Cataract Surgery,” ijponline.biomedcentral.com The prevalence uplift is therefore translating to higher therapy volumes across all regions.
Growing Adoption of Low-Dose Atropine Therapy
FDA accepted Sydnexis’ SYD-101 NDA with a decision target of October 2025, paving the way for the first U.S.-approved low-dose atropine drop. CHAMP trial data on 576 children confirmed 0.01% atropine’s favorable safety profile.[3]Myopia Profile, “CHAMP Study Update,” myopiaprofile.com Europe mirrored the momentum, granting EC approval to Santen’s Ryjunea in June 2025. Debate continues over optimal concentration after evidence that 0.05% offers greater efficacy but more photophobia. Monthly refill logistics remain a prime discontinuation driver in Turkey, underscoring adherence management as a growth lever. Collectively, these milestones elevate pharmacologic demand within the amblyopia treatment industry.
Technological Shift Toward Digital/VR Therapeutics
In May 2025, Luminopia widened its FDA clearance to include patients aged 8-12, opening therapy to roughly 400,000 extra U.S. children. Randomized data show 86% visual-acuity gains with 94% adherence versus 83.9% for patching. CureSight sustained improvements at both 12-week and 1-year assessments, underpinning long-term efficacy for binocular digital care. Major payers such as Anthem and Highmark now reimburse these platforms. This alignment of regulation, evidence, and payment accelerates digital share within the amblyopia treatment market.
Expansion of Structured Pediatric Vision-Screening Mandates
The 2024 U.S. Early Detection of Vision Impairments for Children (EDVI) Act spurred statewide photoscreening deployment. Ohio’s Preschool Vision Screening Collaborative raised pass rates from 18% to 87%. Device choice matters: PlusoptiX outperformed AI-Optic in high-risk cohorts. Smartphone apps, validated in LMIC field studies, deliver high sensitivity and specificity, mitigating workforce shortages. Yet rural areas still lack adequate treatment facilities once cases are flagged, spotlighting a systemic gap the amblyopia treatment market must fill.
Restraints Impact Analysis*
| Restraint | (~) % Impact on CAGR Forecast | Geographic Relevance | Impact Timeline |
|---|---|---|---|
| Low Public Awareness & Late Diagnosis in LMICs | -0.9% | APAC, MEA, Latin America | Long term (≥ 4 years) |
| Stringent Regulatory Pathway for Digital Therapeutics | -0.6% | Global, most restrictive in EU and Japan | Medium term (2-4 years) |
| Compliance Drop-Off with Occlusion & Atropine Regimens | -0.4% | Global, higher impact in developed markets | Short term (≤ 2 years) |
| Sparse Clinical-Outcome Data in Adult Amblyopia | -0.3% | Global, limiting market expansion potential | Long term (≥ 4 years) |
| Source: Mordor Intelligence | |||
Low Public Awareness & Late Diagnosis in LMICs
Ethiopian pharmacies prescribe antibiotics in 41.3% of ocular cases, reflecting misdiagnosis and limited specialist input. In India, delayed childhood-cataract surgery remains common due to socioeconomic and awareness gaps, heightening deprivation amblyopia risk. Uncorrected refractive errors affect 1 billion people, overwhelmingly in LMICs, with cost and distribution hurdles impeding access. Surveys show 87% of experts endorse primary eye-care expansion in underserved villages, yet funding shortfalls persist. These systemic barriers curb demand growth for the amblyopia treatment market despite clinical advances.
Stringent Regulatory Pathway for Digital Therapeutics
FDA’s de-novo pathway obliges manufacturers to produce safety evidence akin to implantable devices, adding years and millions in development costs. EU Conformité Européenne rules require separate country-level reimbursement dossiers even after central approval, fragmenting commercial rollout. U.S. payers increasingly seek real-world outcomes before granting blanket coverage, prolonging revenue ramp-up. Start-ups lacking capital for global trials face steep hurdles, which may narrow future competition within the amblyopia treatment industry.
*Our forecasts treat driver/restraint impacts as directional, not additive. The impact forecasts reflect baseline growth, mix effects, and variable interactions.
Segment Analysis
By Disease Type: Deprivation Cases Drive Innovation
Strabismic cases remained the largest contributor, representing 38.72% of the amblyopia treatment market share in 2025. Deprivation amblyopia, though smaller, is projected to accelerate at 7.14% CAGR on the back of faster cataract-surgery scheduling and AI risk-stratification tools. This growth lifts the amblyopia treatment market size for surgical adjuncts and intensive postoperative therapies. Mixed presentations often require multi-modal regimens, encouraging cross-segment product bundling.
Improved risk profiling shows 61% persistent amblyopia in high-risk infants versus 6% in low-risk cohorts, prompting early therapeutic escalation. Binocular digital games benefit anisometropic and refractive subtypes by directly addressing suppression. Precision-medicine approaches that align subtype, severity, and neuroplasticity window are gradually replacing uniform patching, reinforcing product differentiation across the amblyopia treatment market.


By Treatment Modality: Digital Disruption Accelerates
Occlusion therapy delivered 59.12% of 2025 revenue but will cede share as digital platforms grow at a 6.08% CAGR. The amblyopia treatment market size for digital therapeutics expands in parallel with broader home-care adoption. Pharmacologic options gain visibility through low-dose atropine approvals, while binocular vision devices ride neuroplasticity insights.
CureSight trials reported 94% adherence, confirming better tolerance than patching and raising payer interest. RevitalVision’s FDA clearance for patients ≥ 9 years opens late-diagnosis and adult opportunities, a traditionally underserved cohort. Experimental agents such as donepezil demonstrate 1.2-line gains in resistant cases, hinting at future pharmacologic diversification. These advances collectively accelerate modality diversification inside the amblyopia treatment industry.
By End User: Home-Care Revolution Transforms Delivery
Hospitals and clinics still controlled 48.25% of 2025 spending, thanks to their diagnostic primacy. Yet, home-care settings are forecast to climb 8.02% CAGR, elevating the amblyopia treatment market size for remote-monitoring solutions. Vision-therapy centers keep a specialized foothold for intensive regimens.
Luminopia showcases clinic-equivalent outcomes when used entirely at home, encouraging families to shift treatment outside hospital walls. Telehealth portals permit clinicians to adjust dosing remotely, cutting travel burdens in rural America. Reviews of Bynocs indicate improvements from 6/12 to 6/6p after routine home exercises over eight weeks. As payers tie reimbursement to real-world adherence, hybrid care models that mix professional oversight with home execution are likely to dominate the amblyopia treatment market.
Geography Analysis
North America generated 41.15% of 2025 revenue, supported by FDA leadership in digital approvals and payer decisions from Anthem and Highmark that remove cost barriers for innovative care. The region’s urban-rural disparity remains; screening mandates raise detection, but specialist shortages hamper follow-through in remote counties. Consolidated provider networks increasingly deploy tele-ophthalmology units to plug gaps, sustaining demand growth across the amblyopia treatment market.
Asia-Pacific is forecast to expand at 6.74% CAGR, the fastest worldwide, as myopia reaches epidemic levels that elevate amblyopia incidence. Japan fields 114 ophthalmologists per million residents, yet neighboring districts post zero coverage, illustrating the maldistribution challenge. China hosts CureSight’s pivotal 40-patient study at Fudan University, underscoring the region’s research momentum. Smartphone-based vision games resonate with tech-savvy parents, while public-sector programs subsidize devices for low-income families, enlarging the amblyopia treatment market.
Europe maintains steady, mid-single-digit expansion. The European Commission granted Ryjunea approval in June 2025, setting a template for continent-wide pharmacologic launches. Health-technology assessments emphasize cost per quality-adjusted life-year; Welsh data show orthokeratology and multifocal lenses meet economic thresholds despite private-pay origins. Middle East & Africa and South America trail but offer upside via mobile screening platforms that bypass brick-and-mortar deficits. Stakeholders targeting these zones tailor pricing to public-health budgets, thereby widening the amblyopia treatment market’s global footprint.

Competitive Landscape
The amblyopia treatment market features moderate fragmentation with signs of consolidation. Bausch + Lomb posted USD 4.146 billion 2023 revenue, up 10%, including USD 662 million from Vision Care in Q4 2023. Novartis acquired Amblyotech and collaborates with Ubisoft to fuse gaming mechanics into therapy, illustrating legacy players’ pivot toward engagement-based models.
Disruptors like Luminopia, CureSight, and RevitalVision specialize in binocular digital treatment. Luminopia’s age-range expansion effectively doubles its U.S. addressable pool, intensifying competition with patch and atropine suppliers. Cleveland Clinic meanwhile developed an AI model to detect amblyopia by analyzing eye-movement micro-saccades, signaling diagnostic innovation that could funnel more patients into therapy pipelines.
Strategic collaboration is rising: Tenpoint Therapeutics’ NDA for BRIMOCHOL PF in April 2025 highlights cross-indication R&D that may spill into amblyopia. Companies bundling diagnostics, therapy, and adherence analytics are poised to command higher switching costs and stronger patient-lifecycle revenue inside the amblyopia treatment industry.
Amblyopia Treatment Industry Leaders
Krafty Eye Patches
3M
NovaSight
RevitalVision
Vivid Vision
- *Disclaimer: Major Players sorted in no particular order

Recent Industry Developments
- June 2025: Sydnexis received European Commission approval for SYD-101, a low-dose atropine formulation for pediatric myopia treatment, marking the first pharmaceutical option specifically designed for myopia progression control in European markets. This approval establishes a regulatory precedent for atropine-based therapies and positions Sydnexis to capture significant market share in the growing myopia control segment.
- June 2025: Santen Pharmaceutical secured European Commission approval for Ryjunea, expanding the company's pediatric ophthalmology portfolio and strengthening its position in the myopia management market. The approval validates Santen's strategic focus on pediatric eye care and provides a foundation for global market expansion.
- May 2025: Luminopia received FDA clearance expansion to include patients aged 8-12 years for amblyopia treatment, representing the first such age range extension in over 20 years and effectively doubling the company's addressable patient population. This regulatory milestone demonstrates the FDA's confidence in digital therapeutics efficacy and safety profiles.
- May 2025: Anthem Blue Cross Blue Shield approved coverage for Luminopia's amblyopia treatment, joining other major payers in validating digital therapeutics as cost-effective treatment options. This coverage decision signals broader insurance industry acceptance and removes significant financial barriers for patient access.


Global Amblyopia Treatment Market Report Scope
Amblyopia is the reduction of best-corrected visual acuity in one or both eyes, which cannot be attributed exclusively to abnormalities in the eye. Amblyopia develops during childhood and results in the interruption of normal critical visual pathway development.
The amblyopia treatment market is segmented by type, treatment products, and geography. By type, the market is segmented into strabismic amblyopia, refractive amblyopia, and deprivation amblyopia. By treatment, the market is segmented into eye patches, atropine drops, glasses, and video games. By geography, the market is segmented into North America, Europe, Asia-Pacific, Middle East and Africa, and South America. The market report also covers the estimated market sizes and trends of 17 countries across major regions globally. The report offers market size and forecast in terms of value (USD) for the above segments.
| Strabismic Amblyopia |
| Anisometropic/Refractive Amblyopia |
| Deprivation Amblyopia |
| Mixed/Combined Amblyopia |
| Occlusion Therapy |
| Pharmacologic Therapy |
| Optical Correction |
| Digital Therapeutics |
| Binocular Vision Devices |
| Other Treatments |
| Hospitals & Clinics |
| Vision-Therapy Centers |
| Home-care Settings |
| North America | United States |
| Canada | |
| Mexico | |
| Europe | Germany |
| United Kingdom | |
| France | |
| Italy | |
| Spain | |
| Rest of Europe | |
| Asia-Pacific | China |
| Japan | |
| India | |
| Australia | |
| South Korea | |
| Rest of Asia-Pacific | |
| Middle East & Africa | GCC |
| South Africa | |
| Rest of Middle East & Africa | |
| South America | Brazil |
| Argentina | |
| Rest of South America |
| By Disease Type | Strabismic Amblyopia | |
| Anisometropic/Refractive Amblyopia | ||
| Deprivation Amblyopia | ||
| Mixed/Combined Amblyopia | ||
| By Treatment Modality | Occlusion Therapy | |
| Pharmacologic Therapy | ||
| Optical Correction | ||
| Digital Therapeutics | ||
| Binocular Vision Devices | ||
| Other Treatments | ||
| By End User | Hospitals & Clinics | |
| Vision-Therapy Centers | ||
| Home-care Settings | ||
| By Geography | North America | United States |
| Canada | ||
| Mexico | ||
| Europe | Germany | |
| United Kingdom | ||
| France | ||
| Italy | ||
| Spain | ||
| Rest of Europe | ||
| Asia-Pacific | China | |
| Japan | ||
| India | ||
| Australia | ||
| South Korea | ||
| Rest of Asia-Pacific | ||
| Middle East & Africa | GCC | |
| South Africa | ||
| Rest of Middle East & Africa | ||
| South America | Brazil | |
| Argentina | ||
| Rest of South America | ||


Key Questions Answered in the Report
What is the current value of the amblyopia treatment market?
It stands at USD 3.78 billion in 2026 and is projected to hit USD 4.53 billion by 2031.
Which region is expanding fastest for amblyopia therapy?
Asia-Pacific, with a 6.74% CAGR driven by rising myopia and healthcare investment.
How big is digital therapeutics’ role in amblyopia care?
Digital platforms are the fastest-growing modality, advancing at 6.08% CAGR with adherence nearing 94%.
Why is low-dose atropine important for amblyopia?
FDA and EC milestones confirm its safety and dual role in slowing myopia progression and preventing associated amblyopia.
Which end-user segment shows the highest growth?
Home-care settings, forecast to climb at 8.02% CAGR as telehealth and remote monitoring gain traction.
What limits digital therapeutic rollout globally?
Complex regulatory pathways and staggered payer coverage create longer commercialization timelines, especially in the EU and Japan.
Page last updated on:


