Dry Eye Disease Market Size and Share
Market Overview
| Study Period | 2020 - 2031 |
|---|---|
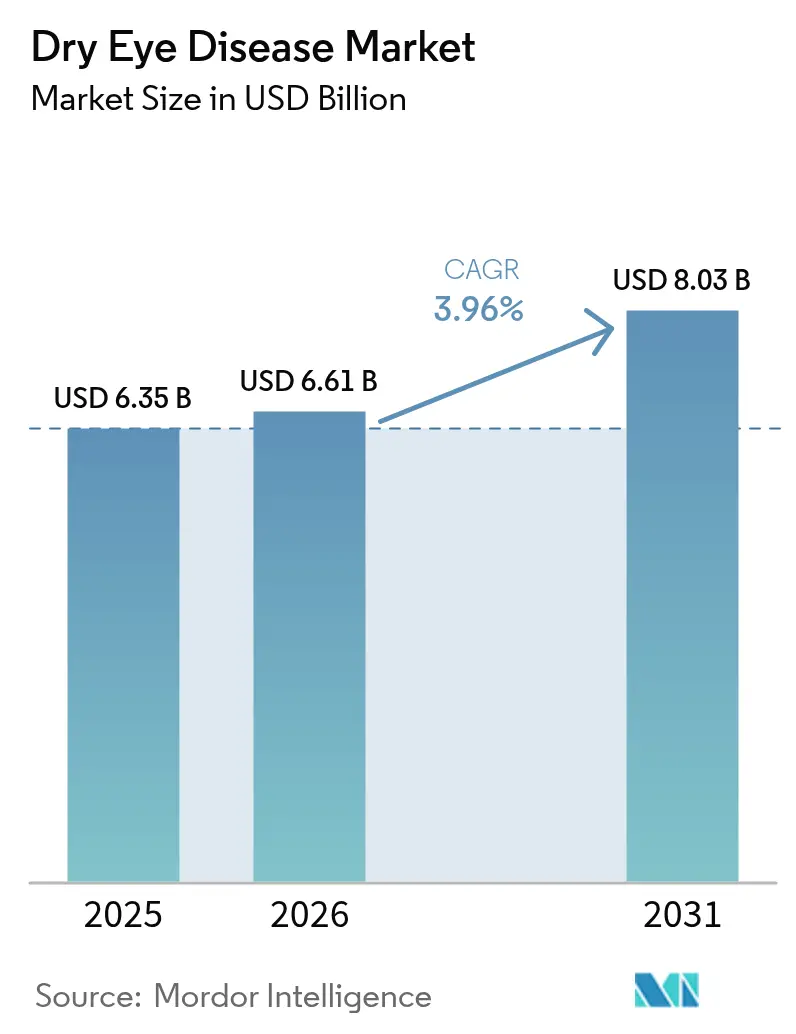
| Market Size (2026) | USD 6.61 Billion |
| Market Size (2031) | USD 8.03 Billion |
| Growth Rate (2026 - 2031) | 3.96% CAGR |
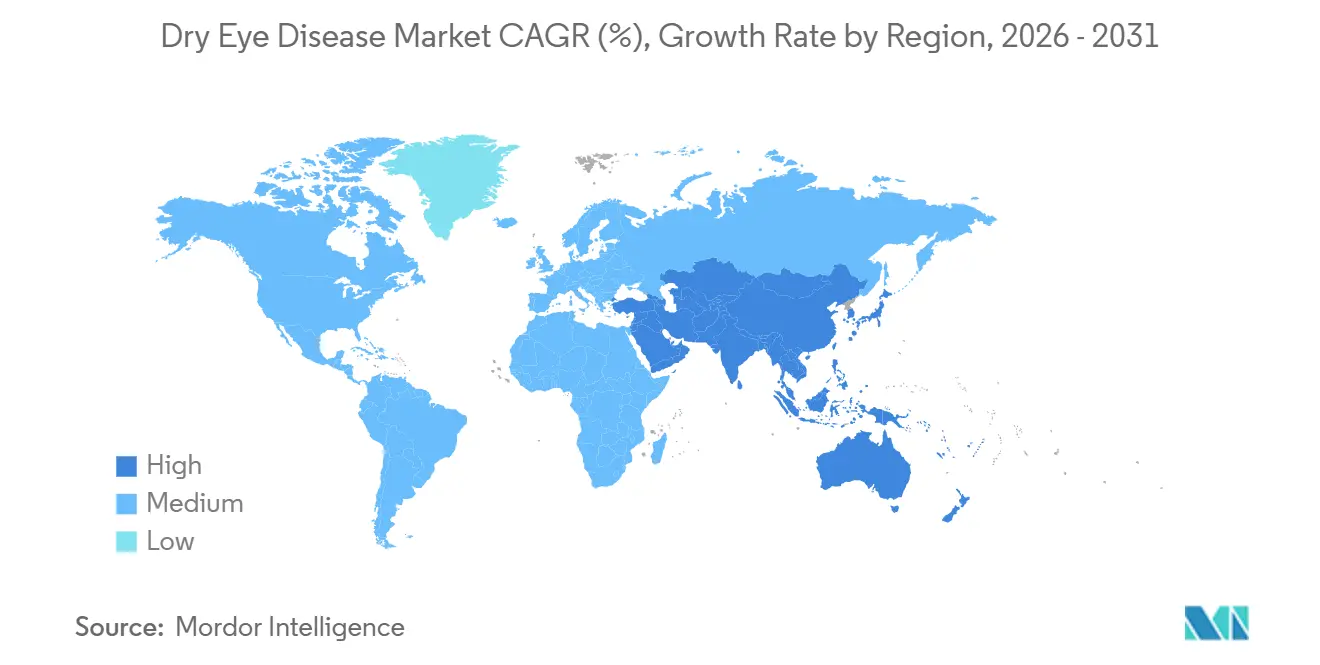
| Fastest Growing Market | Asia-Pacific |
| Largest Market | North America |
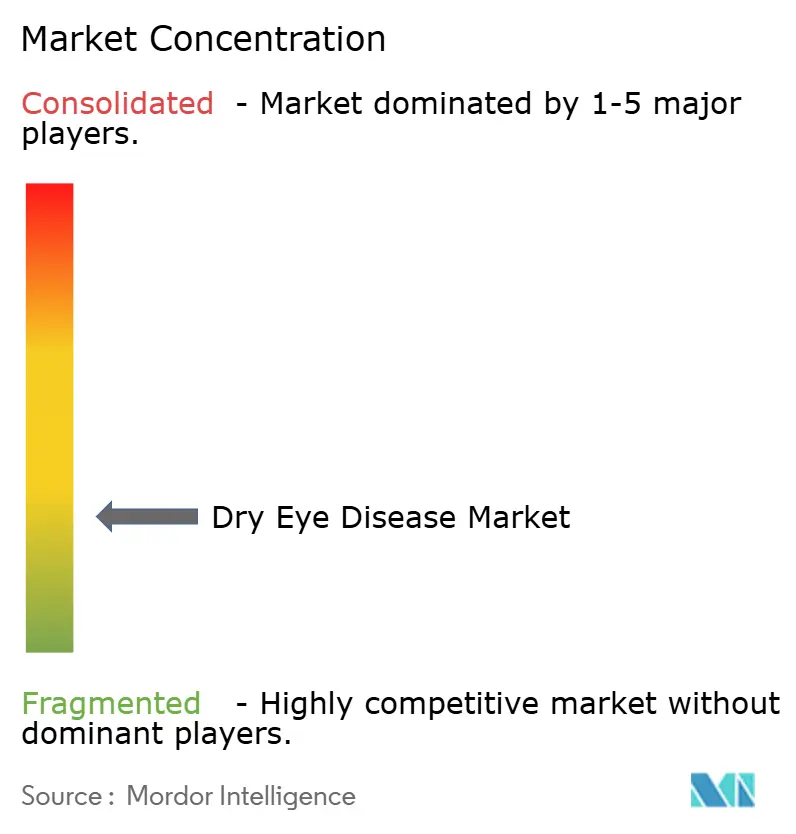
| Market Concentration | Low |
Major Players *Disclaimer: Major Players sorted in no particular order Image © Mordor Intelligence. Reuse requires attribution under CC BY 4.0. | |
Dry Eye Disease Market Analysis by Mordor Intelligence
The Dry Eye Disease Market size is expected to grow from USD 6.35 billion in 2025 to USD 6.61 billion in 2026 and is forecast to reach USD 8.03 billion by 2031 at 3.96% CAGR over 2026-2031.
Accelerated growth reflects permanently higher screen exposure, a rapidly aging global population, and the pivot from symptomatic lubricants toward prescription agents that modulate the tear film’s underlying biology. Innovation in secretagogues, TRPM8 agonists, and RASP inhibitors is widening therapeutic choice, while tele-ophthalmology removes geographic barriers and expands the diagnosed patient pool. Competitive differentiation now turns on preservative-free formulations, sustained-release delivery, and device-drug hybrids that address meibomian gland dysfunction and aqueous deficiency in parallel. Simultaneously, manufacturers are navigating reimbursement gaps in emerging economies and mounting generic pressure on cyclosporine, forcing a recalibration of pricing and lifecycle strategies.
Key Report Takeaways
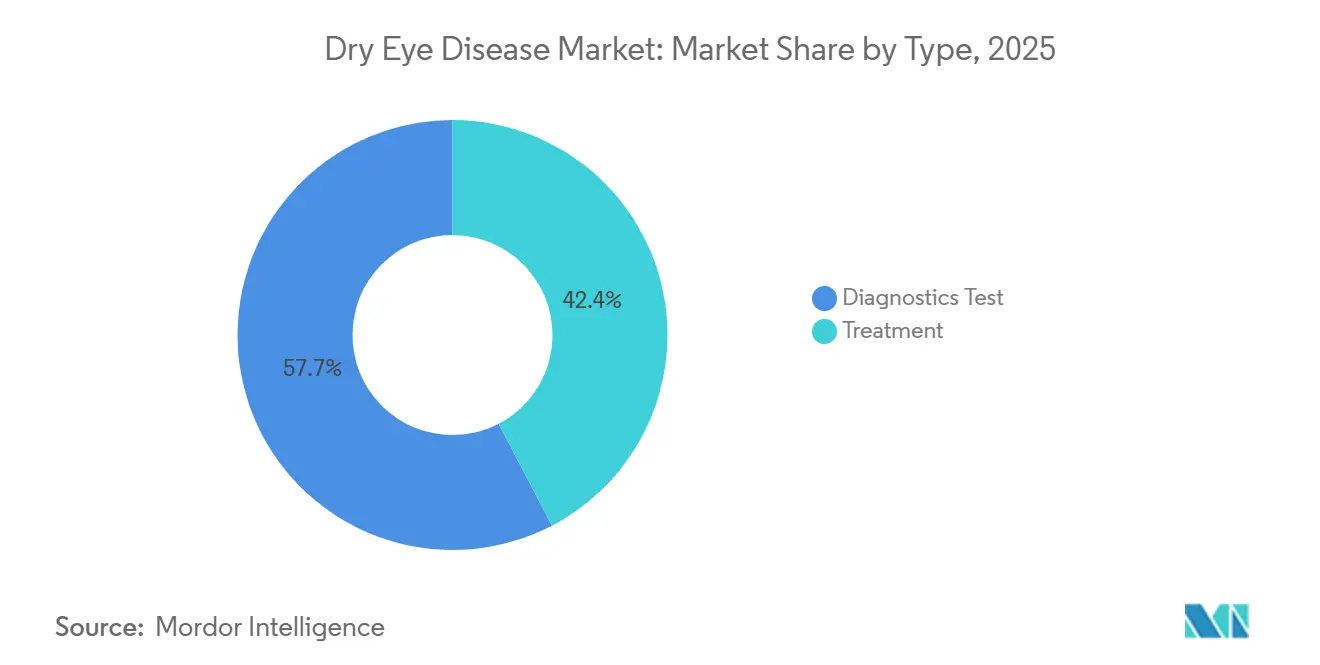
- By treatment modality, prescription therapies led with 42.35% of dry eye disease market share in 2025; diagnostics are forecast to expand at a 6.62% CAGR to 2031
- By disease type, evaporative cases held 52.40% revenue in 2025, while aqueous-deficient cases are projected to grow at a 7.45% CAGR through 2031
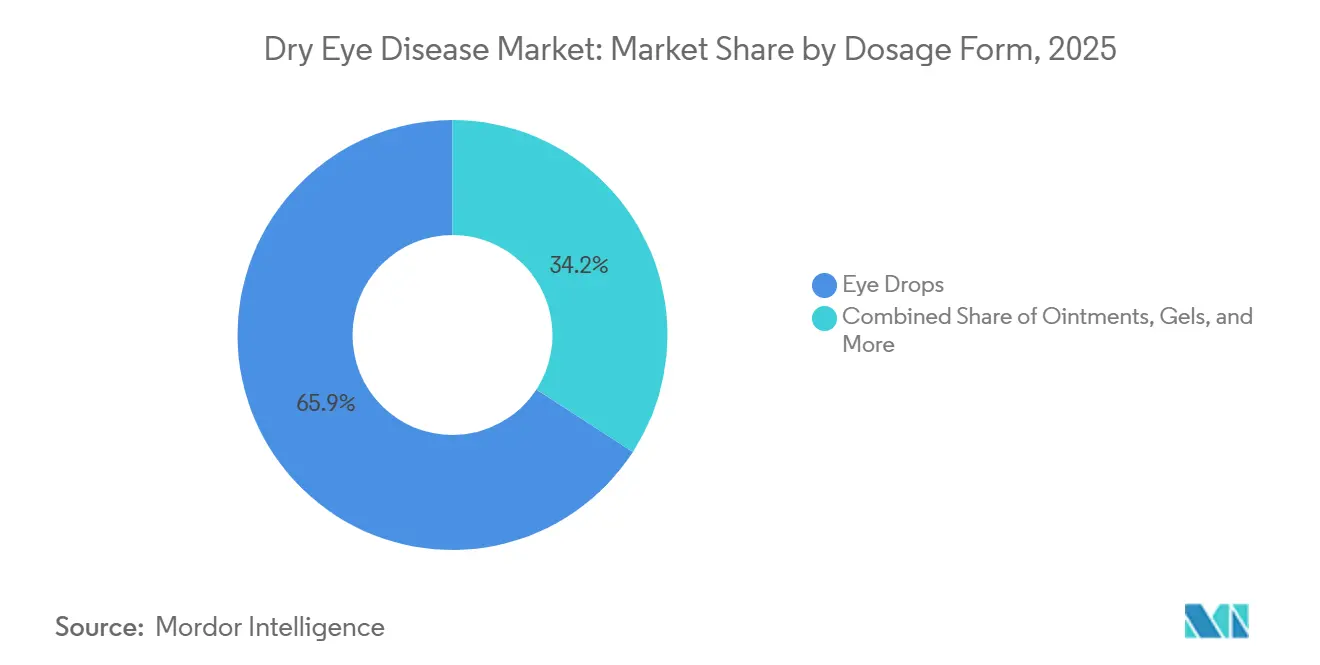
- By dosage form, eye drops accounted for 65.85% of the dry eye disease market size in 2025 and ointments are advancing at an 8.02% CAGR to 2031
- By distribution channel, hospital pharmacies captured 61.60% revenue in 2025, whereas online channels are set to post a 9.86% CAGR through 2031
- By geography, North America commanded 35.42% revenue in 2025 and Asia-Pacific is expected to register the fastest regional CAGR at 7.28% over 2026-2031
Note: Market size and forecast figures in this report are generated using Mordor Intelligence’s proprietary estimation framework, updated with the latest available data and insights as of 2026.
Global Dry Eye Disease Market Trends and Insights
Drivers Impact Analysis*
| DRIVER | (~) % IMPACT ON CAGR FORECAST | GEOGRAPHIC RELEVANCE | IMPACT TIMELINE |
|---|---|---|---|
| Rising global prevalence linked to aging and comorbidities | +3.8% | North America, Europe, Japan, South Korea | Long term (≥4 years) |
| Escalating screen-time across all age groups | +6.6% | Urban centers worldwide | Short term (≤2 years) |
| Adoption of prescription anti-inflammatory and secretagogue therapies | +2.9% | North America, Europe, Tier-1 APAC cities | Medium term (2-4 years) |
| Favorable regulatory fast-track pathways | +2.2% | United States, European Union | Medium term (2-4 years) |
| Direct-to-consumer awareness and tele-ophthalmology | +1.9% | North America, Europe, Urban APAC & LATAM | Short term (≤2 years) |
| Growing innovations in treatment options | +1.8% | Global | Long term (≥4 years) |
| Source: Mordor Intelligence | |||
Rising Global Prevalence Of Dry Eye Disease Linked To Aging And Comorbidities
The world’s 60-plus population is expected to double to 2.1 billion by 2050, expanding the at-risk cohort faster than current ophthalmic infrastructure can serve it.[1]World Health Organization, “Ageing and Health,” who.int Diabetes and autoimmune disorders compound disease burden, with Sjögren’s syndrome affecting 4 million United States adults and driving multi-modal treatment needs beyond artificial tears. Pharmaceutical companies now frame the condition as chronic inflammation rather than transient discomfort, aligning dry eye protocols with rheumatology and endocrinology pathways to secure higher reimbursement. This repositioning mirrors osteoarthritis’s evolution, in which biologics displaced NSAIDs by treating the pathophysiology rather than pain alone. As a result, prescription uptake is climbing and will continue to reinforce the trajectory of the dry eye disease market size.
Escalating Screen-Time Across All Age Groups Increasing Ocular Surface Stress
Average daily digital use among United States adults climbed to 7 hours in 2025, up from 4 hours in 2019, embedding prolonged screen exposure as a structural reality for office workers.[2]American Academy of Ophthalmology, “Digital Eye Strain Guidelines 2024,” aao.org Pediatric usage now reaches 4–6 hours per day, raising early-onset cases. Employers observe productivity losses due to digital eye strain and are trialing vision wellness benefits that subsidize preservative-free drops. Ophthalmologists recommend “20-20-20” micro-breaks along with pharmacotherapy, spurring demand for single-dose vials that command 15–20% price premiums. This behavior-driven demand engine magnifies near-term growth in the dry eye disease market.
Adoption Of Prescription Anti-inflammatory & Secretagogue Therapies Worldwide
The FDA’s May 2025 approval of Tryptyr (acoltremon) introduced the first muscarinic secretagogue, halving symptom scores within 30 minutes and validating tear-stimulation pathways.[3]U.S. FDA, “Miebo Approval,” fda.gov Together with Vevye and Miebo approvals in 2024, the prescription toolbox now spans lipid layer stabilizers, anti-inflam¬matories, and tear secretagogues. Managed-care organizations employ step-therapy protocols that shift moderate-to-severe patients to higher-cost agents after lubricant failure, a model now diffusing to wealthy Asia-Pacific cities. This transition underpins the rising value of the dry eye disease market.
Favorable Regulatory Pathways & Fast-Track Approvals For Novel Tear Modulators
Breakthrough and PRIME designations have shortened global review timelines by up to two years, elevating venture funding and de-risking early-stage development. The FDA’s 2024 guidance on patient-reported outcomes provided clearer endpoints, reducing the risk of late-stage failure. Harmonization across ICH countries allows sponsors to recycle FDA clinical packages for Japan, South Korea, and Australia, accelerating multi-regional launches and broadening dry eye disease market reach.
Restraints Impact Analysis*
| RESTRAINT | (~) % IMPACT ON CAGR FORECAST | GEOGRAPHIC RELEVANCE | IMPACT TIMELINE |
|---|---|---|---|
| Generic competition compressing cyclosporine & lubricant prices | −1.8% | North America, Europe | Short term (≤2 years) |
| Limited long-term efficacy & safety data for emerging biologics/devices | −1.2% | Global | Medium term (2-4 years) |
| Inadequate coverage & high out-of-pocket costs in developing regions | −0.9% | APAC (ex-JP/KR), LATAM, MEA | Long term (≥4 years) |
| Chronic dosing burden hindering adherence | −1.5% | Global | Medium term (2-4 years) |
| Source: Mordor Intelligence | |||
Generic Competition Compressing Prices Of Established Cyclosporine & Lubricant Brands
Wholesale acquisition costs for generic cyclosporine fell to USD 150 per 30-day supply versus USD 600 for branded Restasis, prompting mandatory substitution by payers. Private-label artificial tears now undercut leading brands by up to 50%, forcing innovators to justify premiums through preservative-free lipids or extended-release gels. The margin squeeze is most acute in the U.S. and Europe but is spreading to Asia as regulators clear local generics. Consequently, established players are redirecting R&D budgets into TRPM8 agonists and secretagogues that remain patent-protected beyond 2030.
Limited Long-Term Efficacy & Safety Data For Emerging Devices And Biologics
Pivotal trials for Miebo and Tryptyr span only 12 weeks, leaving durability uncertain beyond six months. Device-based therapies such as IPL lack standardized protocols, producing variable outcomes that unsettle insurers. Biologic agents repurposed from rheumatology raise infection and malignancy concerns in elderly patients, prompting regulators to demand larger safety databases that elevate costs and delay entry.
*Our forecasts treat driver/restraint impacts as directional, not additive. The impact forecasts reflect baseline growth, mix effects, and variable interactions.
Segment Analysis
By Type: Prescription Therapies Gain Ground
Treatment modalities accounted for 42.35% of 2025 revenue in the dry eye disease market. Prescription anti-inflammatories and secretagogues are displacing OTC lubricants as moderate-to-severe cases seek durable relief. Newly launched agents acoltremon, perfluorohexyloctane, and high-strength cyclosporine added USD 300 million in first-year sales, confirming the pull toward mechanism-based interventions. At the same time, diagnostic revenues are rising because tear osmolarity and MMP-9 assays provide objective data that justify therapy escalation.
Diagnostic uptake feeds treatment volumes. Point-of-care devices compress multi-visit workflows into single encounters, enhancing patient conversion. CPT reimbursement for osmolarity testing incentivizes optometrists to adopt these tools, broadening access outside hospital ophthalmology departments. As a result, diagnostics act as a force multiplier for prescription drug lines, bolstering overall growth in the dry eye disease market.


By Disease Type: Aqueous-Deficient Cases Accelerate
Evaporative subtypes captured 52.40% of 2025 revenue, reflecting widespread meibomian dysfunction. Nevertheless, aqueous-deficient cases are projected to have the fastest trajectory, with a 7.45% CAGR, as Sjögren’s diagnoses increase and post-LASIK cohorts age. Secretagogues such as acoltremon specifically address tear-volume deficits, creating fresh revenue streams.
Mixed-mechanism presentations are rising as clinicians deploy comprehensive diagnostics that reveal both lipid and aqueous deficiencies. Personalized combinations, pairing device-based gland treatments with secretagogues or immunomodulators, deliver superior outcomes and encourage diversified company portfolios. This nuanced approach positions multi-mechanism suppliers to capture incremental market share from single-pathway competitors in the dry eye disease market.
By Dosage Form: Ointments Gain Overnight Niche
Eye drops commanded 65.85% of revenue in 2025. Yet, ointments and gels are gaining traction with an 8.02% CAGR forecast, as their viscosity provides overnight protection when nocturnal tear flow dips. Nasal sprays and ocular inserts, while niche today, address adherence pain points and may expand once payers recognize their compliance benefits.
Single-dose preservative-free vials grow fastest inside the drop segment as chronic exposure to benzalkonium chloride damages the ocular surface. Europe’s regulatory preference for preservative-free products accelerates the import of that paradigm into North America. At the same time, sustained-release punctal plugs under investigation could compress multi-daily dosing into quarterly office visits, reshaping the calculation of the dry eye disease market size for chronic users.

By Distribution Channel: E-Commerce Disrupts Traditional Retail
Hospital and retail pharmacies control 61.60% of revenues, leveraging in-store optometrist referrals and insurance adjudication services. Nevertheless, online pharmacies exhibit the strongest momentum, advancing at a 9.86% CAGR as tele-ophthalmology workflows normalize post-pandemic. Digital platforms integrate virtual consultations, electronic prescriptions, and doorstep delivery, offering seamless patient journeys that resonate with tech-savvy demographics.
Specialty pharmacies are consolidating high-value prescription volumes by layering adherence coaching and benefits-verification services. For advanced products such as TRPM8 agonists or drug-eluting inserts, these channels manage prior authorizations and coordinate clinician feedback loops. In emerging markets, cross-border e-commerce bypasses limited local inventories, expanding access but also complicating pharmacovigilance oversight. Direct-to-consumer websites allow manufacturers to bypass pharmacy markups, as evidenced by Bausch Health’s 2024 collaboration with Blink Health. OTC lubricants see the most disruption as price-savvy buyers shift online, but prescription fulfillment is also migrating thanks to tele-ophthalmology platforms that integrate e-prescribing and home delivery. Consequently, e-commerce becomes a core pillar of growth in the dry eye disease market, especially among digitally native consumers.
Geography Analysis
North America accounted for 35.42% of 2025 revenue, driven by high diagnosis rates, generous insurance coverage, and rapid uptake of newly approved mechanisms. The United States accounts for 80% of regional turnover, propelled by Medicare Part D coverage of cyclosporine and lifitegrast and by commercial formularies that increasingly reimburse novel secretagogues. Canada’s growth is tempered by centralized purchasing but benefits from widespread awareness campaigns that encourage early diagnosis. Mexico lags due to lower per-capita spending, yet tele-ophthalmology is broadening access in urban hubs such as Monterrey and Guadalajara, sustaining steady gains in the dry eye disease market. Europe ranks second in revenue but trails in growth because price negotiations with each member state introduce launch delays and margin pressure. Germany’s statutory health funds reimburse prescription agents with limited co-pays, making it the most significant European market.
Asia-Pacific is forecast to deliver a 7.28% CAGR through 2031, the highest globally. China’s regulatory reforms narrow approval gaps with the West, enabling earlier entry of secretagogues while domestic cyclosporine generics capture price-sensitive segments. India struggles with affordability, but smartphone-based care platforms extend reach into tier-2 cities and enable bulk ordering of lubricants online. Japan and South Korea, with aging demographics and strong insurance coverage, are quickly adopting innovative treatments, providing attractive early-revenue opportunities. Australia’s PBS subsidizes prescription agents, aligning its therapeutic landscape closely with that of North America. The Middle East and Africa remain nascent, though the United Arab Emirates and Saudi Arabia witness rising demand from air-conditioned urban lifestyles

Competitive Landscape
The dry eye disease market is fragmented, with established players such as Alcon, Bausch Health, and AbbVie (Allergan). The incumbents are amplifying R&D by absorbing smaller innovators; Alcon’s integration of Aerie’s pipeline exemplifies this strategy. Portfolio breadth enables cross-promotion between lubricant brands and prescription entries, sustaining visibility across treatment stages.
Specialty pharmaceutical challengers are injecting competitive tension by targeting single molecular pathways with high-potency candidates. Start-ups advancing mitochondrial modulators and neurostimulatory peptides compete for niche segments such as recalcitrant evaporative disease. Licensing deals and regional co-marketing agreements provide capital-efficient market entry; for instance, JIXING’s distribution alliance for varenicline nasal spray expands access to the Greater China patient base.
Device manufacturers further diversify the landscape. Thermal pulsation systems, fractional micro-plasma devices, and intense pulsed-light platforms broaden therapeutic options beyond pharmacology. Cross-category competition is intensifying as pharmaceutical firms co-market with device makers to deliver bundled care pathways, aligning with clinician preferences for multimodal management. Digital health add-ons, including adherence dashboards and AI-enabled symptom trackers, are emerging as differentiators in contract negotiations with payer networks.
Dry Eye Disease Industry Leaders
Santen Pharmaceutical Co. Ltd
Alcon Inc.
AbbVie Inc. (Allergan)
Bausch Health Companies Inc.
OASIS Medical Inc.
- *Disclaimer: Major Players sorted in no particular order

Recent Industry Developments
- February 2026: Nordic Pharma launched Lacrifill, a novel dry eye therapy, across the European Union.
- December 2025: The FDA postponed the reproxalap PDUFA date to Mar 16 2026, extending Aldeyra’s review window.
- May 2025: The FDA approved Tryptyr (acoltremon ophthalmic solution), the first muscarinic secretagogue for dry eye disease.
- May 2025: Aldeyra Therapeutics reported that its phase 3 reproxalap study met the primary endpoint, bolstering plans to resubmit its new drug application to the FDA.


Research Methodology Framework and Report Scope
Market Definitions and Key Coverage
Our study defines the dry eye disease market as the global sales value of prescription and over-the-counter medicines, artificial-tear lubricants, punctal plugs, nutraceutical tear substitutes, and autologous serum therapies that restore tear-film stability and calm ocular-surface inflammation. Mordor Intelligence sizes the market at USD 6.36 billion for 2025.
Scope Exclusion: Stand-alone diagnostic devices, heat or light treatment equipment, and refractive surgical procedures are excluded from this valuation.
Segmentation Overview
- By Type
- Treatment
- Artificial Tears
- Prescription Drugs
- Anti-inflammatory
- Secretagogues
- Other Prescription Therapies
- Punctal Plugs
- Others
- Diagnostic Test
- Schirmers Test
- Corneal Staining
- Tear Break-up Time (TBUT)
- Optical Coherence Tomography (OCT)
- Tear Film Stability Analysis
- Tear Osmolarity
- Others
- Treatment
- By Disease Type
- Evaporative Dry Eye
- Aqueous-deficient Dry Eye
- Mixed Mechanism
- By Dosage Form
- Eye Drops (Multi-dose & Single-dose PF)
- Ointments & Gels
- Ophthalmic Inserts & Nasal Sprays
- By Distribution Channel
- Hospital Pharmacies
- Independent Pharmacies & Drug Stores
- Online Pharmacies & E-commerce Portals
- By Geography
- North America
- United States
- Canada
- Mexico
- Europe
- Germany
- United Kingdom
- France
- Italy
- Spain
- Rest of Europe
- Asia-Pacific
- China
- India
- Japan
- Australia
- South Korea
- Rest of Asia-Pacific
- Middle East and Africa
- GCC
- South Africa
- Rest of Middle East and Africa
- South America
- Brazil
- Argentina
- Rest of South America
- North America
Detailed Research Methodology and Data Validation
Primary Research
Expert interviews and short surveys with ophthalmologists, retail pharmacists, hospital procurement leads, and patient-advocacy representatives across North America, Europe, and Asia-Pacific helped us verify uptake rates, capture real-world discounts, and close data gaps before locking the model.
Desk Research
We began by mapping disease prevalence, treated-patient volumes, and average retail prices through open datasets such as the National Eye Institute, World Health Organization Global Health Observatory, Eurostat prescription audits, and UN Comtrade shipment data. Regulatory dashboards from the US FDA and the European Medicines Agency clarified product launch timelines and label expansions. Company 10-Ks, investor presentations, and news archives on Dow Jones Factiva enriched price and channel checks, while Tear Film & Ocular Surface Society consensus papers and PubMed studies grounded clinical assumptions. The list is illustrative; many additional sources informed data collection and validation.
Market-Sizing & Forecasting
A prevalence-to-treated cohort top-down build provides the core view. Regional patient pools are adjusted for diagnosis and therapy adoption, then monetized through weighted average selling prices. Supplier roll-ups and sampled invoice checks act as a bottom-up reasonableness test. Key variables include smartphone screen time, 65-plus population growth, meibomian gland dysfunction prevalence, prescription refill frequency, and real price erosion. Forecasts rely on multivariate regression with scenario overlays for new approvals and reimbursement shifts.
Data Validation & Update Cycle
Mordor analysts run variance scans against independent sales audits, revisit outliers with experts, and escalate any swing above five percent for senior review. Reports refresh every year, with interim tweaks when material events occur, ensuring buyers receive a live baseline.
Why Mordor's Dry Eye Disease Baseline Is Dependable
Published estimates often differ because firms pick wider therapy baskets, apply single-point currency conversions, or refresh on longer cycles. Our disciplined scope and annual updates hold values close to what payers and suppliers actually transact.
External reports quote USD 6.70 billion for 2025, USD 7.49 billion for 2024, and USD 7.33 billion for 2024, figures that include device revenues, aggressive unit growth, or combined supplement sales and therefore sit above our carefully bounded total.
Benchmark comparison
| Market Size | Anonymized source | Primary gap driver |
|---|---|---|
| USD 6.36 B | Mordor Intelligence | - |
| USD 6.70 B | Regional Consultancy A | Adds IPL and thermal devices to drug pool |
| USD 7.49 B | Global Consultancy B | Uses constant seven-percent price inflation and wider OTC supplement capture |
| USD 7.33 B | Industry Association C | Combines drugs with nutraceutical revenue and lacks currency normalization |
These contrasts show that Mordor's transparent variables, repeatable steps, and tight scope deliver a balanced baseline that decision-makers can trust.


Key Questions Answered in the Report
What is the current valuation of the dry eye disease market?
The dry eye disease market size reached USD 6.61 billion in 2026 and is projected to climb to USD 8.03 billion by 2031.
How fast is the dry eye disease market expected to grow?
Between 2026 and 2031 the market is forecast to expand at a 19.59% CAGR, driven by aging demographics, higher screen time, and new prescription therapies.
Which treatment category holds the largest market share?
Prescription therapies accounted for 42.35% revenue in 2025, leading all treatment modalities.
Which region is the fastest-growing for dry eye therapies?
Asia-Pacific is expected to log the quickest pace, advancing at roughly 7.28% CAGR through 2031.
How are online channels impacting product distribution?
E-commerce pharmacies are projected to post a 9.86% CAGR to 2031, eroding hospital pharmacy dominance by offering price transparency and mail delivery.
What is the biggest challenge to long-term therapy success?
Adherence remains critical; only 48% of patients stay compliant with twice-daily dosing at six months, underscoring the need for extended-release solutions.
Page last updated on:


