Aluminum Ingots Market Size and Share
Market Overview
| Study Period | 2021 - 2031 |
|---|---|
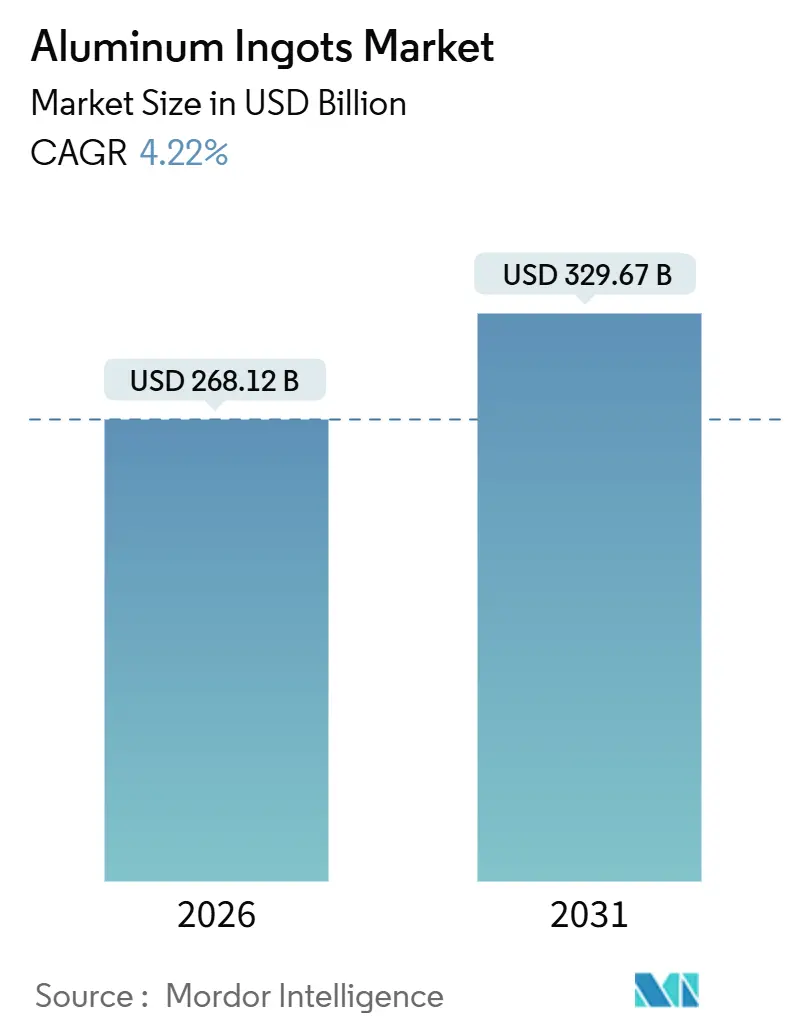
| Market Size (2026) | USD 268.12 Billion |
| Market Size (2031) | USD 329.67 Billion |
| Growth Rate (2026 - 2031) | 4.22% CAGR |
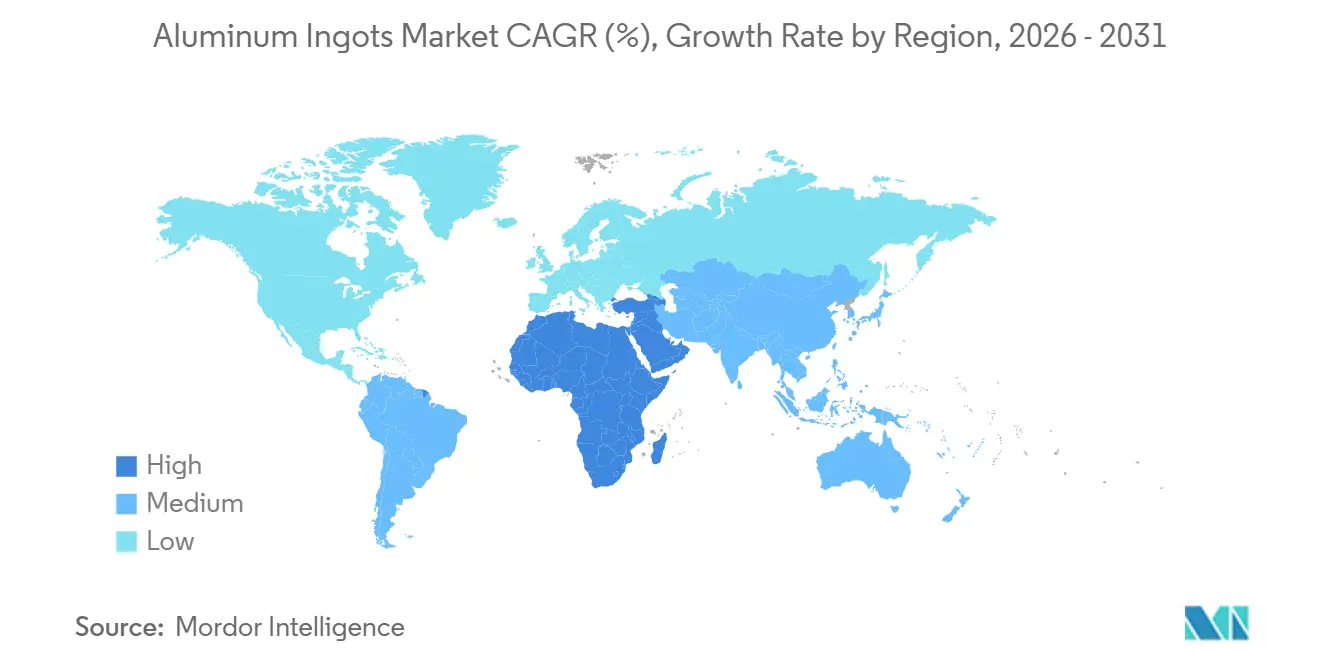
| Fastest Growing Market | Middle East and Africa |
| Largest Market | Asia-Pacific |
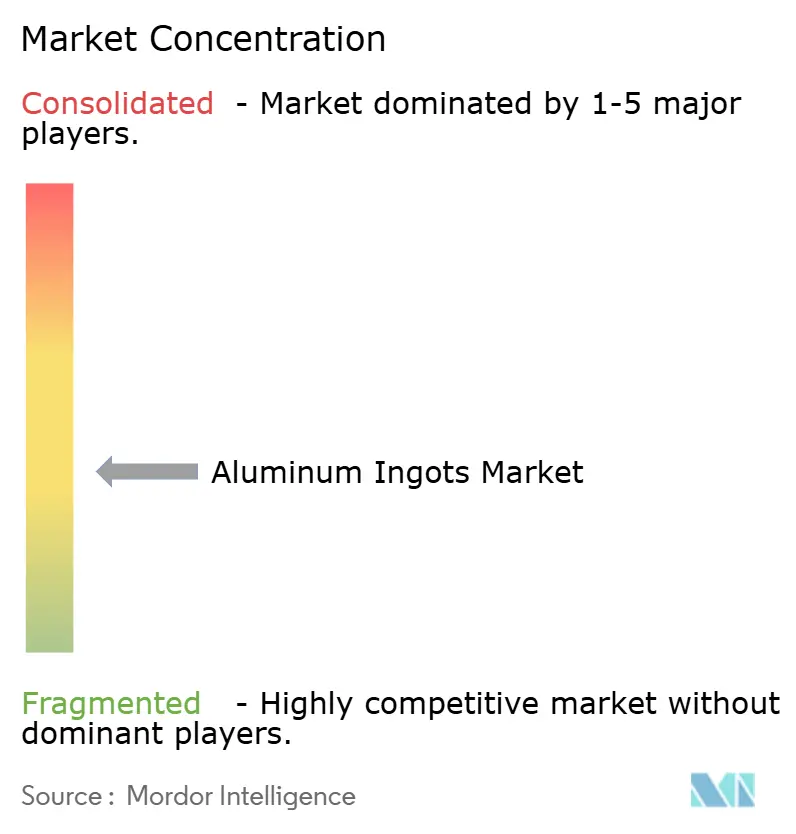
| Market Concentration | Medium |
Major Players *Disclaimer: Major Players sorted in no particular order Image © Mordor Intelligence. Reuse requires attribution under CC BY 4.0. | |
Aluminum Ingots Market Analysis by Mordor Intelligence
The Aluminum Ingots Market size is estimated at USD 268.12 billion in 2026, and is expected to reach USD 329.67 billion by 2031, at a CAGR of 4.22% during the forecast period (2026-2031). Capacity shifts are reshaping cost curves, because secondary ingots now grow faster than primary metal as automakers close scrap loops to meet Scope 3 goals. Border-carbon rules in the European Union, the United Kingdom, and Canada reward low-emission supply, steering premiums toward smelters that use hydropower or inert-anode cells. Asia-Pacific remains the volume anchor, but Middle East and Africa record the quickest gains on the back of subsidized gas and proximity to Indian fabricators. Over the forecast period, liquid-metal logistics in China, modular building demand in emerging economies, and steady aerospace build-rates stabilize the aluminum ingots market even when spot power prices spike.
Key Report Takeaways
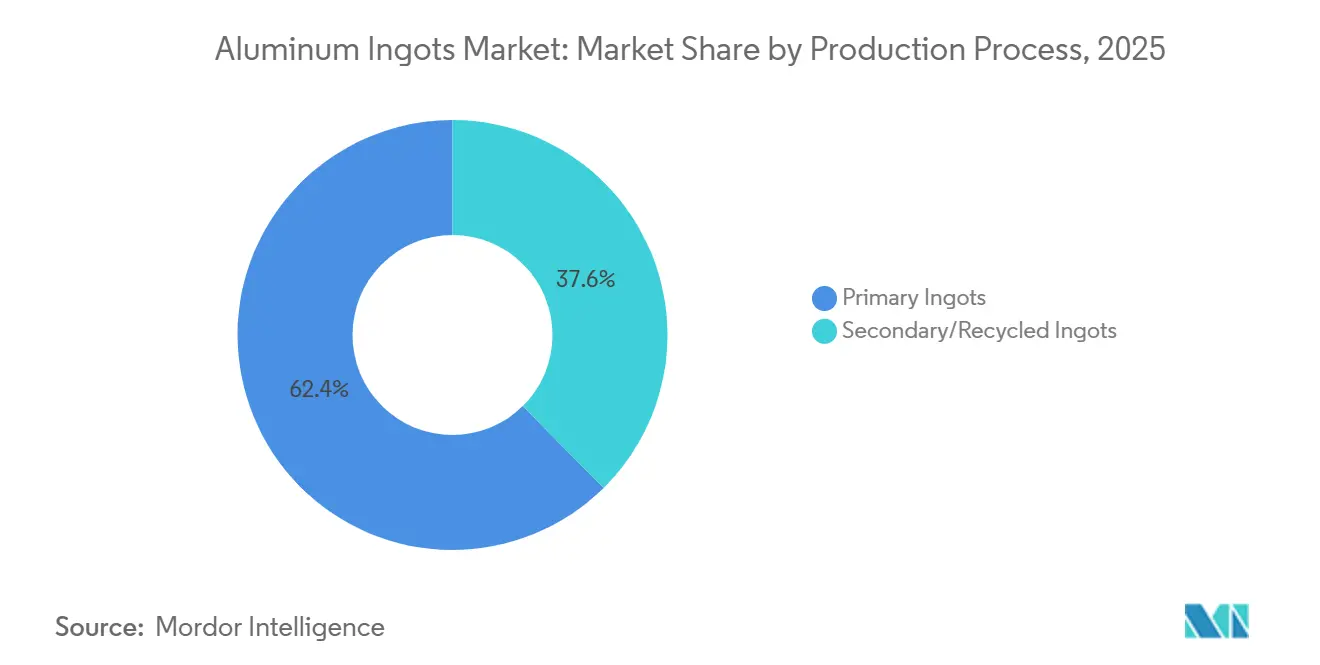
- By production process, primary ingots held 62.41% of the aluminum ingots market share in 2025, while secondary ingots are expanding at a 5.32% CAGR through 2031.
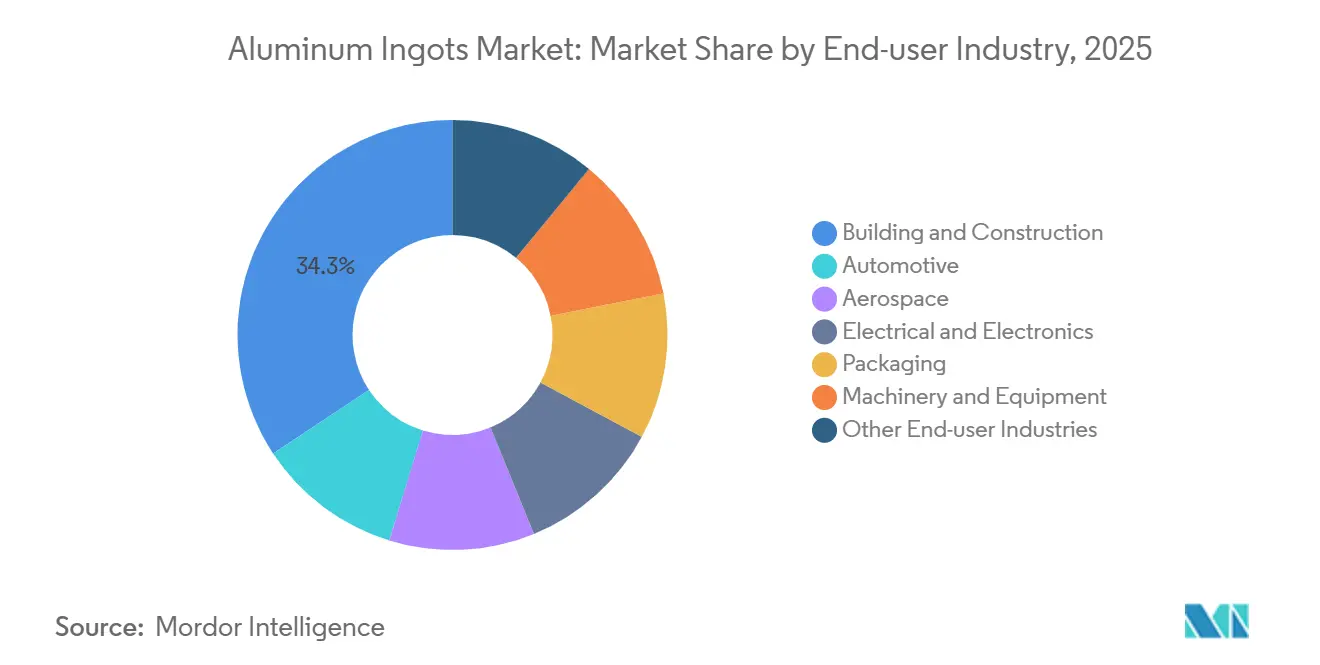
- By end-user industry, building and construction led with 34.28% revenue share in 2025; automotive is forecast to advance at a 5.18% CAGR to 2031.
- By geography, Asia-Pacific commanded 53.46% of 2025 demand and Middle East and Africa are set to grow at a 4.97% CAGR to 2031.
Note: Market size and forecast figures in this report are generated using Mordor Intelligence’s proprietary estimation framework, updated with the latest available data and insights as of January 2026.
Global Aluminum Ingots Market Trends and Insights
Drivers Impact Analysis*
| Driver | (~) % Impact on CAGR Forecast | Geographic Relevance | Impact Timeline |
|---|---|---|---|
| Surging Construction Activities in Emerging Economies | +1.2% | APAC core (China, India, ASEAN), spill-over to MEA | Medium term (2-4 years) |
| Lightweighting Demand in Automotive and EVs | +1.5% | Global, with concentration in North America, EU, China | Long term (≥4 years) |
| Decarbonization Push and Recyclability Advantage | +0.9% | EU, North America, early adopters in APAC | Long term (≥4 years) |
| Shift Toward Liquid-Metal Supply Chains in China | +0.4% | China, regional spill-over to ASEAN | Short term (≤2 years) |
| Inert-Anode and Low-Carbon Smelting Premiumisation | +0.6% | Global, led by EU and North America regulatory frameworks | Long term (≥4 years) |
| Source: Mordor Intelligence | |||
Surging Construction Activities in Emerging Economies
Public infrastructure drives a large share of near-term volume in the aluminum ingots market. India’s National Infrastructure Pipeline committed USD 1.4 trillion through 2025, with roughly 30% routed to aluminum-heavy rail and power projects[1]Ministry of Statistics and Programme Implementation, Government of India, “National Infrastructure Pipeline,” india.gov.in . China’s 66% urbanization rate in 2025 keeps curtain-wall and roofing demand high, particularly in coastal provinces where corrosion resistance is critical. Vietnam and Indonesia replicate this pattern, as per-capita aluminum use in Vietnam rose to 5.1 kilograms in 2025. Growth in prefabricated modules tightens dimensional tolerances, rewarding smelters that integrate casting and extrusion at a single site. These shifts underpin sustained, mid-single-digit gains in the aluminum ingots market.
Lightweighting Demand in Automotive and EVs
Battery-electric vehicles use 20-30% more aluminum than internal-combustion cars, largely in enclosures and crash structures. Average aluminum content per North American light vehicle hit 220 kilograms in 2025 and should climb toward 250 kilograms by 2030. Closed-loop scrap systems—such as programs operated by Novelis—return stamping offcuts to the same mill within 60 days, preserving alloy chemistry and cutting virgin demand. High-silicon castings from EV battery boxes posed recycling hurdles, yet new solid-state separation solves embrittlement risks, widening secondary-ingot adoption. The result is a durable pull on the aluminum ingots market, with mobility brands seeking verified low-carbon metal to keep fleet emissions below tightening regulatory caps.
Decarbonization Push and Recyclability Advantage
Secondary aluminum consumes just 5% of the energy needed for primary metal, positioning it well as jurisdictions embed carbon costs. The EU’s Carbon Border Adjustment Mechanism assigns a default 10.6-tonne CO₂ factor to unverified ingots, adding certificate costs near EUR 954 per tonne at a EUR 90 carbon price. Canada and the United Kingdom have signaled similar frameworks for 2027-2028. Producers in Quebec, Norway, and Iceland already hedge with footprints below 4 tonnes CO₂ per tonne and earn USD 200-300 premiums from buyers needing Scope 3 relief. The aluminum ingots market therefore polarizes: low-carbon smelters thrive, while coal-based plants cede share unless they decarbonize grids or ramp recycling.
Shift Toward Liquid-Metal Supply Chains in China
China targets 90% liquid-metal transport by 2025 to avoid remelting losses of 300-400 kWh per tonne. Pilot rail links move molten aluminum in insulated ladles directly to fabricators within 48 hours, saving energy and trimming oxidation losses. Clustering smelters and casters inside 500 kilometers makes the model viable. India and Gulf producers now study similar routes for high-volume extrusions. This operational reset splits the aluminum ingots market between commodity solid ingots for export and contracted liquid flows that slash working capital for domestic users.
Restraints Impact Analysis*
| Restraint | (~) % Impact on CAGR Forecast | Geographic Relevance | Impact Timeline |
|---|---|---|---|
| Raw-Material and Power-Price Volatility | -0.8% | Global, acute in Europe and regions with deregulated energy markets | Short term (≤2 years) |
| Carbon-Border Adjustments and Stricter ESG Audits | -0.5% | EU, North America, spillover to export-oriented APAC producers | Medium term (2-4 years) |
| Hydropower-Related Water-Scarcity Curbs | -0.3% | China (Yunnan, Sichuan), Norway, Brazil, parts of Canada | Short term (≤2 years) |
| Source: Mordor Intelligence | |||
Raw-Material and Power-Price Volatility
Smelting uses 13-15 MWh of electricity per tonne, meaning power swings can wipe out margins overnight. European capacity contracted by over 1 million tonnes in 2025 as gas prices surged past EUR 100 per MWh, despite London Metal Exchange prices near USD 2,500. Alumina costs also jumped when supply disruptions in Guinea pushed FOB Australia quotes beyond USD 450 per tonne. Only vertically integrated majors with captive refineries and hydropower contracts stayed profitable. Financing new smelters grows harder when off-take lenders demand power deals longer than five years. This volatility subtracts 0.8 percentage points from the forecast CAGR for the aluminum ingots market.
Carbon-Border Adjustments and Stricter ESG Audits
Exporters to the EU must present ISO-14064 verified Scope 1 and Scope 2 data starting 2026. Default factors above 10 tonnes CO₂ per tonne of aluminum trigger certificate costs topping EUR 1,000, shutting high-carbon plants out of the market. The United Kingdom and Canada roll out parallel rules in 2027 and 2028. Chinese coal-powered smelters face a choice: decarbonize or pivot output to non-regulated markets. Auto and aerospace buyers layer on EcoVadis and Sustainalytics audits that reach beyond emissions into water and labor practices, raising compliance budgets. Smaller smelters struggle to absorb these costs, leading to gradual consolidation within the aluminum ingots market.
*Our forecasts treat driver/restraint impacts as directional, not additive. The impact forecasts reflect baseline growth, mix effects, and variable interactions.
Segment Analysis
By Production Process: Recycling Narrows the Gap
Secondary ingots expanded at a 5.32% CAGR through 2031, eroding primary dominance that stood at 62.41% in 2025. Higher end-of-life vehicle scrappage in North America returned 15 million cars in 2025, each with 180 kilograms of aluminum. Closed-loop systems let Novelis turn stamping scrap back into auto-grade sheet within 60 days, strengthening supply security. Solid-state sorting now delivers secondary ingots that meet ASTM B209 tolerances once exclusive to primary metal.
Primary smelters defend share by branding low-carbon offerings such as Norsk Hydro’s Reduxa or Rio Tinto’s RenewAl, each promising footprints below 4 tonnes CO₂ per tonne. These products earn premiums of USD 150-250 in Europe, limiting substitution where purity matters. Beverage-can makers call for 90% recycled content by 2030, yet collection plateaus at 49% in the United States. That scrap deficit lifts secondary premiums, narrowing the cost gap and keeping both routes vital within the aluminum ingots market.


By End-user Industry: Automotive Overtakes Traditional Demand
Building and construction held 34.28% of 2025 volume, but automotive volumes climb fastest at 5.18% CAGR. EU fleet compliance fines of EUR 95 per gram of excess CO₂ pressure makers to lighten vehicles. Ford’s F-150 Lightning saves 320 kilograms using an all-aluminum body, extending driving range and cutting battery size. Tesla’s single casting for the Model Y battery enclosure removes 370 fasteners, lowering assembly time by 30%. Aerospace consumes low ingot volume but remains margin-rich, as Boeing and Airbus ramp production to 480 and 735 planes in 2025 respectively.
Electrical applications benefit from India’s plan for 500 GW of renewables by 2030, requiring 2 million kilometers of aluminum conductor. Packaging gains from single-use plastic bans, as cans and foil replace polymer films. Such diverse pulls let the aluminum ingots market weather sector cycles, because weakness in construction can be offset by strength in mobility and packaging.
Geography Analysis
Asia-Pacific accounted for 53.46% of global demand in 2025, anchored by China’s 38 million-tonne appetite and India’s 4.2 million tonnes. Chinese coastal buyers increasingly import low-carbon metal from the Middle East, while inland smelters rely on domestic coal power for construction grade ingots. Japan and South Korea, lacking local smelting, excel at alloy-specific scrap segregation that feeds electronics brands[2]Japan Aluminium Association, “Scrap Segregation Technology Overview,” jaa.or.jp . ASEAN nations import ingots yet re-export finished extrusions; Vietnam doubled per-capita consumption to 5.1 kilograms by 2025 and expects double-digit growth through 2028.
Secondary ingots supplied 48% of U.S. needs in 2025 as the Inflation Reduction Act incentivizes local sourcing. Alcoa restarted its Warrick smelter and Century Aluminum reopened Hawesville, adding over 500,000 tonnes of capacity. Mexico’s consumption rose in 2025, led by auto assembly clusters in Guanajuato and Nuevo León.
Europe made up moderate demand in 2025, yet domestic smelting shrank 18% since 2022 on energy price spikes. Imports now satisfy 60% of primary needs, mostly low-carbon metal from Norway and Iceland to meet CBAM rules. Norsk Hydro’s 1.3 million-tonne hydropower capacity keeps regional supply stable. The United Kingdom consumed 800,000 tonnes, weighted toward aerospace and luxury vehicles.
South America and Middle East and Africa are the fastest growers. Brazil's consumption is supported by hydropower-backed smelters in Pará. The UAE operates 2.7 million-tonnes at Al Taweelah, while Saudi Arabia’s Ma’aden plans a 1.2 million-tonne line by 2027. Africa’s demand, concentrated in South Africa and Egypt, climbs substantially as infrastructure projects and nascent auto assembly absorb metal, yet the continent remains a net importer due to scarce refining.

Competitive Landscape
The aluminum ingots market is moderately concentrated; the top ten producers control 55% of primary capacity, but none exceeds 12%. China Hongqiao, Chalco, RUSAL, Rio Tinto, Norsk Hydro dominate volume. Three strategic themes define competition. First is vertical integration: Rio Tinto’s Amrun bauxite mine and Hindalco’s Utkal alumina expansion secure feedstock. Second is low-carbon differentiation: the ELYSIS inert-anode project, Hydro’s Reduxa line, and EGA’s CelestiAL brand win premiums from OEMs that track Scope 3 emissions. Third is geographic diversification toward cheap, stable power: EGA’s Guinea bauxite export hub and Ma’aden’s Ras-Al-Khair smelter tap subsidized gas and renewable projects.
Recycling partnerships represent another moat. Novelis supplies Ford and BMW with closed-loop scrap flows, granting both alloy certainty and carbon transparency. Technology disruptors license solid-state sorting that keeps alloy chemistry intact, letting medium-sized recyclers match primary purity. Digital scrap platforms cut procurement costs, eroding the advantage of large brokers. Automation also matters: Rio Tinto patented an AI cell-control system that trims power use by 3-5%, lifting current efficiency. Smelters unable to certify ISO 14064 emissions or ISO 14067 product footprints increasingly lose bids to ESG-focused buyers, accelerating consolidation inside the aluminum ingots market.
Aluminum Ingots Industry Leaders
China Hongqiao Group Ltd.
Aluminum Corporation of China Ltd. (Chalco)
RusAL
Rio Tinto
Norsk Hydro ASA
- *Disclaimer: Major Players sorted in no particular order

Recent Industry Developments
- June 2025: NALCO India introduced the IA90 grade aluminium alloy ingot. This product was developed to meet the evolving demands of the automobile industry.
- June 2024: Guinea finalized an alumina refinery agreement with Emirates Global Aluminium's subsidiary. The agreement aimed to strengthen the aluminium ingot supply chain by ensuring consistent alumina production.


Global Aluminum Ingots Market Report Scope
Aluminum ingots are produced using molds and molten aluminum. These are non-ferrous metals. These ingots can be made in various dimensions and have a broad application scope in industrial utilities.
The aluminium ingots market is segmented by production process, end-user industry, and geography. By production process, the market is segmented into primary ingots and secondary/recycled ingots. By end-user industry, the market is segmented into building and construction, automotive, aerospace, electrical and electronics, packaging, machinery and equipment, and other end-user industries. The report also covers the market size and forecasts for the aluminium ingots in 16 countries across major regions. For each segment, the market sizing and forecasts have been done on the basis of value (USD).
| Primary Ingots |
| Secondary/Recycled Ingots |
| Building and Construction |
| Automotive |
| Aerospace |
| Electrical and Electronics |
| Packaging |
| Machinery and Equipment |
| Other End-user Industries |
| Asia-Pacific | China |
| India | |
| Japan | |
| South Korea | |
| ASEAN Countries | |
| Rest of Asia-Pacific | |
| North America | United States |
| Canada | |
| Mexico | |
| Europe | Germany |
| United Kingdom | |
| Italy | |
| France | |
| Spain | |
| NORDIC Countries | |
| Rest of Europe | |
| South America | Brazil |
| Argentina | |
| Rest of South America | |
| Middle-East and Africa | Saudi Arabia |
| South Africa | |
| Rest of Middle-East and Africa |
| By Production Process | Primary Ingots | |
| Secondary/Recycled Ingots | ||
| By End-user Industry | Building and Construction | |
| Automotive | ||
| Aerospace | ||
| Electrical and Electronics | ||
| Packaging | ||
| Machinery and Equipment | ||
| Other End-user Industries | ||
| By Geography | Asia-Pacific | China |
| India | ||
| Japan | ||
| South Korea | ||
| ASEAN Countries | ||
| Rest of Asia-Pacific | ||
| North America | United States | |
| Canada | ||
| Mexico | ||
| Europe | Germany | |
| United Kingdom | ||
| Italy | ||
| France | ||
| Spain | ||
| NORDIC Countries | ||
| Rest of Europe | ||
| South America | Brazil | |
| Argentina | ||
| Rest of South America | ||
| Middle-East and Africa | Saudi Arabia | |
| South Africa | ||
| Rest of Middle-East and Africa | ||


Key Questions Answered in the Report
What is the forecast revenue for the aluminum ingots market in 2031?
Revenue is expected to reach USD 329.67 billion by 2031, reflecting a 4.22% CAGR over 2026-2031.
Which production process leads volume in the aluminum ingots market?
Primary ingots led with 62.41% volume share in 2025, though secondary ingots are growing faster at 5.32% CAGR.
Why are automakers increasing aluminum demand?
Battery-electric vehicles need 20-30% more aluminum than conventional cars for lighter enclosures and crash structures, lifting automotive CAGR to 5.18% through 2031.
How do carbon-border rules affect aluminum trade?
The EU’s CBAM imposes certificate costs of about EUR 954 per tonne on high-carbon ingots, steering buyers toward low-emission suppliers.
Page last updated on:


