
Market Overview
| Study Period | 2020 - 2031 |
|---|---|
| Market Size (2026) | USD 73.22 Billion |
| Market Size (2031) | USD 93.12 Billion |
| Growth Rate (2026 - 2031) | 4.92 % |
| Fastest Growing Market | Asia Pacific |
| Largest Market | North America |
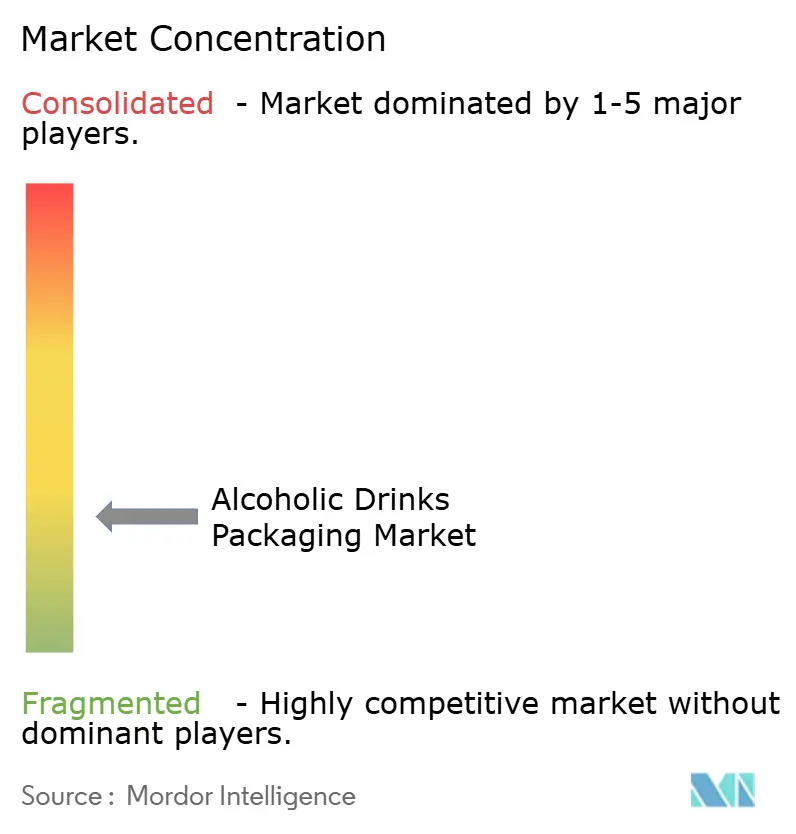
| Market Concentration | Low |
Major Players *Disclaimer: Major Players sorted in no particular order Image © Mordor Intelligence. Reuse requires attribution under CC BY 4.0. | |
Alcoholic Drinks Packaging Market Analysis by Mordor Intelligence
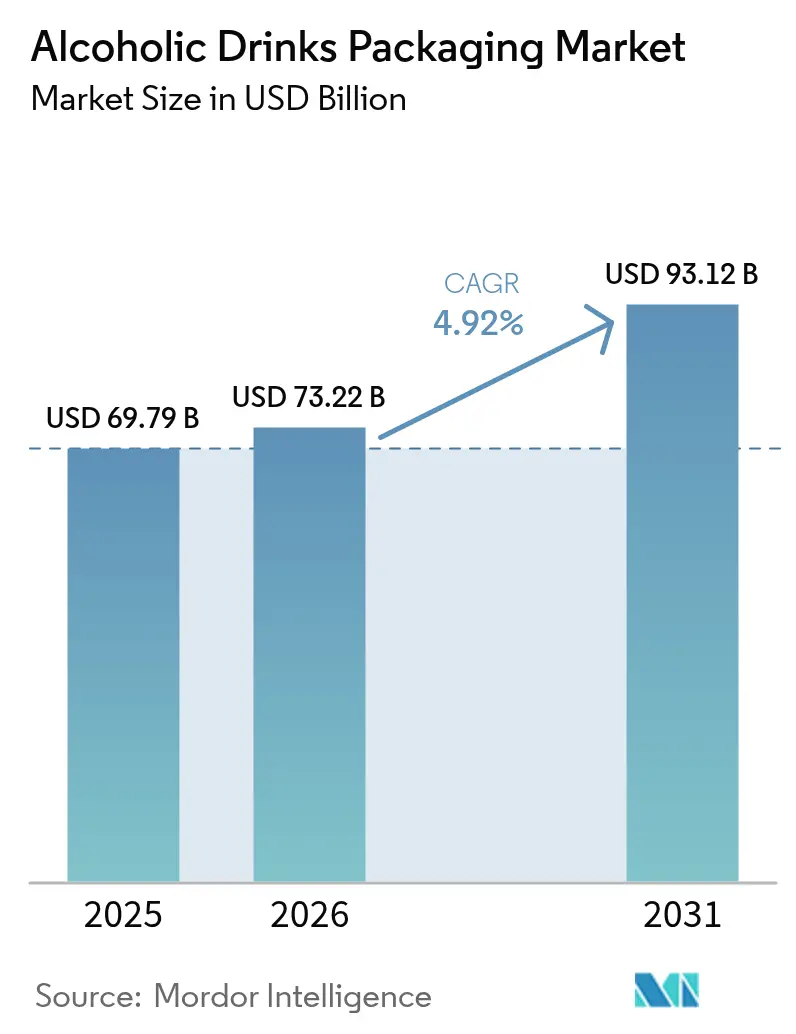
The alcoholic drinks packaging market size in 2026 is estimated at USD 73.22 billion, growing from 2025 value of USD 69.79 billion with 2031 projections showing USD 93.12 billion, growing at 4.92% CAGR over 2026-2031. Escalating middle-class spending in the Asia-Pacific region, mounting sustainability mandates, and the premiumization of craft spirits and wines are supporting this upward trend. Glass continues to anchor high-value categories, yet aluminum cans are gaining ground as brewers and distillers favor lightweight, recyclable formats. Innovation is shifting in-house, with digital can-printing platforms shortening lead times and enabling limited runs that fuel seasonal marketing. Meanwhile, closed-loop refill solutions are proving that circular models can trim packaging waste by as much as 85% and simultaneously lower logistics costs.
Key Report Takeaways
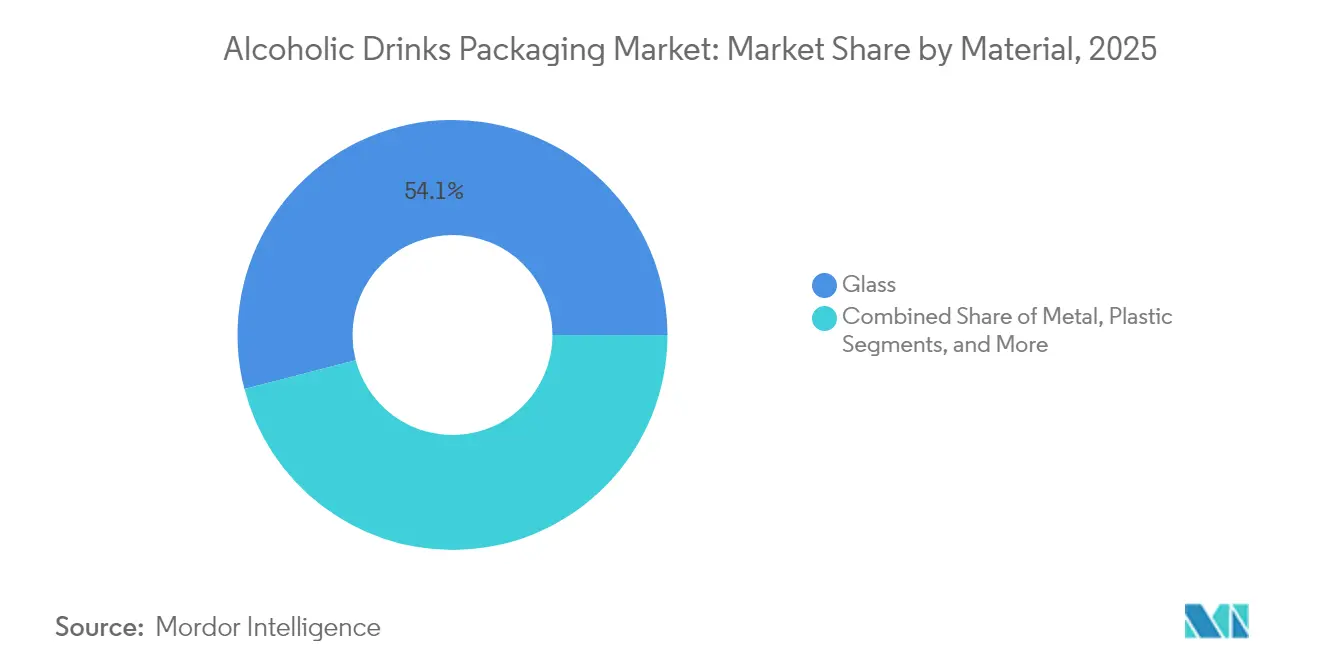
- By material, glass led the alcoholic drinks market with 54.05% of the market share in 2025, while metal packaging is forecast to expand at a 6.35% CAGR through 2031.
- By package type, bottles captured 58.20% share of the alcoholic drinks market size in 2025; metal cans are projected to grow at a 7.05% CAGR to 2031.
- By product segment, beer accounted for 41.20% of the revenue in 2025, whereas spirits are expected to register a 7.45% CAGR through 2031.
- By distribution channel, off-trade outlets held a 61.85% share in 2025, and duty-free sales are set to rise at a 6.4% CAGR to 2031.
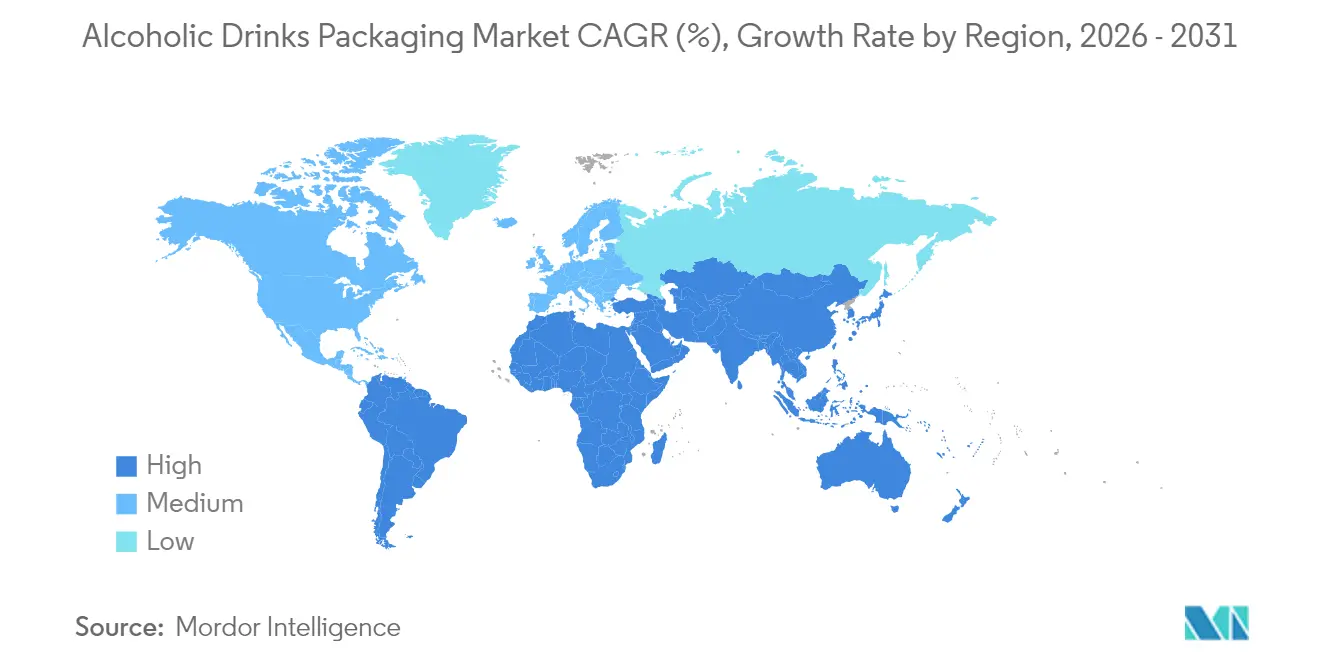
- By geography, North America commanded a 39.10% share in 2025, but Asia-Pacific is projected to advance at an 7.95% CAGR during 2026-2031.
Note: Market size and forecast figures in this report are generated using Mordor Intelligence’s proprietary estimation framework, updated with the latest available data and insights as of 2026.
Global Alcoholic Drinks Packaging Market Trends and Insights
Drivers Impact Analysis*
| Driver | (~) % Impact on CAGR Forecast | Geographic Relevance | Impact Timeline |
|---|---|---|---|
| Rising Disposable Income in Developing Countries | +0.8% | Asia-Pacific, Latin America, Middle East | Medium term (2-4 years) |
| Growing Demand for Sustainable and Eco-Friendly Packaging | +1.2% | Global, early adoption in Europe and North America | Long term (≥ 4 years) |
| Premiumization of Alcoholic Drinks Fuelling High-End Containers | +1.0% | North America, Europe, Asia-Pacific urban centers | Medium term (2-4 years) |
| Rapid Expansion of Ready-To-Drink Alcoholic Beverages | +1.1% | Global, led by North America and Asia-Pacific | Short term (≤ 2 years) |
| Breweries’ Shift to In-House Digital Can Printing Platforms | +0.5% | North America, Europe | Medium term (2-4 years) |
| Adoption of Refillable Spirits Totes in High-Duty Markets | +0.4% | Europe and Asia-Pacific | Long term (≥ 4 years) |
| Source: Mordor Intelligence | |||
Growing Demand for Sustainable and Eco-Friendly Packaging
Extended producer responsibility schemes now cover more than 60% of European beverage sales and are spurring faster collection of glass cullet.[1]European Commission, “Packaging and Packaging Waste Regulation 2024/1234,” ec.europa.euDiageo invested GBP 16 million (USD 20.3 million) in 2024 to commercialize a paper-based spirits bottle, targeting 100 million units by 2030.[2]Diageo, “Annual Report 2024,” diageo.com Bacardi partnered with Encirc on a hydrogen-fueled furnace that lowers glass-production emissions by 90% per ton. EcoSpirits’ tote system, already active in 15 markets, eliminates single-use glass and trims waste by 85% per liter. Pernod Ricard reported a 23% uptick in recycled-content glass use in 2025, secured through long-term cullet contracts. These moves demonstrate how environmental compliance is now closely tied to branding and cost efficiency.
Rapid Expansion of Ready-To-Drink Alcoholic Beverages
RTD cocktails outpaced every other category with 18% growth in 2024. Aluminum cans captured a 92% market share thanks to their portability and 12-month shelf life.[3]IWSR Drinks Market Analysis, “Ready-to-Drink Cocktails 2024,” theiwsr.comAluminum cans captured a 92% market share thanks to their portability and 12-month shelf life. Diageo’s Captain Morgan RTD line adopted digitally printed 330 milliliter sleek cans, cutting set-up costs by 40% and enabling runs as small as 10,000 units. A similar momentum is visible in Japan and South Korea, where Suntory and Lotte Chilsung have launched canned highballs and soju drinks tailored to local tastes. Regulatory attention remains focused on food-contact linings and ingredient disclosures, but compliance is manageable given the category’s relatively narrow margins.
Premiumization of Alcoholic Drinks Fuelling High-End Containers
Luxury spirits rely on bespoke packaging to uphold retail premiums of USD 2-USD 8 per unit. Rémy Cointreau’s Louis XIII decanter costs increased by 15% in 2024 due to the use of hand-blown crystal and serialized closures. Single-malt exports grew 9% in the same year, with intricate bottles accounting for 68% of the value gain. Craft distillers are following suit by adopting tactile finishes and certified cork closures that reinforce their heritage positioning. Premium wine houses now use lighter glass, 500 grams trimmed to 350 grams, helping them meet carbon targets while sustaining upscale cues
Rising Disposable Income in Developing Countries
India’s household consumption expenditure rose 7.2% in 2024, lifting urban alcohol spending by 11%. China’s per-capita disposable income increased 6.1%, fueling demand for imported premium wine. Brazil’s beverage market expanded 5.8% in volume as consumers traded bulk for branded single-serve options. Suppliers responded with capacity; Ball opened a plant in Madhya Pradesh capable of 1.2 billion cans per year, and Verallia commissioned a 400 million-bottle line in Jacareí to support regional distillers. These localized investments shorten lead times, reduce freight costs, and align with the rising expectations of the middle class.
Restraints Impact Analysis*
| Restraint | (~) % Impact on CAGR Forecast | Geographic Relevance | Impact Timeline |
|---|---|---|---|
| Fluctuating Raw Material and Energy Costs | -0.9% | Global, acute in Europe and North America | Short term (≤ 2 years) |
| Stringent Environmental Packaging Compliance Costs | -0.5% | Europe and North America, expanding to Asia-Pacific | Medium term (2-4 years) |
| Aluminum Can Body Shortage From EV Battery Competition | -0.7% | Global, severe in North America and Europe | Medium term (2-4 years) |
| EU Digital Product Passport Mandates Increasing Label Complexity | -0.3% | Europe and exporting nations | Long term (≥ 4 years) |
| Source: Mordor Intelligence | |||
Fluctuating Raw Material and Energy Costs
Aluminum averaged USD 2,420 per metric ton in 2024, up 14% year-over-year, pressuring can margins.[4]London Metal Exchange, “Aluminum Price Data 2024,” lme.comEuropean natural-gas spikes increased glass-production costs by 18%, resulting in surcharges of EUR 0.08 to EUR 0.12 per bottle. PET resin traded between USD 950 and USD 1,180 per ton amid volatility in crude oil prices. Ball absorbed USD 340 million in additional raw material spend despite hedging. In response, glass makers are electrifying furnaces; Ardagh’s hydro-powered Swedish site cut per-ton costs by 22%. Carbon allowances under the EU ETS added EUR 15 per ton to both glass and aluminum in 2024, underscoring the link between energy policy and packaging economics.
Aluminum Can Body Shortage from EV Battery Competition
EV batteries consumed 1.8 million metric tons of aluminum in 2024, tightening the supply of rolled products. North American lead times climbed from six to 14 weeks, delaying seasonal beer launches. Battery demand is projected to rise 23% annually by 2030, potentially leading to a 4.5-million-ton deficit in can-sheet stock. Crown reported a 9% drop in can shipments due to shortages and client destocking. Long-term contracts provide partial relief; Ball is locked in at 150,000 tons per year under a 10-year deal with Alcoa, effective in 2024. Recycling is critical; U.S. aluminum can recovery improved to 52% in 2024, but it still trails Europe’s 75% rate.
*Our forecasts treat driver/restraint impacts as directional, not additive. The impact forecasts reflect baseline growth, mix effects, and variable interactions.
Segment Analysis
By Material: Glass Retains Prestige While Metal Scales Fast
Glass held 54.05% of 2025 revenue, solidifying its dominance in wine and high-end spirits, where inertness and brand heritage are key considerations. The alcoholic drinks packaging market is experiencing accelerated growth in metal, with aluminum forecast to post a 6.35% CAGR through 2031, driven by the rise of RTD cocktails, canned wine, and lightweight craft beer launches. Metal’s prior 5.9% CAGR from 2020 to 2024 now serves as a launchpad for faster uptake as breweries integrate digital printing.
Recycled-content glass usage averaged 58% in Verallia’s European furnaces in 2024, alleviating input cost pressure while meeting eco-label requirements. Paper and bio-based composites remain experimental, yet Diageo’s target of 100 million paper bottles by 2030 indicates future traction. Plastic lags due to barrier limits, though pouches and miniatures create small niches where shatter resistance trumps tradition. Regulatory focus centers on life-cycle assessments, as outlined in ISO 14044, prompting brands to publish Environmental Product Declarations. Suppliers capable of validating carbon data and ensuring a stable supply of cullet are best positioned as sustainability reporting becomes more stringent.



By Package Type: Bottles Dominate but Cans Accelerate
Bottles contributed 58.20% of 2025 revenue, riding entrenched wine and premium-beer norms that favor glass aesthetics and storytelling labels. Metal cans, however, are projected to register a 7.05% CAGR, moving beyond beer into spirits and wine as consumers seek grab-and-go convenience. Craft brewers embraced in-house digital printing, cutting artwork lead times from eight weeks to two days, and enabling 5,000-unit special editions that drive taproom buzz.
Pouches hold a share of under 3% yet are growing in e-commerce, where lighter shipments lower breakage costs by 40%. Bag-in-box and refillable totes cater to on-premise needs and duty-free exclusives, thereby strengthening circular supply models. Ardagh logged a 12% uptick in metal-wine can shipments, especially among Australian brands targeting festival sales. Deposit-return schemes reward recycling, aligning consumer convenience with regulatory incentives. ISO 11683 recyclability standards now influence retailer shelf allocations as chains demand easily sortable formats.
By Product: Beer Still Leads, Spirits Grow Fastest
Beer accounted for 41.20% of 2025 revenue, supported by high-volume consumption in mature economies and increasing sales in Asia-Pacific cities. Spirits, boosted by premiumization and RTD innovations, are forecast to grow at a 7.45% CAGR, the fastest within the alcoholic drinks packaging market. Aluminum-canned cocktails, boasting portable 330 milliliter sizes, secured 92% of RTD format share in 2024, underscoring metal’s role in new product launches.
Wine remains steady but is diversifying formats; canned wine accounted for 6% of category revenue in 2024, double the 2022 level. Hard seltzers declined by 8% in North America, while premium spirits captured demand through higher-alcohol RTDs. Pernod Ricard raised packaging spend 14% to source custom glass with embossed finishes that authenticate origin and deter counterfeits. Regulatory guardrails on ingredient disclosure and health warnings continue to shape label real estate, nudging design adjustments rather than deterring growth.

By Distribution Channel: Off-Trade Dominance Meets Duty-Free Revival
Off-trade channels accounted for 61.85% of 2025 revenue, solidifying the strength of supermarkets and the persistence of at-home consumption habits established during pandemic restrictions. Duty-free is expected to expand at a 6.4% CAGR as passenger traffic recovers to 2019 levels and airports curate exclusive premium spirits ranges.
On-trade channels are improving but still face labor shortages and higher operating costs that constrain new venue openings. E-commerce, with a share of under 10% yet growing at double digits, benefits from direct-to-consumer platforms and curated-box subscriptions that encourage experimentation. Breakage concerns drive demand for pouches, lightweight glass, and purpose-built secondary packs, which reduce returns from 4% to 1%. Diageo’s online revenue climbed to 8% of net sales in 2024, with cans and pouches over-indexing thanks to lower parcel weights. Age verification stays central to compliance, pushing investments in digital ID checks and tamper-evident delivery processes.
Geography Analysis
North America captured 39.10% of 2025 revenue, driven by craft-beer innovations, premium-spirit launches, and stringent deposit-return regulations that foster high recycling rates. Yet, growth is projected at a modest 3.95% CAGR through 2031, as category maturity tempers unit expansion, even while a premium SKU mix improves margins. Europe contributed 32.40% in 2025, facing pressure from declining German beer volumes but showing resilience in French and Italian wine packaging, as well as Eastern European spirits sales. The EU Digital Product Passport, effective as of 2027, is encouraging suppliers to adopt blockchain traceability and QR-code labels that detail the recycled content and end-of-life options. O-I began deploying electric furnaces in Poland and Spain, cutting emissions by half per ton and supporting regional compliance needs.
The Asia-Pacific region is set to grow at an 7.95% CAGR, the fastest among the alcoholic drinks packaging markets, as China and India urbanize and incomes rise. The Asian Development Bank forecasts a 3.5 billion-strong middle class by 2030, which is expected to support demand for premium packages. Ball’s new Indian plant will supply 1.2 billion cans annually, reflecting a localization strategy aimed at lowering freight costs and shortening lead times. Southeast Asia also benefits from Crown’s Cambodian expansion, which adds 30% capacity to cover RTD growth in the region.
Brazil and Argentina being the dominant countries, despite currency headwinds that increase the cost of imported aluminum and glass. Verallia grew glass shipments 9% to Latin American distillers seeking premium export bottles. Middle East and Africa remain below 5%, but the United Arab Emirates and South Africa show premium spirits momentum in duty-free and expatriate retail. Infrastructure investments to bolster cold chains and recycling systems are underway, revealing long-term potential for circular packaging models. Regulatory focus on ingredient labeling and age controls is spreading, harmonizing regional compliance with international standards for exporters.

Regulatory Landscape
In Europe, the Packaging and Packaging Waste Regulation, Regulation (EU) 2025/40, entered into force on February 11, 2025 and applies from August 12, 2026, tightening rules on packaging design, waste sorting communication, and data needs across beverage formats. The PPWR introduces harmonized labeling requirements (pictogram-based, linked to material composition), increasing redesign and change-control workload for alcoholic beverage bottles, cans, and multipacks distributed across multiple EU member states.
In the United States, labeling and container-deposit compliance remain key packaging touchpoints. In January 2025, the Alcohol and Tobacco Tax and Trade Bureau (TTB) initiated a rulemaking process to require standardized consumer information panels, an "Alcohol Facts" style label concept, which raises the importance of label real estate management and print agility. At the state level, deposit return program requirements such as California CRV labeling for wine and distilled spirits containers (effective July 1, 2025) affect artwork governance and SKU differentiation for brands selling across state lines.
Value Chain Analysis
The value chain starts with raw materials and intermediates (glass cullet, silica/soda ash, aluminum can sheet and ends, PET/resins, paperboard, inks/coatings, and closures) and moves into packaging conversion (glass furnaces and forming, canmaking, carton conversion, and label/decoration). It then extends to filling, secondary packaging, palletization, and distribution into off-trade retail, on-trade/HoReCa, e-commerce, and duty-free channels. Compliance and sustainability requirements increasingly span the chain as data layers, including recycled-content accounting, pack labeling harmonization, and product traceability. This pushes converters and brand owners to integrate specification control, verification, and reporting alongside physical supply.
Regionalization and portfolio strategies are also reshaping operations to reduce lead times and reliance on imported packaging for heavy formats. Stock packaging expansions, such as Ardagh Glass Packaging-North America adding new spirits bottle formats to its portfolio, improve access to compliant containers for mid-sized and craft producers without bespoke tooling. Innovations including in-house digital can printing further compress design-to-shelf cycles. Circular systems add a reverse logistics leg, with refillable models such as reusable tote systems and deposit-return programs increasing the need for robust collection, sorting, and reuse-ready packaging specifications.
Competitive Landscape
The market is indicating fragmentation. Vertical integration is intensifying as these leaders acquire recycling assets to secure secondary material feeds and blunt raw-commodity risk. Ball’s Infinity digital-printing network, embedded in 14 North American breweries, generated incremental sales of USD 120 million in 2024 while securing clients through on-site customization. Crown’s agile can plants in Mexico and Cambodia enable sub-six-week lead times, winning contracts from RTD producers targeting seasonal windows. Ardagh’s R&D spend rose 16%, aimed at cutting bottle weight to 320 grams and developing bio-based PET coatings that reduce fossil carbon by 40%.
Disruptors such as EcoSpirits are scaling refillable tote systems that reduce single-use glass by 85% per liter, drawing strategic investment from Temasek and partnering with prominent companies like Diageo, Pernod Ricard, and Rémy Cointreau. CANPACK and Toyo Seikan are seizing regional share by offering flexible minimum orders and regionally adapted formats for craft brewers and boutique distillers. Smart-label technologies that embed provenance data via blockchain or QR codes are moving from pilot to commercial scale as EU traceability mandates loom. Cost pressure remains acute, aluminum price volatility and energy surcharges force suppliers to renegotiate pass-through clauses, yet customer resistance limits their ability to fully recover.
Sustainability credentials are now a prerequisite for preferred-supplier status. Performance metrics include Scope 3 emissions reductions, recycled-content thresholds of 25% for glass and 30% for PET by 2028 in the EU, and cradle-to-grave carbon transparency. Providers that can validate these metrics while offering design agility and on-time delivery are likely to secure long-term contracts. Conversely, those slow to modernize furnaces, digitize print lines, or localize production risk margin erosion and client churn as beverage brands pivot toward lighter, traceable, and compliant packaging.
Alcoholic Drinks Packaging Industry Leaders
Ardagh Group SA
Ball Corporation
Owens-Illinois Inc.
Amcor plc
Crown Holdings Inc.
- *Disclaimer: Major Players sorted in no particular order

Market Opportunities and Future Outlook
EU implementation timing under Regulation (EU) 2025/40 (PPWR), which applies from August 12, 2026, creates room for packaging suppliers that can provide harmonized waste-sorting labels, scalable artwork changeovers, and verifiable recycled-content documentation across multi-country portfolios. Traceability and sustainability disclosures are also moving from pilot to rollout, supported by Owens-Illinois launching a blockchain-enabled QR-code traceability platform for European production in June 2025 to detail recycled content and carbon footprints.
Low-carbon glass and circular distribution formats are also opening upgrade paths for incumbent glass and secondary packaging suppliers. In March 2026, Mast-Jaegermeister SE began producing green glass bottles using hybrid furnace technology at Ardagh Glass Packaging-Europe in Obernkirchen, reporting around a 60% reduction in production carbon emissions, which supports premium spirits brands that need glass while tightening Scope 3 packaging targets. Reuse and pooled-bottle initiatives are progressing as well, including LIONs in June 2026 piloting a digitally tracked returnable crate and bottle system for Steinlager in Auckland, and Vetropack in June 2026 launching a 350-gram Rhinewine bottle with 80% recycled glass aligned to an Austrian reusable wine bottle pool scheme. Together, these efforts expand demand for lightweight, high-recycled-content containers and the systems needed to support them.
Recent Industry Developments
- June 2026: Ardagh Glass Packaging-North America introduced a new 700 ml American-made glass liquor bottle to its stock premium spirits portfolio. The addition supports spirits producers seeking domestic supply options and faster access to standardized formats without committing to custom molds, helping reduce lead-time and import-exposure risks.
- July 2025: Ardagh Glass Packaging and Mast-Jaegermeister announced plans to launch emerald green bottles produced using NextGen hybrid furnace technology at Ardagh's Obernkirchen site in Germany. The move reinforces investment in lower-carbon glass capability for high-volume spirits packaging, aligning packaging supply with decarbonization requirements and premium brand positioning.
- June 2024: Pernod Ricard and ecoSPIRITS entered a five-year global licensing agreement to distribute spirits brands using reusable 4.5-liter ecoTOTE containers. Scaling reusable distribution formats reduces single-use glass demand in on-trade and travel-related channels and expands the role of reverse logistics and refill infrastructure in spirits packaging programs.


Research Methodology Framework and Report Scope
Market Definition and Coverage
This market tracks the value of packaging used to contain, protect, and sell alcoholic beverages across common formats and materials, from filling lines through distribution to the point of sale, where demand is tied to beverage production and consumption.
Scope exclusions: It excludes bulk transport containers used only for industrial handling, plus labeling machinery and non-packaging processing equipment.
Segmentation Overview
- By Material
- Metal
- Glass
- Plastic
- Other Materials
- By Package Type
- Bottles
- Metal Cans
- Pouches
- Other Package Types
- By Product
- Beer
- Spirits
- Wine
- Ready-To-Drink Cocktails
- Other Products
- By Distribution Channel
- Off-Trade Retail
- On-Trade / HoReCa
- E-Commerce
- Duty Free
- By Geography
- North America
- United States
- Canada
- Mexico
- Europe
- United Kingdom
- France
- Germany
- Italy
- Spain
- Rest of Europe
- Asia-Pacific
- China
- India
- Japan
- South Korea
- Rest of Asia-Pacific
- South America
- Brazil
- Argentina
- Rest of South America
- Middle East and Africa
- Middle East
- United Arab Emirates
- Turkey
- Rest of Middle East
- Africa
- South Africa
- Nigeria
- Rest of Africa
- Middle East
- North America
Data Sources, Market Sizing, and Validation
Desk Research
Desk research was used to set the market boundaries, build the initial demand pool, and anchor major assumptions that can be checked externally. We leaned on public, repeatable data points such as packaging production and recycling statistics, beverage output indicators, and trade flows for packaging materials.
Sources typically reviewed include official statistics and program pages such as the US Alcohol and Tobacco Tax and Trade Bureau for beverage removals trends, Eurostat for packaged goods and materials signals, UN Comtrade for import and export direction on glass, aluminum, and plastics, and EPA and other national environment agencies for recycling and recovery rates. We also used company filings and investor presentations to sanity check capacity additions and pricing commentary, and we supplemented this with selective paid database subscriptions for company financials, patents, and shipment level import and export cuts where it helped reconcile gaps. The sources listed here are illustrative and not exhaustive, since many other public documents were also cross-checked for data collection, validation, and clarification.
Primary Interviews and Surveys
Primary work focused on packaging suppliers, converters, beverage producers, and channel stakeholders so that our assumptions on format mix, pricing, and adoption of lightweighting or recycled content could be tested in the real world. We also spoke with regionally spread participants to confirm what is actually changing in glass bottles, metal cans, closures, and secondary packaging demand, and then used the feedback to triangulate desk findings and finalize the market model.
Distribution of primary research fieldwork respondents
| Company type | Respondent position | Region |
|---|---|---|
| Top tier: 31% | CXOs: 18% | APAC: 42% |
| Mid tier: 47% | Functional/Unit leaders: 38% | EMEA: 32% |
| Smaller Players: 22% | Managers: 44% | Americas: 26% |
Market-Sizing & Forecasting
Sizing started with a top-down build where beverage output and consumption indicators, packaged alcohol penetration, and packaging intensity assumptions were used to reconstruct total packaging demand in value terms. To keep the model grounded, the totals were corroborated using selective bottom-up approximations such as sampled ASP times volume checks by key formats, plus supplier and converter revenue direction checks, before adjustments were made.
Inputs used in the model included alcoholic beverage production and shipment trends, mix shifts between glass bottles and cans, lightweighting and recycled content targets that affect material usage, average price movement by material (glass, aluminum, plastics, and paperboard), and channel shifts such as the split between on-trade and off-trade that influences secondary and tertiary packaging needs. Where bottom-up signals were incomplete for smaller formats or fragmented local supply, gaps were handled through conservative share-based allocations that were then validated in interviews.
For forecasting, scenario analysis was applied around beverage demand growth, material price paths, and regulatory pressure on single-use packaging, and the chosen base case was aligned to the most consistent expert consensus from primary discussions. The model was then rolled forward year by year so drivers and pricing assumptions remain visible and easy to replicate.
Data Validation & Update Cycle
Outputs were checked against independent signals such as beverage volume trends, packaging material trade direction, and announced capacity changes, and then reviewed for outliers at the region and format level. When large variances showed up, the underlying inputs were re-tested, and targeted re-contacts were triggered to confirm whether the variance was real or caused by a definition mismatch.
Before sign-off, the full model and assumptions go through multiple analyst review steps, including math checks, consistency checks across segments, and narrative alignment with observed market events. Reports are refreshed annually, and interim updates are done when material events occur, and then a final pre-delivery pass is completed so clients receive the most current view.
Mordor Intelligence's Alcoholic Drinks Packaging Market Sizing Compared With Other Published Estimates
Different published market sizes for alcoholic drinks packaging can vary even when the topic sounds the same, because the counting rules often change quietly. The biggest differences usually come from what is treated as packaging, the year used as the starting point, and how pricing is carried forward.
Beverage output signals and packaging format mix checks are the evidence that keep Mordor Intelligence's estimate anchored to primary packaging demand, rather than expanding the scope into adjacent items like labeling, equipment, or broad secondary packs that are not consistently tracked across regions.
Benchmark comparison
| Source | Market Size | Gaps in Research Methodology |
|---|---|---|
| Mordor Intelligence | USD 73.22 B (2026) | |
| Global Consultancy A | USD 84.62 B (2024) | Uses an earlier base year and commonly bundles a wider packaging perimeter that can include secondary components and related items, which lifts the starting value and makes year-to-year comparisons less like-for-like. |
| Industry Publisher B | USD 94.90 B (2025) | Leans on a broader definition that can pull in additional packaging elements such as closures and multiple packaging layers, and it applies a longer horizon that can dilute near-term pricing and mix inflections. |
Taken together, the spread is mainly explained by scope edges and base-year choices, followed by how pricing and mix shifts are carried into the forecast. By keeping the counted items tied to measurable packaging demand drivers and by re-checking the key assumptions with industry participants, the resulting number stays traceable to clear variables and repeatable steps.


Key Questions Answered in the Report
What is the current value of the alcoholic drinks packaging market?
The market is valued at USD 73.22 billion in 2026 and is projected to reach USD 93.12 billion by 2031.
Which packaging material is growing fastest?
Aluminum cans are expanding at a 6.35% CAGR as brands favor lightweight, recyclable formats.
Why are RTD cocktails important for packaging suppliers?
RTDs grew 18% in 2024, and 92% of them use aluminum cans, driving volume for metal packaging lines.
How will EU Digital Product Passports affect suppliers?
From 2027, beverage packages sold in Europe must carry traceability data, pushing firms to embed QR codes and blockchain records.
Which region offers the highest growth potential?
Asia-Pacific is forecast to grow at 7.95% CAGR, supported by urbanization, rising incomes, and regulatory liberalization.
What sustainability actions are leading suppliers taking?
Firms are electrifying glass furnaces, boosting recycled-content inputs, and deploying closed-loop refill systems to cut waste and carbon.
Page last updated on:





