Market Overview
| Study Period | 2020 - 2031 |
|---|---|
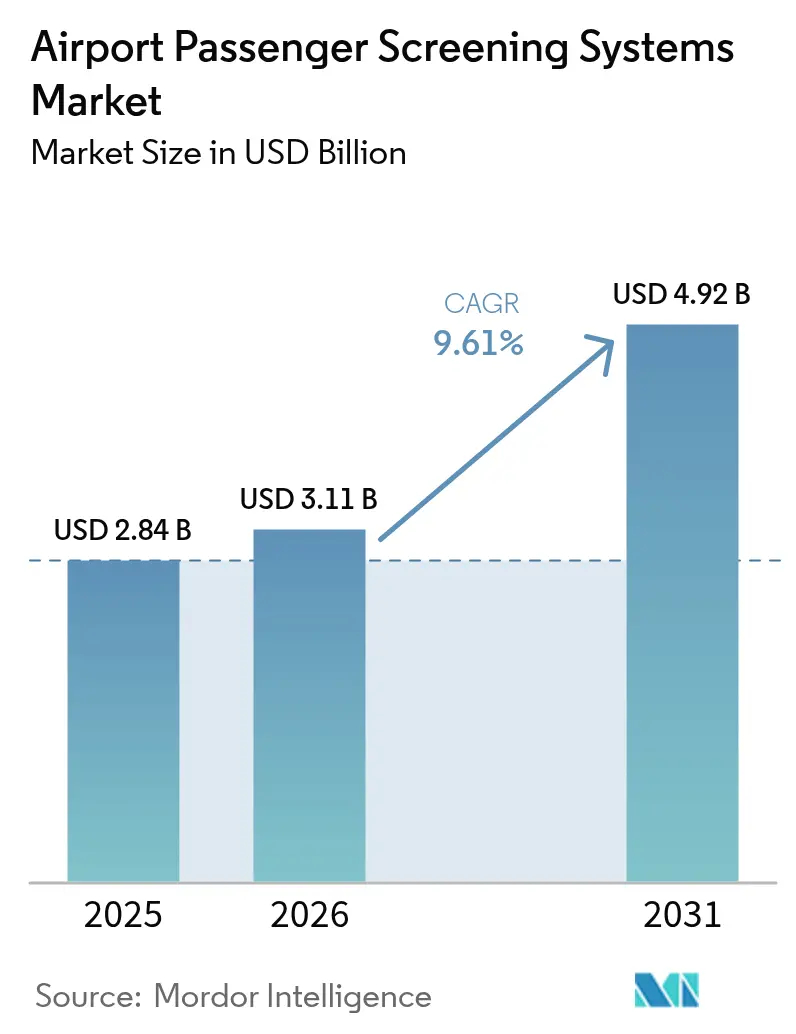
| Market Size (2026) | USD 3.11 Billion |
| Market Size (2031) | USD 4.92 Billion |
| Growth Rate (2026 - 2031) | 9.61% CAGR |
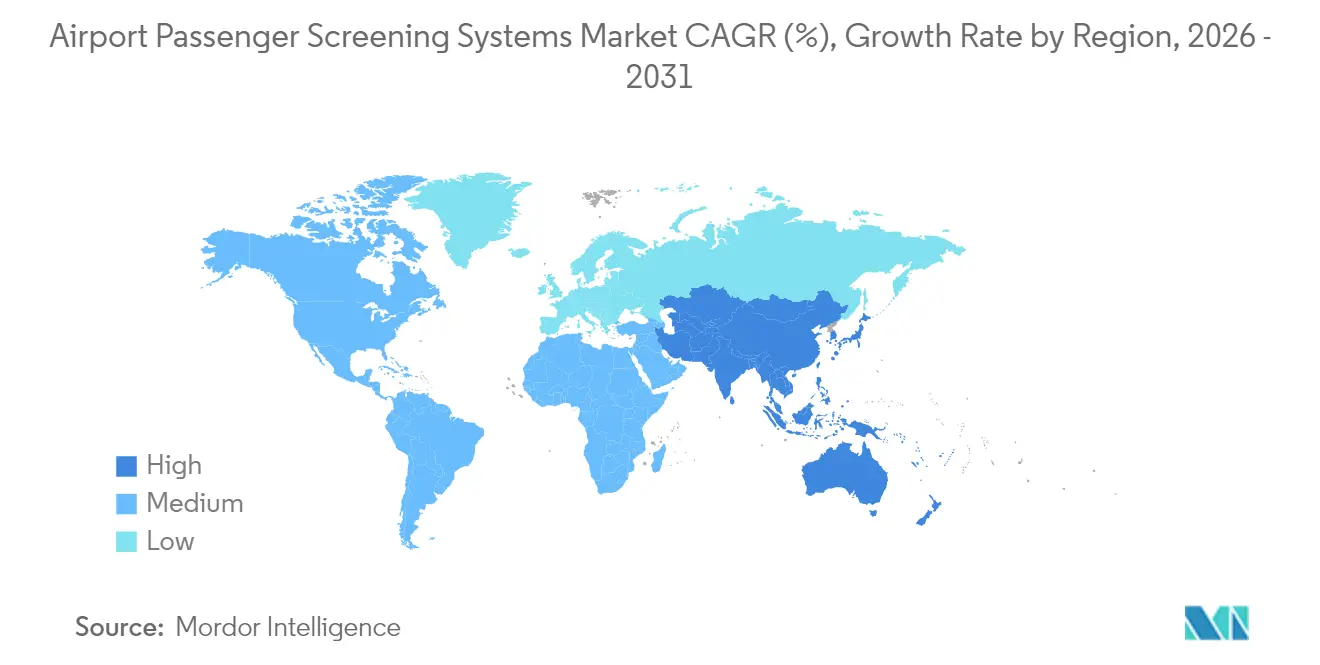
| Fastest Growing Market | Asia-Pacific |
| Largest Market | North America |
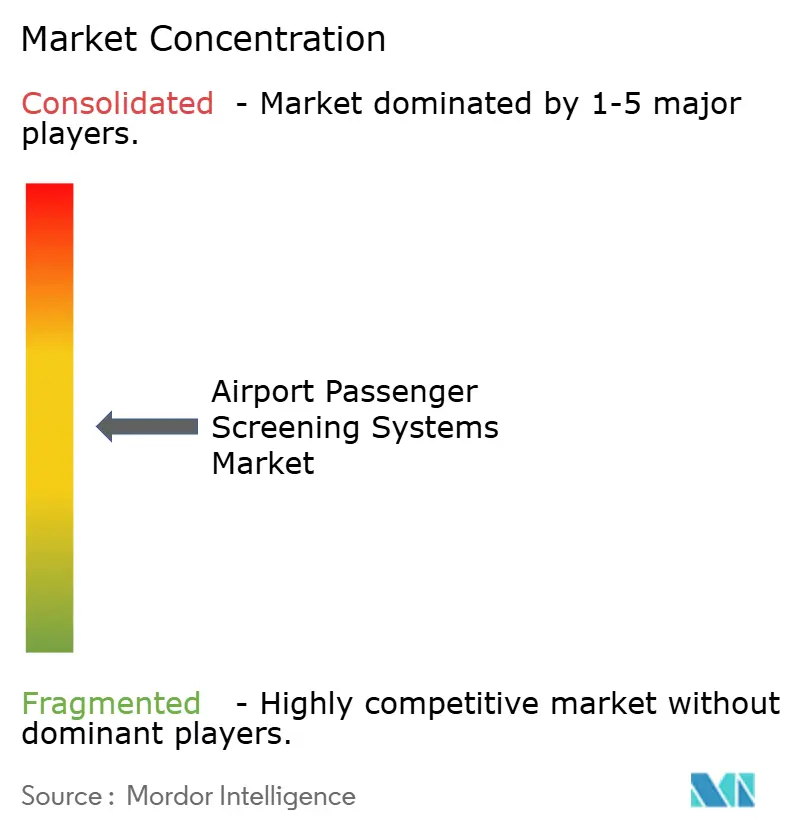
| Market Concentration | Medium |
Major Players *Disclaimer: Major Players sorted in no particular order Image © Mordor Intelligence. Reuse requires attribution under CC BY 4.0. | |
Airport Passenger Screening Systems Market Analysis by Mordor Intelligence
The airport passenger screening systems market size in 2026 is estimated at USD 3.11 billion, growing from 2025 value of USD 2.84 billion with 2031 projections showing USD 4.92 billion, growing at 9.61% CAGR over 2026-2031. Robust capital spending on computed-tomography (CT) checkpoints, rising passenger volumes approaching pre-2019 levels, and modernization mandates integrating biometric and artificial-intelligence (AI) functions propel this expansion. Regulatory programs such as the Transportation Security Administration’s (TSA) USD 10.7 billion capital plan for 2025-2029 and Europe’s C3 CT requirements are accelerating technology refresh cycles. Hardware continues to capture the bulk of outlays, yet software-driven analytics and predictive maintenance are growing fastest as airports seek real-time threat assessment and lower lifetime costs. Regionally, North America remains the largest buyer, while Asia-Pacific, backed by infrastructure build-outs that serve more than 3 billion annual travelers, is the fastest-growing arena. Competitive differentiation hinges on backlog strength and AI partnerships, with incumbents broadening portfolios as smaller specialists commercialize retrofit-friendly or employee-screening innovations.
Key Report Takeaways
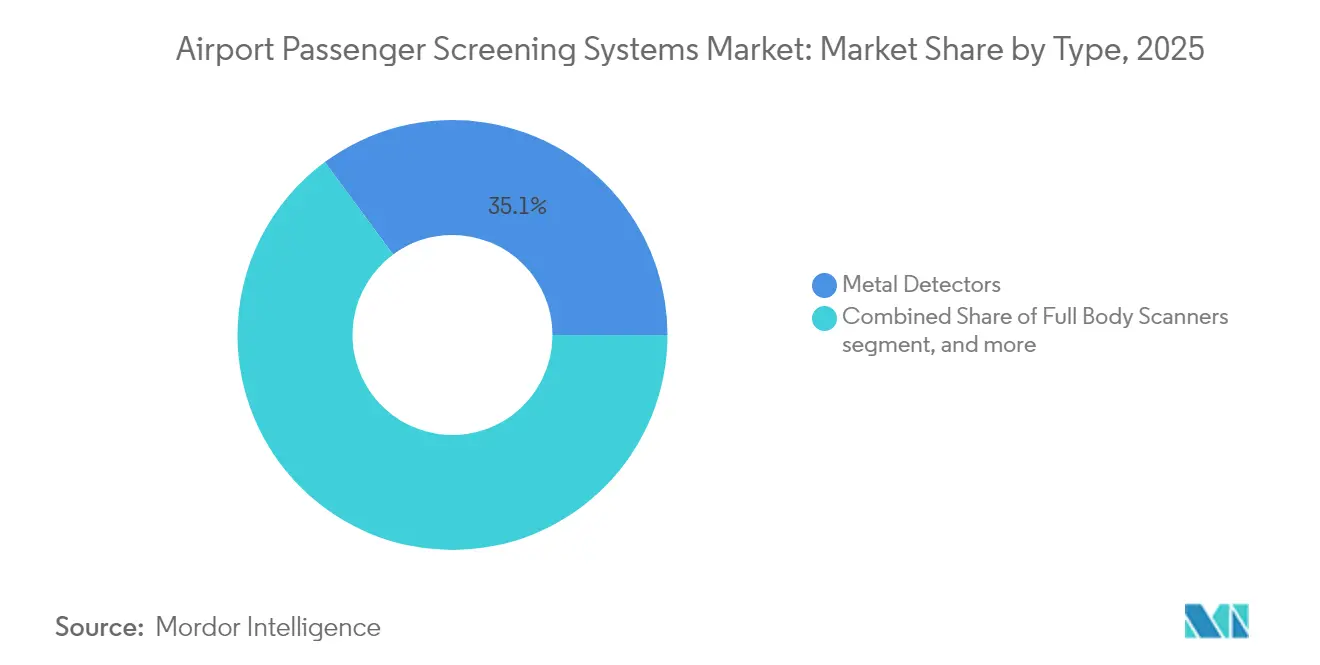
- By type, metal detectors led the airport passenger screening systems market with 35.12% of the share in 2025; advancing imaging technology is projected to expand at a 9.78% CAGR through 2031.
- By component, hardware accounted for 71.60% of the airport passenger screening systems market size in 2025, while software is set to grow at a 10.05% CAGR between 2026 and 2031.
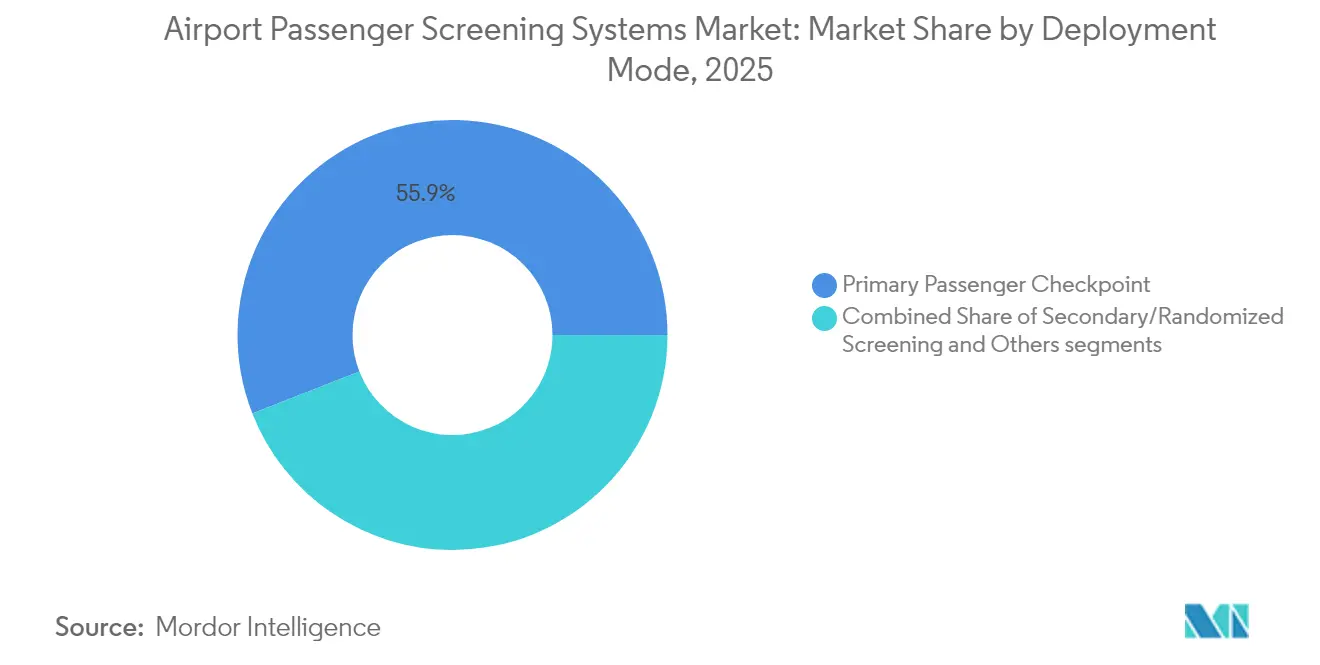
- By deployment mode, primary passenger checkpoints represented 55.94% revenue share in 2025; secondary and employee-screening applications are forecasted to advance at a 9.71% CAGR to 2031.
- By airport hub size, large hubs held 51.88% of the airport passenger screening systems market size in 2025; small airports are projected to expand at a 10.32% CAGR to 2031.
- By geography, North America captured 33.10% revenue share in 2025, whereas Asia-Pacific is expected to post the fastest 10.28% CAGR through 2031.
Note: Market size and forecast figures in this report are generated using Mordor Intelligence’s proprietary estimation framework, updated with the latest available data and insights as of 2026.
Global Airport Passenger Screening Systems Market Trends and Insights
Drivers Impact Analysis*
| Driver | (~) % Impact on CAGR Forecast | Geographic Relevance | Impact Timeline |
|---|---|---|---|
| Growth in global air passenger traffic increasing demand for advanced screening technologies | +2.1% | Asia-Pacific, Middle East, Global | Medium term (2-4 years) |
| Implementation of regulatory mandates driving adoption of computed tomography (CT) systems | +1.8% | North America, Europe expanding to Asia-Pacific | Short term (≤ 2 years) |
| Modernization initiatives promoting deployment of advanced identity authentication solutions | +1.2% | North America, Europe, Global | Medium term (2-4 years) |
| Emergence of retrofit-friendly technologies reducing infrastructure upgrade costs | +0.9% | Global, smaller airports | Long term (≥ 4 years) |
| Integration of AI in millimeter-wave (mmWave) systems enhancing real-time threat detection capabilities | 0.8% | North America and Europe, with spillover to APAC | Medium term (2-4 years) |
| Expansion of airport security protocols to include employee screening operations | 0.7% | Global, with early adoption in North America | Long term (≥ 4 years) |
| Source: Mordor Intelligence | |||


Rising Passenger Traffic Pushing Demand for High-Throughput Systems
Asia-Pacific airports processed more than 3 billion passengers in 2024, surpassing 2019 throughput and intensifying the need for equipment that screens 300-plus travelers per hour while upholding stringent detection standards.[1]ACI Asia-Pacific, “Passenger and Cargo Traffic Data for Asia-Pacific and Middle East,” aci-asiapac.aero Middle-Eastern megaprojects valued near USD 1 trillion incorporate bright corridors that fuse biometrics with AI detection, illustrating how traffic growth directly converts into capital orders for advanced CT and mmWave scanners. Airports in emerging markets favor scalable, software-upgradable platforms to keep pace with double-digit passenger growth, whereas mature North American hubs concentrate on workflow optimization. The direct link between volume and security investment has strengthened since 2024 as operators measure checkpoint performance on risk mitigation and queue-time metrics. Consequently, the airport passenger screening systems market increasingly rewards vendors capable of proving throughput gains alongside compliance credentials.
Regulatory Mandates for CT Deployment
TSA requires Category X checkpoints to convert to CT by 2026 and has earmarked USD 2.8 billion solely for acquisition and installation, guaranteeing a multi-year procurement pipeline. The European Commission’s September 2024 re-imposition of liquid restrictions on airports lacking C3 CT accelerated EU rollouts. ICAO’s 2024 Global Aviation Security Plan endorses CT as the reference standard for its 193 member states. These mandates extend to employee screening under TSA’s Rap Back program, producing secondary demand beyond primary lanes. Noncompliance penalties compel rapid tenders, channeling share toward suppliers with certified solutions and global support. As a result, the airport passenger screening systems market sees forecastable surges just ahead of each regulatory deadline.
Modernization Programs Integrating Biometric Identity
TSA’s Credential Authentication Technology (CAT) spans more than 280 US airports and now completes over 3 million ID checks monthly. Dubai’s smart gates clear 95% of eligible passengers without manual verification, illustrating how contactless flows remain a post-pandemic priority. Biometric adoption brings data-privacy scrutiny; the Privacy and Civil Liberties Oversight Board underscores consent and retention compliance challenges in its 2024 review. Funding via airport-improvement grants offsets initial cost, yet deployment cadence depends on existing IT backbones. Airports value seamless identity-to-screen linkage, and vendors able to bundle CAT, facial recognition, and CT scanners position themselves for bundled awards within the airport passenger screening systems market.
Retrofit Friendly Technologies Lowering Upgrade Costs
Advanced imaging once demanded USD 146,000-159,000 in checkpoint remodeling per unit, deterring smaller airports. Modular CT now slides into legacy footprints, trimming civil-works budgets by up to 40% while retaining TSA certification. Portable or semi-portable units support temporary gates, disaster relief, and pop-up VIP lounges, broadening use cases. Software-defined platforms let operators add analytics without swapping out expensive hardware, extending service life and improving return on capital. These innovations democratize the airport passenger screening systems market, allowing facilities with under 5 million annual passengers to adopt technology once reserved for hubs.
Restraints Impact Analysis*
| Restraint | (~) % Impact on CAGR Forecast | Geographic Relevance | Impact Timeline |
|---|---|---|---|
| Physical and infrastructure limitations at airports hindering technology deployment | -0.6% | Older airports in Europe, North America, Global | Short term (≤ 2 years) |
| Rising cybersecurity and data compliance costs impacting biometric system integration | -0.4% | Europe, North America, Global | Medium term (2-4 years) |
| Public concerns regarding privacy and health risks associated with certain scanning technologies | -0.5% | North America and Europe, with spillover to developed APAC markets | Medium term (2-4 years) |
| Escalating component costs affecting affordability of next-generation screening systems | -0.4% | Global, with disproportionate impact on emerging markets and small airports | Long term (≥ 4 years) |
| Source: Mordor Intelligence | |||
Legacy Infrastructure Limiting Space, Power, Weight
Roughly 40% of leading international airports opened before 1980 and lack the floor space, electrical capacity, or structural strength to house CT gear that occupies 15-20% more area and draws triple the power of legacy X-ray units. Terminal modifications can exceed USD 500,000 per lane and cause daily disruption losses topping USD 100,000 at peak hubs. Weight limits on elevated checkpoints further complicate installs, especially in multi-level European and Asian terminals. These constraints delay rollouts and temper growth potential within the airport passenger screening systems market until retrofit budgets or greenfield projects catch up.
Rising Cybersecurity and Privacy Compliance Costs
Biometric deployments must satisfy GDPR, US federal cyber directives, and airline codeshare rules, adding USD 200,000-400,000 to each project for encryption, intrusion monitoring, and legal reviews.[2]Government Accountability Office, “TSA Facial Recognition Technology,” gao.gov Consent-withdrawal workflows, storage minimization, and breach notification demands extend timelines and favor vendors with secure cloud or on-prem solutions already vetted by regulators. Smaller airports struggle to finance these safeguards, slowing biometrics adoption even as passenger demand for contactless journeys rises. Persistent cyber risk, therefore, trims growth expectations for the airport passenger screening systems market.
*Our forecasts treat driver/restraint impacts as directional, not additive. The impact forecasts reflect baseline growth, mix effects, and variable interactions.
Segment Analysis
By Type: Computed Tomography Underpins the Detection Leap
The airport passenger screening systems market size for metal detectors reached a 35.12% share in 2025, yet CT-based advanced imaging technology is poised for the strongest 9.78% CAGR to 2031. Airport managers gravitate to CT for 3D imaging that clears liquids and electronics without unpacking, boosting lane throughput by up to 20%. Full-body mmWave scanners have reached saturation at many hubs, but AI-assisted pattern recognition is lifting detection accuracy and lowering false alarms. ICAO’s endorsement of CT as best practice cements its role, while retrofittable units broaden access for mid-tier airports. Continuous software upgrades let operators refine threat libraries without swapping hardware, sustaining lifecycle value within the airport passenger screening systems market.
CT’s cost premium narrows as production scales and as regulators fund procurement. Meanwhile, traditional walk-through metal detectors preserve relevance for perimeter checks, employee entries, and budget-constrained terminals. Hybrid lane designs that pair metal detection with CT or mmWave equipment maximize capacity and flex to risk ratings. Therefore, vendors that package multi-technology portfolios capture broader wallet shares across airport growth stages.


By Component: Software Intelligence Unlocks Latent Hardware Potential
Hardware accounted for 71.60% revenue in 2025 because scanners, conveyors, and cabling require the bulk of capital outlay. Yet software revenues are expanding at a 10.05% CAGR as algorithms underpin predictive threat analysis, automatic image interpretation, and condition-based maintenance. The airport passenger screening systems market size attributed to analytics is further lifted by subscription licenses that deliver real-time upgrades and cybersecurity patches.
Edge processing removes reliance on cloud round-trips, meeting data sovereignty rules while shrinking latency to milliseconds—vital for 250-plus passenger-per-hour lanes. Algorithm performance depends on abundant operational data, giving incumbents with decades of scans a moat against new entrants. DHS Science & Technology grants of USD 27.55 million for quantum-sensing and AI research underscore the government's appetite for software-led detection breakthroughs. Hardware suppliers that open APIs to independent software vendors multiply innovation, yet must safeguard certification integrity to retain airport trust.
By Deployment Mode: Secondary and Employee Applications Gain Speed
Primary passenger lanes retained a 55.94% share in 2025 because every traveler must pass through them. Nonetheless, secondary checks, random screening, and employee verification are forecast to grow 9.71% annually through 2031. TSA’s Rap Back continuous monitoring and high-profile insider-threat incidents have pushed airports to install walk-through mmWave portals at staff entrances. Thruvision’s passive system evaluations in San Diego illustrate early success and lower throughput disruption.
Secondary inspection zones leverage mobile scanners and targeted analytics to resolve alarms without funneling passengers back to the main queue, preserving throughput. Cargo side-doors, VIP channels, and pop-up event gates widen the addressable base for adaptable solutions within the airport passenger screening systems market. Integrated command dashboards that aggregate passenger, baggage, and employee data deliver holistic situational awareness prized by security directors.
By Airport Hub Size: Democratizing High-Grade Security
Large hubs commanded 51.88% of 2025 revenue, reflecting scale economics and regulatory scrutiny. Yet small airports are on track for the highest 10.32% CAGR as retrofit-ready CT, compact mmWave, and cloud-native analytics lower entry cost. The airport passenger screening systems market thus shifts from niche to mainstream among terminals handling under 2 million passengers.
Medium hubs bridge the transition, adopting modular lanes that can add capacity incrementally. Vendors increasingly market “checkpoint-as-a-service” bundles that bundle equipment, software, and multiyear maintenance in one fee, aligning with lean municipal budgets. As a result, security standardization advances across the aviation network, reducing weak-link vulnerability.
Geography Analysis
North America generated 33.10% of global revenue in 2025, owing to the TSA’s USD 10.7 billion modernization pipeline and mature infrastructure undergoing systematic refresh cycles. CAT identity technology now scans more than 3 million IDs monthly, and CT lanes are extending from flagship hubs to regional spokes. Canada and Mexico align rulesets with US standards, creating an integrated North American procurement theater that benefits suppliers certified by the TSA.
Asia-Pacific delivers the fastest 10.28% CAGR, fueled by China and India’s airport-construction drives. By 2024, passenger totals will already be 103% of 2019 benchmarks. Greenfield terminals embed CT, biometrics, and AI from day one, bypassing legacy constraints. Government stimulus under smart-city plans adds funding for edge analytics and cloud dashboards, broadening the airport passenger screening systems market. Mature markets like Japan and Australia pursue upgrades that embed AI threat libraries and privacy safeguards.
Europe sustains mid-single-digit growth under harmonized ECAC rules and the 2024 liquid-restriction reinstatement for airports lacking C3 CT. GDPR shapes biometric rollouts, prompting on-prem solutions and explicit consent flows. Meanwhile, the Middle East and Africa leverage USD 1 trillion in planned capacity to showcase biometric-plus-AI smart gates that clear 95% of travelers hands-free. Diverse regulatory cadence demands flexible certification strategies from vendors looking to capture global share.

Competitive Landscape
The airport passenger screening systems market remains moderately fragmented, though top suppliers deepen moats through AI alliances, service portfolios, and backlog scale. OSI Systems reported a USD 1.8 billion order book and 16% Security-division growth in FY 2025, underscoring its ability to fund continuous R&D and global support. Smiths Detection’s April 2025 pact with BigBear.ai targets a 25-30% drop in false positives, illustrating how machine learning is the new competitive frontier.
Integration capability is paramount; airports prefer single-throat contracts that bundle scanners, software, installation, and multiyear support. Retrofit specialists with portable or employee-oriented products turn fragmentation to advantage by partnering with prime contractors to fill white-space niches. Certification regime complexity shields incumbents, yet open-architecture trends invite startups focused on analytics overlays. Market consolidation via asset sales, spin-outs, and cooperative testing groups such as ECAC’s 2025 Security Testing Group further shapes rivalry dynamics.
Airport Passenger Screening Systems Industry Leaders
Analogic Corporation
Garrett Electronics Inc.
Smiths Group plc
Leidos, Inc.
OSI Systems, Inc.
- *Disclaimer: Major Players sorted in no particular order

Recent Industry Developments
- May 2025: Dubai Aviation Engineering Projects (DAEP) awarded Smiths Detection a contract to provide checkpoint screening solutions at Dubai International Airport (DXB). The initiative aims to improve security operations and passenger experience at one of the world's busiest airports.
- November 2024: Fraport, the airport operator, awarded Rohde & Schwarz a contract to install 100 security scanners at Frankfurt Airport. The scanners will be deployed across existing security checkpoints and integrated into future checkpoint facilities.
- March 2023: The Central Industrial Security Force (CISF) in India started deploying state-of-the-art full-body scanners in airports nationwide to modernize security systems and improve passenger convenience.


Global Airport Passenger Screening Systems Market Report Scope
Passenger screening systems used in airports today include metal-detection portals, x-ray imaging systems, and, in some airports, systems that look for drugs and chemicals.The study includes all these systems used for screening people only. Cargo and baggage screening systems are not included in the study.
The airport passenger screening systems market is segmented based on type and geography. By type, the market is segmented into metal detectors, full-body scanners, and advanced imaging technology. By geography, the market is segmented into North America, Europe, Asia Pacific, Latin America, the Middle East, and Africa. The market size and forecasts for each segment have been represented based on value (USD billion).
By Type
| Metal Detectors |
| Full Body Scanners |
| Advancing Imaging Technology |
By Component
| Hardware |
| Software |
By Deployment Mode
| Primary Passenger Checkpoint |
| Secondary/Randomized Screening |
| Others |
By Airport Hub Size
| Large |
| Medium |
| Small |
By Geography
| North America | United States | |
| Canada | ||
| Mexico | ||
| Europe | United Kingdom | |
| France | ||
| Germany | ||
| Spain | ||
| Rest of Europe | ||
| Asia-Pacific | China | |
| India | ||
| Japan | ||
| Australia | ||
| Rest of Asia-Pacific | ||
| South America | Brazil | |
| Rest of South America | ||
| Middle East and Africa | Middle East | United Arab Emirates |
| Saudi Arabia | ||
| Rest of Middle East | ||
| Africa | South Africa | |
| Rest of Africa | ||
| By Type | Metal Detectors | ||
| Full Body Scanners | |||
| Advancing Imaging Technology | |||
| By Component | Hardware | ||
| Software | |||
| By Deployment Mode | Primary Passenger Checkpoint | ||
| Secondary/Randomized Screening | |||
| Others | |||
| By Airport Hub Size | Large | ||
| Medium | |||
| Small | |||
| By Geography | North America | United States | |
| Canada | |||
| Mexico | |||
| Europe | United Kingdom | ||
| France | |||
| Germany | |||
| Spain | |||
| Rest of Europe | |||
| Asia-Pacific | China | ||
| India | |||
| Japan | |||
| Australia | |||
| Rest of Asia-Pacific | |||
| South America | Brazil | ||
| Rest of South America | |||
| Middle East and Africa | Middle East | United Arab Emirates | |
| Saudi Arabia | |||
| Rest of Middle East | |||
| Africa | South Africa | ||
| Rest of Africa | |||


Key Questions Answered in the Report
How large is the airport passenger screening systems market in 2026?
The airport passenger screening systems market size reached USD 3.11 billion in 2026, with a forecasted CAGR of 9.61% to 2031.
Which technology segment is growing fastest?
Advancing imaging technology, primarily CT scanners, is projected to expand at a 9.78% CAGR through 2031 as regulators mandate 3D detection.
Why is Asia-Pacific considered the most attractive regional opportunity?
Passenger numbers in Asia-Pacific surpassed 3 billion in 2024, and substantial greenfield airport construction drives a 10.28% regional CAGR for new screening investments.
What role does software play in future checkpoint upgrades?
Software delivers AI-based threat recognition, predictive maintenance, and cybersecurity updates, supporting a 10.05% CAGR for this component through 2031.
How are employee-screening requirements changing demand patterns?
Revised TSA regulations and insider-threat mitigation strategies are fueling nearly 9.71% annual growth in secondary and workforce-screening deployments.
Page last updated on:


