Aircraft Fuel Systems Market Size and Share
Market Overview
| Study Period | 2020 - 2031 |
|---|---|
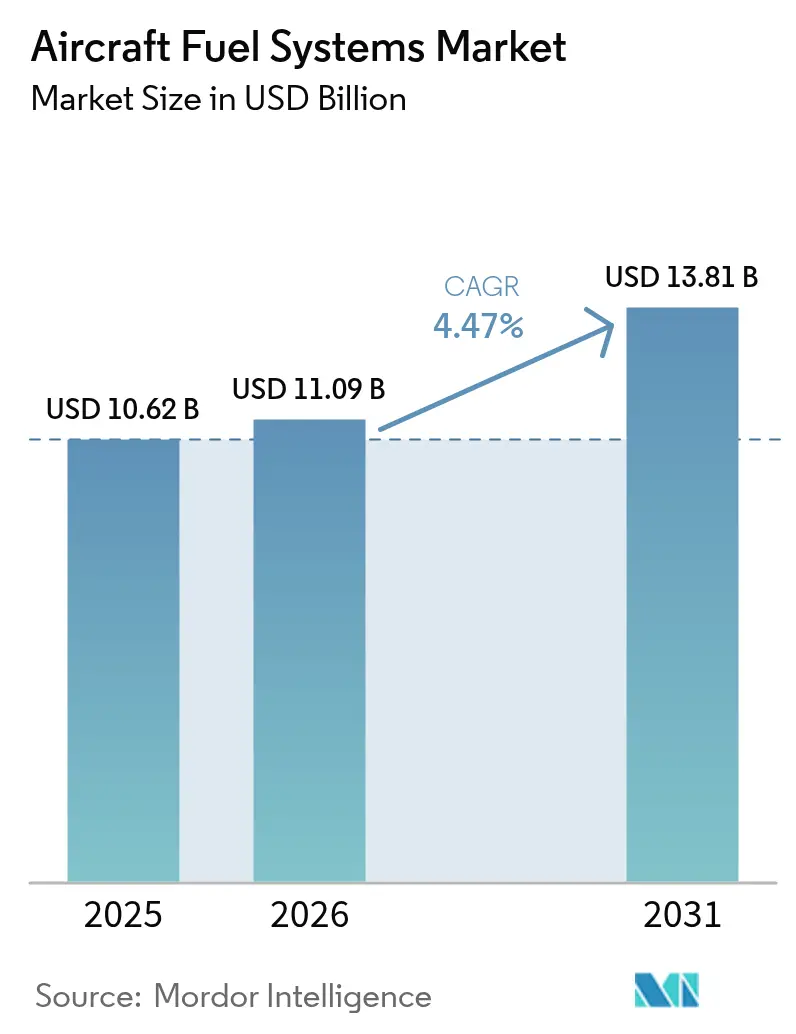
| Market Size (2026) | USD 11.09 Billion |
| Market Size (2031) | USD 13.81 Billion |
| Growth Rate (2026 - 2031) | 4.47% CAGR |
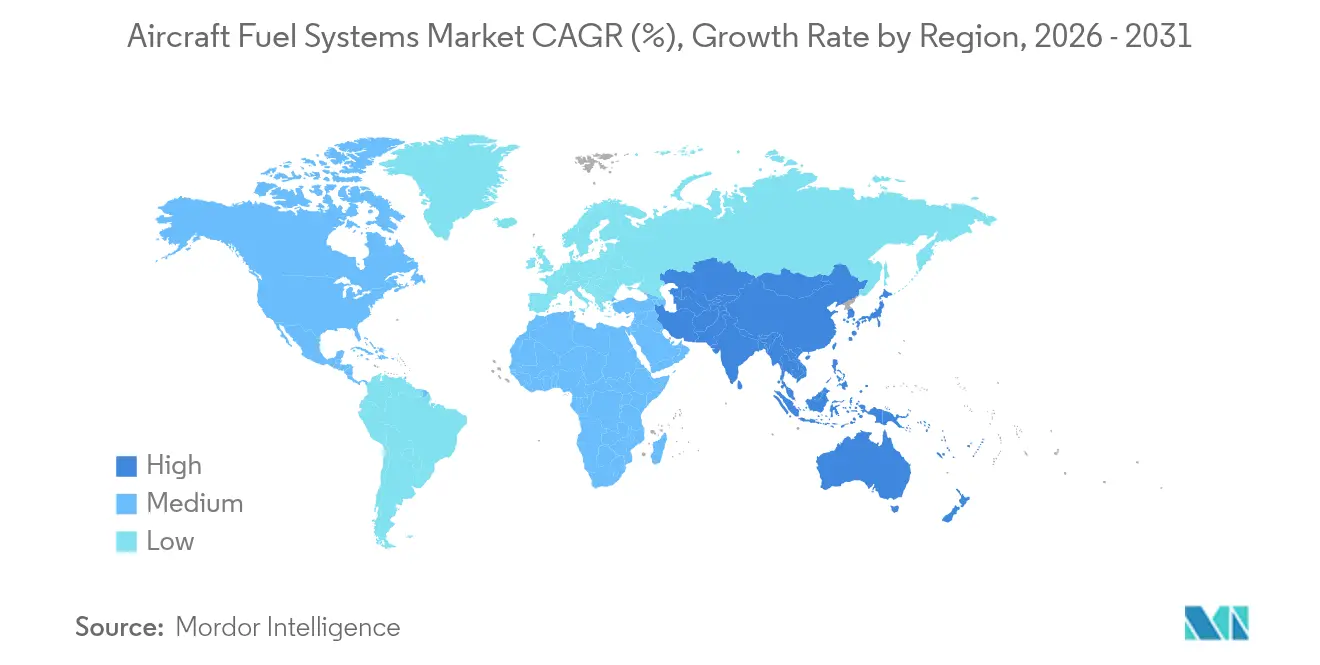
| Fastest Growing Market | Asia Pacific |
| Largest Market | North America |
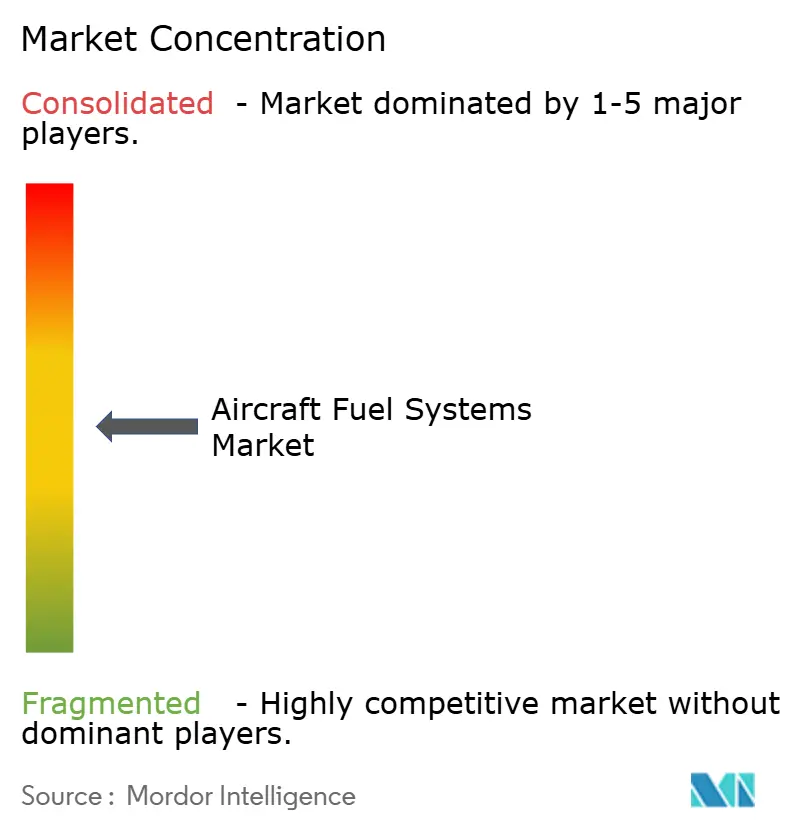
| Market Concentration | Medium |
Major Players *Disclaimer: Major Players sorted in no particular order Image © Mordor Intelligence. Reuse requires attribution under CC BY 4.0. | |
Aircraft Fuel Systems Market Analysis by Mordor Intelligence
The aircraft fuel systems market size is expected to grow from USD 10.62 billion in 2025 to USD 11.09 billion in 2026 and is forecast to reach USD 13.81 billion by 2031 at 4.47% CAGR over 2026-2031. Heightened aircraft production schedules, autonomy-driven refueling programs, and digital retrofits reinforce demand even as raw-material shortages challenge supply continuity. Airbus alone handed over 51 aircraft in May 2025, led by the A321neo and A321XLR, underscoring a rebound in single-aisle deliveries that depend on advanced fuel-saving architectures. Parallel momentum stems from a USD 898 million US Navy order covering three MQ-25 Stingray unmanned tankers, inauguring autonomous aerial refueling at sea. North American incumbents such as Parker Hannifin recorded 12% aerospace revenue growth to USD 1.6 billion in Q3 2025, signalling healthy aftermarket pull-through. Asia-Pacific provides the fastest regional lift, posting a 5.78% CAGR on the back of airport infrastructure expansion and rising defence budgets. Regulatory insistence on nitrogen-inerting and shifting toward sustainable aviation fuels (SAF) further stimulates technology upgrades, offsetting certification cost pressures and titanium supply disruptions that persist across civil and military value chains.
Key Report Takeaways
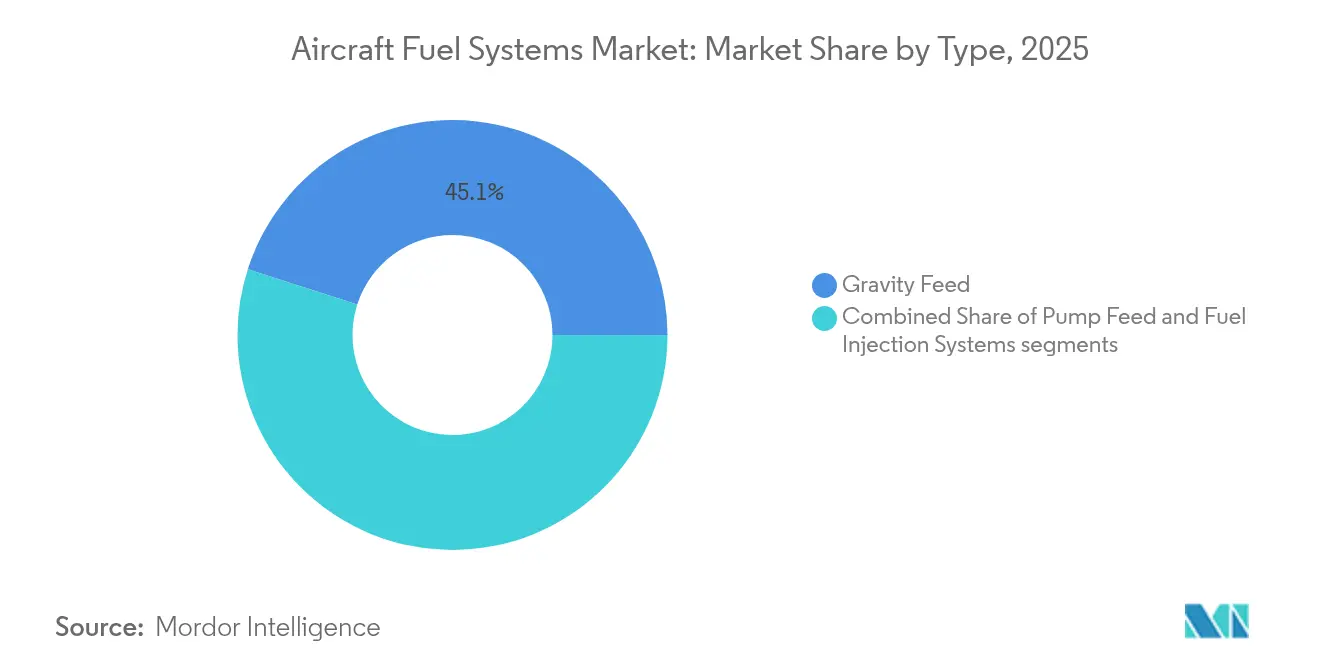
- By type, gravity feed accounted for 45.05% of the aircraft fuel systems market size in 2025, whereas the fuel injection systems segment is projected to climb at a 6.07% CAGR.
- By technology, conventional mechanical systems retained 39.45% of the aircraft fuel systems market share in 2025, while smart/connected systems are advancing at a 6.61% CAGR to 2031.
- By component, fuel tanks dominated, with a 36.15% share of the aircraft fuel systems market in 2025; inerting systems represent the fastest-growing component, with a 5.55% CAGR.
- By aircraft class, commercial aircraft controlled 59.62% revenue share in 2025; unmanned aerial vehicles are expanding at a 7.55% CAGR during 2026-2031.
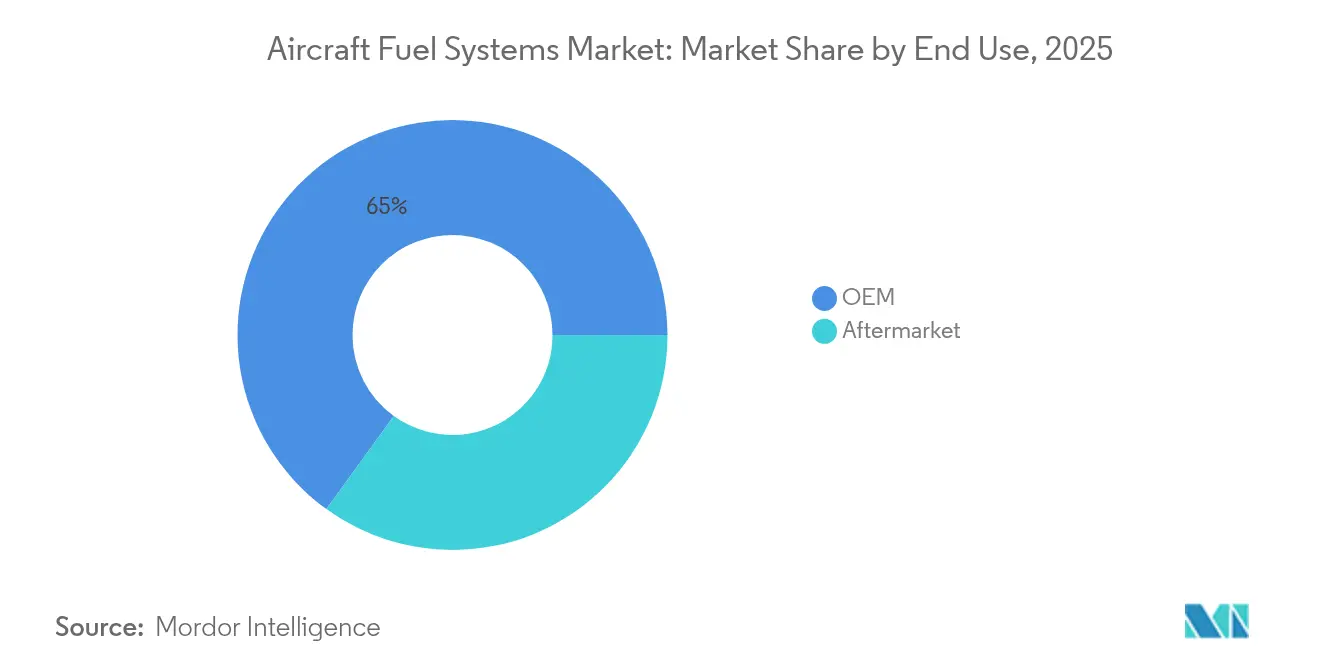
- By end use, OEM sales accounted for 65.02% of the aircraft fuel systems market size in 2025, whereas the aftermarket segment is projected to climb at a 6.28% CAGR.
- Regionally, North America held 41.98% of the aircraft fuel systems market share in 2025, yet Asia-Pacific is forecasted to post the highest 5.55% CAGR through 2031.
Note: Market size and forecast figures in this report are generated using Mordor Intelligence’s proprietary estimation framework, updated with the latest available data and insights as of 2026.
Global Aircraft Fuel Systems Market Trends and Insights
Drivers Impact Analysis*
| Driver | % Impact on CAGR Forecast | Geographic Relevance | Impact Timeline |
|---|---|---|---|
| Surging global commercial aircraft deliveries | +1.2% | Global (APAC and North America concentration) | Medium term (2-4 years) |
| Expansion of military aerial-refueling programs | +0.8% | North America, Europe, APAC defense corridors | Long term (≥ 4 years) |
| Rapid fleet modernization toward fuel-efficient platforms | +1.0% | Global, led by North America and Europe | Medium term (2-4 years) |
| Rising UAV procurement across civil and defense sectors | +0.6% | Global, early adoption in North America and Europe | Short term (≤ 2 years) |
| Predictive analytics integration for real-time fuel-system health | +0.4% | North America, Europe, advanced APAC markets | Short term (≤ 2 years) |
| Mandatory retrofit of nitrogen-inerting systems for safety | +0.3% | Global (FAA and EASA-driven) | Long term (≥ 4 years) |
| Source: Mordor Intelligence | |||
Surging Global Commercial Aircraft Deliveries
Airframers are elevating output to meet airline refurbishment cycles. Airbus aims for 820 deliveries in 2025 and prioritizes long-range single-aisle models that utilise multiple centre- and auxiliary-tank arrangements to achieve up to 4,700 NM range. Boeing’s concurrent production of F-15EX fighters sustains fuel pump and valve demand for combat platforms.[1]Boeing Company, “F-15EX Production Status,” boeing.com Component suppliers, therefore, face enlarged call-offs for precision pumps, probes, and transfer valves while MRO providers register faster consumable replacement cycles as utilization returns to pre-pandemic flight hours.
Expansion of Military Aerial-Refueling Programs
The MQ-25 Stingray marks the first carrier-based unmanned tanker capable of transferring 15,000 lb of fuel beyond 500 NM, pushing requirements for fault-tolerant flow metering and autonomous shut-off logic. The USAF’s KC-46A Pegasus expansion and allied European acquisitions reinforce multi-point refuelling demand, each necessitating high-capacity boost pumps and actively damped boom-actuation manifolds.
Rapid Fleet Modernization Toward Fuel-Efficient Platforms
Airlines are retiring older twin-aisles in favour of lighter airframes and blended-wing-body prototypes purporting 50% fuel savings, such as the JetZero demonstrator backed by Collins Aerospace and Pratt & Whitney. Innovative layouts require distributed tank clusters and smart balancing algorithms to safeguard the centre-of-gravity during cruise and descent.
Predictive Analytics Integration for Real-Time Fuel-System Health
Honeywell’s Connected Maintenance cuts up to 50% of unscheduled removals through sensor-driven algorithms that flag pump cavitation or valve stiction before line removal.[2]Honeywell Aerospace, “Connected Maintenance Performance,” honeywell.com GE Aerospace’s Maintenance Insight provides live dashboards that map fleet fuel burn and leakage trends, enabling operators to save 3-5% on fuel costs.
Restraints Impact Analysis*
| Restraint | % Impact on CAGR Forecast | Geographic Relevance | Impact Timeline |
|---|---|---|---|
| High certification and qualification costs for new fuel technologies | −0.7% | Global (highest in North America and Europe) | Medium term (2-4 years) |
| Aviation-grade titanium and elastomer supply bottlenecks | −0.9% | Global (acute in North America and Europe) | Short term (≤ 2 years) |
| Fuel-price volatility curbing airline capital expenditure | −0.5% | Global (regional variation with hedging) | Short term (≤ 2 years) |
| Cyber-security risks in digital gauging and control networks | −0.3% | North America, Europe, advanced APAC markets | Medium term (2-4 years) |
| Source: Mordor Intelligence | |||
High Certification and Qualification Costs for New Fuel Technologies
Novel hydrogen or SAF-ready fuel systems routinely require multi-year test campaigns and FAA certification plans. The agency’s December 2024 Hydrogen Roadmap highlights data gaps that could cost manufacturers tens of millions in qualification expenditure. Small suppliers face disproportionate burdens that slow market entry and limit price competition.
Aviation-Grade Titanium and Elastomer Supply Bottlenecks
Document-fraud revelations involving titanium billets for large civil programs prompted heightened traceability audits, delaying raw-material deliveries and raising per-unit costs for pumps and manifolds that rely on Ti-6-4 forgings. Elastomer seals also remain capacity-constrained due to chem-spec qualification hurdles, extending lead times across the aircraft fuel systems market.
*Our forecasts treat driver/restraint impacts as directional, not additive. The impact forecasts reflect baseline growth, mix effects, and variable interactions.
Segment Analysis
By Type: Gravity Feed Dominance Faces Digital Disruption
Gravity-feed architectures retained 45.05% of the aircraft fuel systems market share in 2025, underscoring their cost-effective appeal for general aviation and selected military fleets. Within the same period, the aircraft fuel systems market size for fuel-injection platforms advanced at a 6.07% CAGR, the fastest among all types, as operators embraced FADEC-compatible hardware that can trim fuel burn by about 15% through real-time mixture optimization. Pump-feed solutions continued to serve the performance middle ground, supporting airframes that require positive pressure delivery without the full digital overlay.
Suppliers are embedding machine-learning logic into next-gen injectors to predict flow requirements and balance tanks autonomously, turning the fuel circuit into a sensor-rich data source. Safran’s FADEC 4 illustrates the leap, delivering 10 times greater processing power than earlier units while elevating overall efficiency. As IoT connectivity spreads across flight decks, traditional gravity systems face competitive pressure from injection assemblies that promise tighter consumption control, predictive health monitoring, and lower lifecycle cost, accelerating the technology shift within the broader aircraft fuel systems market.


By Component: Inserting Systems Lead Safety Evolution
Fuel tanks held the largest 36.15% revenue share in 2025. Nonetheless, inerting assemblies—spanning nitrogen generators, membranes, and distribution plumbing—advanced at a 5.55% CAGR on the back of mandatory retrofit programs. The aircraft fuel systems market size for inerting solutions stood near USD 1.86 billion in 2026 and is on track to exceed USD 2.48 billion by decade-end. Operators accept higher capital costs in exchange for flammability-exposure compliance and insurance benefits.
Variable-speed electric pumps and smart motor-operated valves augment safety by harmonising tank pressures during inert gas injection. Coupled with embedded oxygen sensors, these systems notify crews or maintenance teams when purity drifts outside thresholds, reinforcing the aircraft fuel systems market's emphasis on real-time data visibility.
By Aircraft Class: UAVs Reshape Market Dynamics
Commercial airliners contributed 59.62% of 2025 revenue, mirroring fleet size dominance. Yet UAV platforms, posting 7.55% CAGR, redefine requirements: autonomous endurance flights necessitate micro-mass flow controllers and scalable bladder tanks manufactured from carbon thermoplastics. The aircraft fuel systems market share of UAVs is projected to double by 2031 as defence ministries procure high-payload tankers and civil operators deploy large cargo drones.
Military jets similarly progress through spiral upgrades, incorporating crash-resistant conformal tanks that extend range without external pods. Rotorcraft programs follow suit, focusing on seal integrity and suction performance under negative-g events.
By End Use: Aftermarket Gains Momentum
Due to new build deliveries, OEM channels kept a 65.02% share in 2025. Yet the aftermarket tallies a faster 6.28% growth trajectory, fuelled by ageing narrow-body fleets and extended heavy-check intervals. Airlines embrace condition-based replacement, triggering component demand peaks outside traditional D-check cycles.
Global MRO providers invest in dedicated fuel accessory cells and contamination-test benches, capturing margin from proprietary overhaul kits supplied by original designers. As predictive maintenance penetrates, data subscription services form an ancillary revenue stream within the aircraft fuel systems market.
By Technology: Smart Systems Transform Operations
Smart or connected solutions, marrying IoT gateways with health-monitoring logic, already illustrate a 6.61% CAGR. Although conventional mechanical builds maintain a 39.45% revenue share, forward orders increasingly specify digital-ready options compatible with airline e-logbook platforms. On-wing software updates extend functionality without hardware swaps, highlighting recurring-license potential inside the aircraft fuel systems industry.
FADEC-integrated electric systems gain traction on next-generation turbofans, exploiting variable-frequency power networks to modulate pump speeds and lower parasitic draw.
Geography Analysis
Asia-Pacific’s aviation services outlay will rise from USD 52 billion in 2025 to USD 129 billion in 2043, implying compound 4.81% growth and a proportional uptick in fuel system spares. Maintenance spend alone accelerates at 5.0% yearly, creating space for predictive analytics licensors and specialty seal manufacturers. China’s civil expansion partners with indigenous wide-body programs, pushing the localization of titanium tank fittings. India’s SAF push underlines the need for dual-fuel-compatible seals by 2030, while Singapore’s early 1% SAF blending rule from 2026 makes it a live testbed for filter adaptability.
North America’s 41.98% market share derives from entrenched OEM and MRO ecosystems across Kansas, Washington, and Georgia. The USAF continues to order the F-15EX and KC-46A, locking in steady valve, pump, and hose procurements through 2030. FAA flammability mandates further generate retrofit workscopes for nitrogen generation and monitoring lines.
Europe maintains primacy in environmental regulation. The ReFuelEU Aviation Act begins with 2% SAF by 2025 and scales to 70% by 2050, compelling filter-housing redesigns for bio-derived fuels with higher solvency. Airbus’ partnership with TotalEnergies targets 1.5 million t annual SAF output by 2030, underpinning nozzle, gasket, and seal demand that can withstand novel fuel chemistries.

Competitive Landscape
The aircraft fuel systems market features a moderately concentrated profile where the top five suppliers account for roughly 55-60% of revenue. Parker Hannifin’s aerospace bookings reached USD 7.3 billion by Q3 2025, buoyed by Airbus single-aisle demand and F-35 spares. Safran recorded EUR 7.26 billion (USD 8.51 billion) Q1 2025 revenue, with a 25.1% jump in civil-engine spare-parts turnover that confirms aftermarket resilience.
Strategic realignment continues: Woodward agreed to acquire Safran’s electromechanical actuation unit, broadening its fuel-control heritage just as the GE Aviation-Woodward joint venture scales integrated fuel systems for wide-body engines. Honeywell leverages Connected Maintenance to reduce unscheduled events by 30-50%, translating digital leadership into long-term service agreements.
Emerging opportunities cluster around hydrogen storage, autonomous UAV refuelling, and high-blend SAF lines where incumbent IP positions are less fortified. GKN Aerospace’s participation in the ICEFlight cryogenic hydrogen project signals early moves toward fuel-cell architectures that could reshape competitive hierarchies.[5]GKN Aerospace, “ICEFlight Hydrogen Collaboration,” gknaerospace.com
Aircraft Fuel Systems Industry Leaders
Eaton Corporation plc
Parker-Hannifin Corporation
Safran SA
Woodward, Inc.
Crane Aerospace & Electronics (Crane Company)
- *Disclaimer: Major Players sorted in no particular order

Recent Industry Developments
- June 2025: Honeywell and NTPC Green Energy launched a feasibility study to convert captured CO₂ and green hydrogen into SAF using eFining™ technology.
- June 2025: Lockheed Martin enabled synthetic fuel blends up to 50% for F-16 and C-130 fleets, expanding alternative-fuel operability.
- June 2025: GKN Aerospace joined Airbus’ ICEFlight program to mature cryogenic hydrogen systems for future aircraft.
- March 2025: RTX subsidiaries Pratt & Whitney and Collins Aerospace partnered with JetZero on a blended-wing-body demonstrator that aims to reduce fuel burn by 50%.


Research Methodology Framework and Report Scope
Market Definitions and Key Coverage
Our study defines the aircraft fuel systems market as all integrated assemblies that store, gauge, manage, condition, and feed liquid aviation fuel from tanks to propulsion engines and auxiliary power units across fixed-wing and rotary platforms. The sizing covers complete systems and core components, including tanks, pumps, valves or manifolds, sensors, piping, inerting modules, and electronic control units, sold to original-equipment manufacturers and for in-service replacements.
Scope Exclusion: Stand-alone ground refueling equipment and pipeline-grade aviation fuel infrastructure remain outside this assessment.
Segmentation Overview
- By Type
- Gravity Feed
- Pump Feed
- Fuel Injection Systems
- By Component
- Fuel Tanks
- Fuel Pumps
- Valves and Manifolds
- Gauges and Sensors
- Inerting Systems
- Fuel Filters
- By Aircraft Class
- Commercial Aircraft
- Narrowbody Aircraft
- Widebody Aircraft
- Regional Aircraft
- Military Aircraft
- Combat Aircraft
- Non-Combat Aircraft
- Helicopters
- General Aviation Aircraft
- Business Jets
- Turboprop Aircraft
- Piston Aircraft
- Helicopters
- Unmanned Aerial Vehicles (UAVs)
- Commercial Aircraft
- By End Use
- OEM
- Aftermarket
- By Technology
- Conventional Mechanical Systems
- FADEC-Integrated Electric Systems
- Inerting-Enabled Systems
- Smart/Connected Fuel Systems
- By Geography
- North America
- United States
- Canada
- Mexico
- Europe
- United Kingdom
- Germany
- France
- Russia
- Rest of Europe
- Asia-Pacific
- China
- India
- Japan
- South Korea
- Rest of Asia-Pacific
- South America
- Brazil
- Rest of South America
- Middle East and Africa
- Middle East
- United Arab Emirates
- Saudi Arabia
- Turkey
- Rest of Middle East
- Africa
- Egypt
- South Africa
- Rest of Africa
- Middle East
- North America
Detailed Research Methodology and Data Validation
Primary Research
Structured conversations with air-framer fuel-system engineers, Tier-1 fluid-management suppliers, MRO planners, and regulators across North America, Europe, and Asia provided live price corridors, retrofit intentions, and certification lead times. Insights from these discussions filled disclosure gaps in public filings and anchored our adoption curves for smart, inerting-ready architectures.
Desk Research
We began with open governmental datasets such as FAA type-certificate libraries, EASA airworthiness directives, and UN Comtrade export logs that map aircraft production and parts trade. Trade associations, including the International Air Transport Association and Aerospace Industries Association, offered fleet expansion statistics and cost-per-flight-hour benchmarks. Company 10-K filings, investor decks, and select aerospace patent families (via Questel) helped us benchmark technology penetration and bill-of-material cost shares. News archives on Dow Jones Factiva and shipment tallies from Volza were screened to cross-check quarterly demand spikes and supply risks. The sources cited illustrate, not exhaust, the secondary base that shaped our model.
Market-Sizing & Forecasting
We applied a top-down build, starting with annual aircraft deliveries and active-fleet inventories, which are then multiplied by platform-specific fuel-system bill-of-material values and average replacement cycles. Results are sanity-checked through selective bottom-up roll-ups of supplier revenues and sampled aftermarket part numbers. Key variables feeding the model include narrow-body monthly production rates, average fuel-tank capacity per class, verified pump mean-time-between-overhaul, regional flight-hour growth, and inerting system penetration. A multivariate regression links these drivers to historic value series and projects the 2025-2030 path. Scenario analysis adjusts for alternative sustainable-aviation-fuel uptake. Data voids in minor segments are bridged with calibrated proxies agreed upon during expert calls.
Data Validation & Update Cycle
Outputs undergo variance checks against independent shipment invoices and airline maintenance expense curves before a senior analyst reviews anomalies. Reports refresh yearly, and our team triggers interim revisions when material events, such as OEM production cuts and new airworthiness rulings, shift core assumptions.
Why Our Aircraft Fuel Systems Baseline Commands Reliability
Published numbers often diverge because firms pick different component mixes, currency bases, and refresh cadences.
According to Mordor Intelligence, our disciplined scope alignment and annual primary-source refresh narrow these gaps for decision-makers.
Benchmark comparison
| Market Size | Anonymized source | Primary gap driver |
|---|---|---|
| USD 10.62 B (2025) | Mordor Intelligence | - |
| USD 10.17 B (2025) | Global Consultancy A | Excludes inerting modules and uses 2024 fleet mix without retrofit factor |
| USD 10.46 B (2025) | Industry Journal B | Applies conservative OEM price deflators and omits UAV segment |
| USD 14.00 B (2025) | Analytics Firm C | Adds ground refueling vehicles and counts future hybrid-electric prototypes |
The comparison shows that while headline values look close, underlying scopes differ markedly. Mordor's blend of delivery-driven modeling, timely aftermarket checks, and clear component boundaries offers a balanced, transparent baseline that users can trace and replicate with confidence.


Key Questions Answered in the Report
What is the growth outlook for the aircraft fuel systems market by 2031?
The aircraft fuel systems market is projected to rise from USD 11.09 billion in 2026 to USD 13.81 billion in 2031, reflecting a 4.47% CAGR over 2026-2031.
Which region is expanding the fastest?
Asia-Pacific is forecasted to post a 5.55% CAGR, driven by large commercial fleet additions and growing defence budgets.
How significant is the aftermarket compared with OEM deliveries?
OEM sales still lead with 65.02% revenue share in 2025, yet the aftermarket is growing faster at 6.28% CAGR thanks to predictive maintenance and life-extension programs.
What technology segment shows the highest growth?
Smart/connected fuel systems lead with a 6.61% CAGR as airlines adopt data-rich solutions for predictive health monitoring.
Why are nitrogen-inerting systems gaining traction?
FAA flammability rules require operators to limit tank exposure, prompting a retrofit wave that positions inerting assemblies as the fastest-growing component category at 5.55% CAGR.
How will UAV adoption influence future demand?
UAV fuel systems exhibit a 7.55% CAGR because autonomy and long-endurance missions demand lightweight, highly automated tanks and flow-control hardware.
Page last updated on:


