Air Traffic Control Equipment Market Size and Share
Market Overview
| Study Period | 2020 - 2031 |
|---|---|
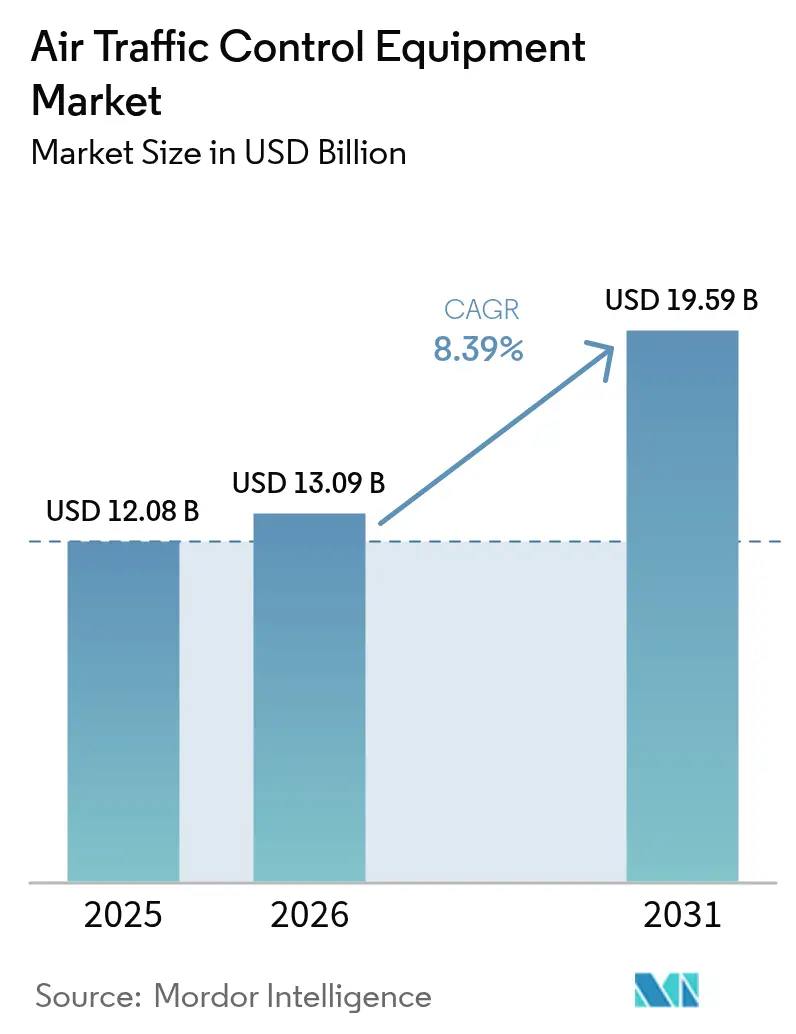
| Market Size (2026) | USD 13.09 Billion |
| Market Size (2031) | USD 19.59 Billion |
| Growth Rate (2026 - 2031) | 8.39% CAGR |
| Fastest Growing Market | Asia-Pacific |
| Largest Market | North America |
| Market Concentration | Medium |
Major Players *Disclaimer: Major Players sorted in no particular order Image © Mordor Intelligence. Reuse requires attribution under CC BY 4.0. | |
Air Traffic Control Equipment Market Analysis by Mordor Intelligence
The air traffic control equipment market size was valued at USD 12.08 billion in 2025 and estimated to grow from USD 13.09 billion in 2026 to reach USD 19.59 billion by 2031, at a CAGR of 8.39% during the forecast period (2026-2031). The air traffic control equipment market is gaining momentum as countries upgrade their airspace systems to handle heavier traffic and strengthen safety. Public investment sits at the center of this shift. The Federal Aviation Administration allocated USD 15 billion in the United States to replace aging radars and radios, laying the groundwork for next-generation control networks. Across Asia, national programs are driving similar change. India’s One Airspace plan seeks to unify civil and military operations, while China is increasing spending on advanced surveillance and automation to meet rising flight demand. These initiatives point to a broader move toward automated, digital, and integrated monitoring that improves situational awareness and smooths traffic flows. Demand from civil aviation and defense agencies supports steady growth and continued innovation in the market.
Key Report Takeaways
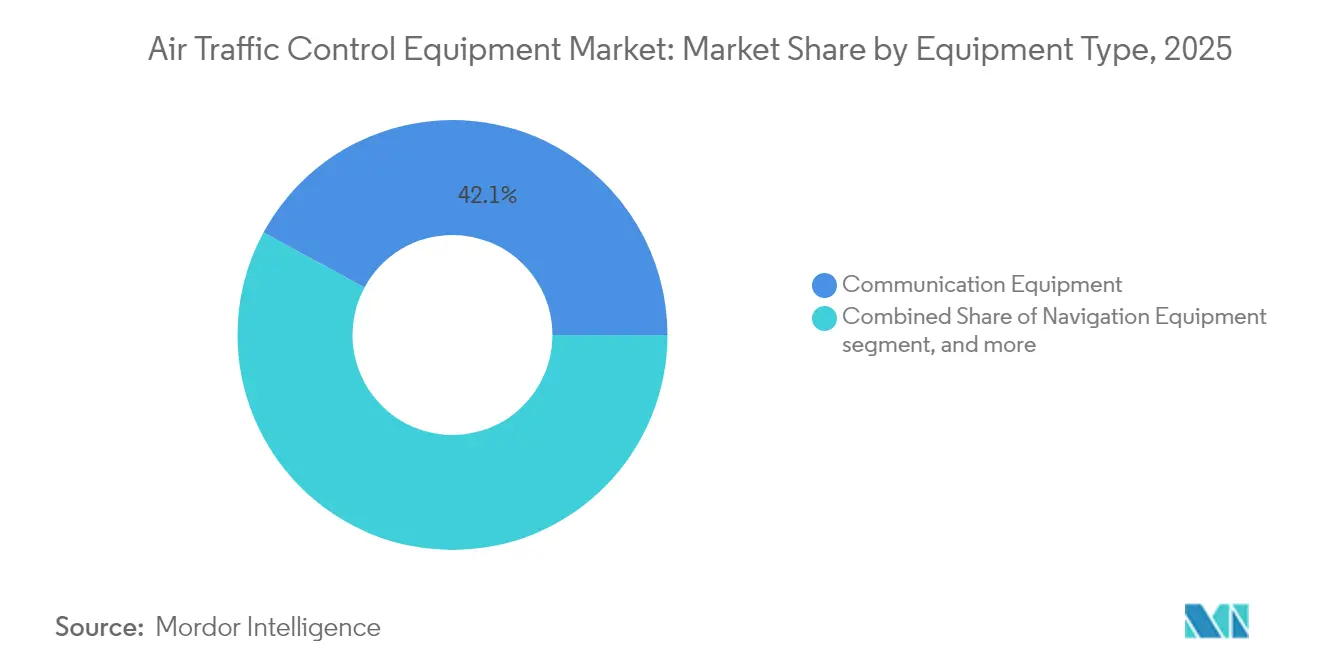
- By equipment type, communication systems led with 42.10% of ATC equipment market share in 2025; remote and digital tower modules are on track for an 10.86% CAGR through 2031.
- By end user, commercial aviation accounted for 66.00% of the ATC equipment market size in 2025, while military applications are advancing at a 9.70% CAGR to 2031.
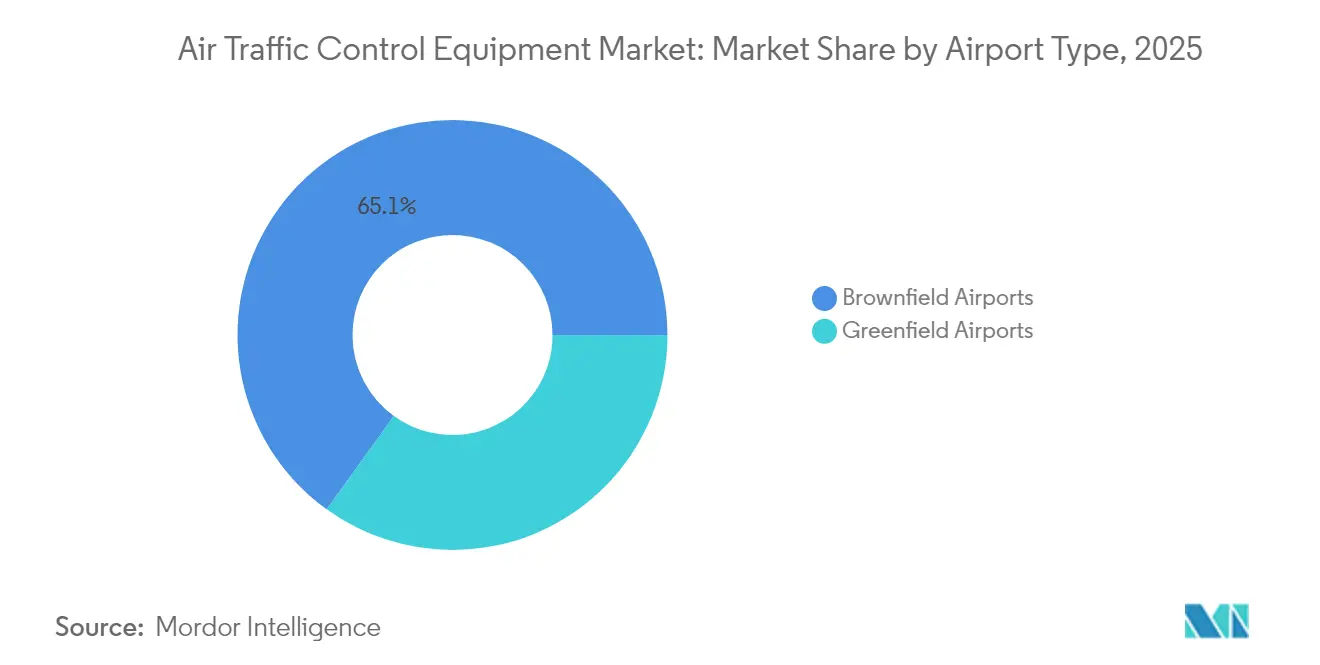
- By airport type, brownfield modernization commanded 65.05% revenue share in 2025; greenfield sites are expanding at a 9.25% CAGR through 2031.
- By investment category, modernization projects represented 58.10% of the ATC equipment market in 2025; new installations are projected to grow at a 9.30% CAGR.
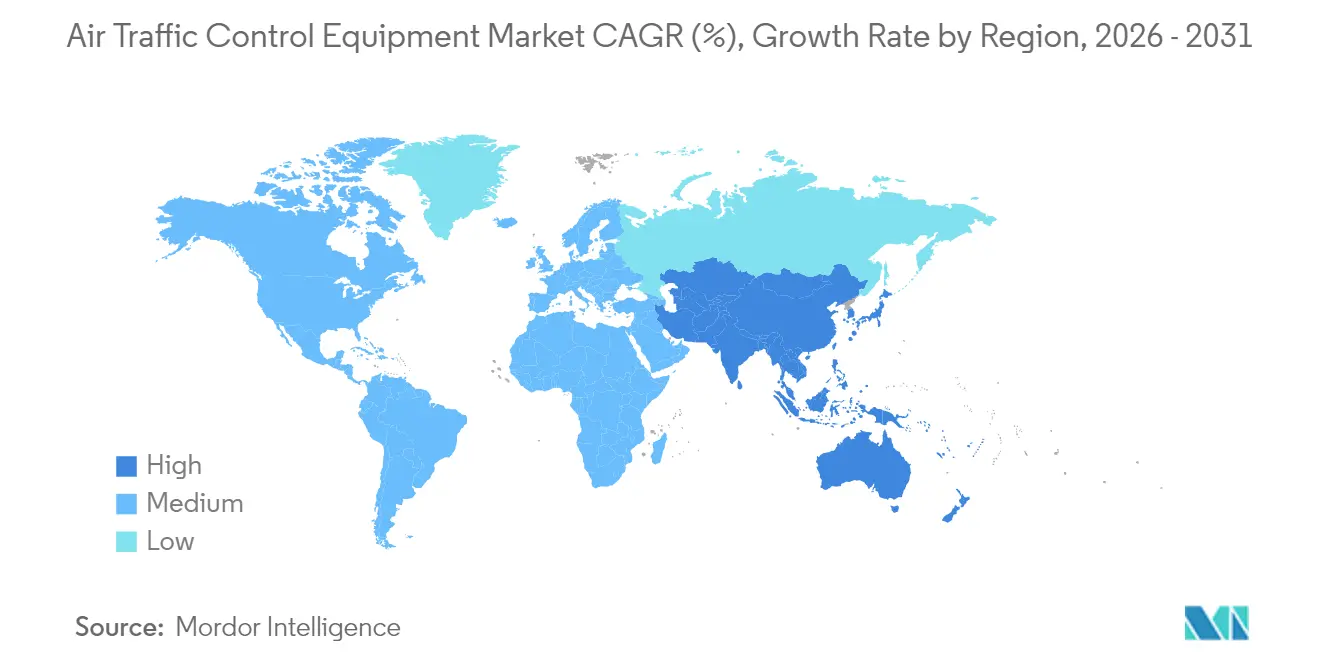
- By region, North America held 40.20% of 2025 revenue; Asia-Pacific is forecasted to log the highest 10.35% CAGR.
Note: Market size and forecast figures in this report are generated using Mordor Intelligence’s proprietary estimation framework, updated with the latest available data and insights as of 2026.
Market Trends and Insights
Drivers Impact Analysis of Air Traffic Control Equipment Market*
| Driver | (~) % Impact on CAGR Forecast | Geographic Relevance | Impact Timeline |
|---|---|---|---|
| NextGen and SESAR-funded digitalization wave | 2.1% | Global, with concentration in North America and EU | Medium term (2-4 years) |
| Mandated ADS-B Out deadlines | 1.8% | North America and EU, spillover to APAC | Short term (≤ 2 years) |
| Remote/digital tower adoption at secondary airports | 1.5% | Global, particularly Nordic countries and Australia | Medium term (2-4 years) |
| Integration of UAS-traffic-management (UTM) hardware | 1.3% | APAC core, early adoption in North America | Long term (≥ 4 years) |
| AI-driven predictive airspace management platforms | 1.2% | North America and EU leading, APAC following | Medium term (2-4 years) |
| Green-flight-corridor demand for trajectory-based ops | 0.9% | EU primary focus, global adoption emerging | Long term (≥ 4 years) |
| Source: Mordor Intelligence | |||
NextGen and SESAR-funded digitalization wave
The European ATM Master Plan estimated a EUR 17 return per unit investment by 2050, encouraging authorities to channel budgets toward cloud-native, interoperable architectures. Parallel US NextGen programs prioritized satellite-based navigation, time-based flow management, and digital voice switching, locking in multiyear orders for platform suppliers.[1]Source: FAA, “AI Safety Assurance Roadmap,” faa.gov Top-tier vendors responded with Kubernetes-enabled open systems that simplify software updates and facilitate remote maintenance.
Mandated ADS-B Out deadlines
Twelve countries enforced ADS-B for defined airspace bands, sustaining retrofit demand for transponders and associated ground receivers. The FAA leveraged ADS-B data in its Surface Awareness Initiative to cut runway incursions, awarding Indra authority to roll out AeroBOSS at more than 450 airports. Europe advanced ADS-C common services under the Digital Sky framework, widening the surveillance data ecosystem.[2]Source: SESAR Joint Undertaking, “Dynamic Airspace Reconfiguration,” sesarju.eu
Remote/digital tower adoption at secondary airports
Norway’s Avinor remotely managed 21 aerodromes from one center, validating cost savings that prompted Australia to commit to a fully digital tower for Western Sydney International by mid-2026. Frequentis delivered the first US Department of Defense digital tower, proving scalability for multi-site military operations.
AI-driven predictive airspace management platforms
EUROCONTROL’s ASTRA project forecast congestion an hour in advance, while Heathrow’s AIMEE system recaptured 20% capacity lost to fog, illustrating measurable slot-use gains. The FAA’s AI Safety Assurance Roadmap sets certification pathways for machine-learning functions in design, production, and maintenance, removing a key adoption barrier.
Restraints Impact Analysis of Air Traffic Control Equipment Market*
| Restraint | (~) % Impact on CAGR Forecast | Geographic Relevance | Impact Timeline |
|---|---|---|---|
| High CAPEX and lengthy certification cycles | -1.9% | Global, particularly stringent in EU and North America | Long term (≥ 4 years) |
| Legacy-system interoperability bottlenecks | -1.4% | North America and EU legacy infrastructure | Medium term (2-4 years) |
| Escalating cyber-security liability on IP-based VCS | -1.1% | Global, heightened in developed markets | Short term (≤ 2 years) |
| Urban-corridor RF-spectrum congestion | -0.8% | Dense urban areas globally, acute in APAC megacities | Medium term (2-4 years) |
| Source: Mordor Intelligence | |||
High CAPEX and lengthy certification cycles
The US Government Accountability Office found 37% of FAA systems unsustainable, yet replacement projects often faced multi-year certification hurdles that slowed spending draws.[3]Source: US Government Accountability Office, “Air Traffic Control Modernization Challenges,” gao.gov European EASA Regulation 2023/1769 imposed design-organization approvals on ATM equipment, extending development timelines for small suppliers.
Legacy-system interoperability bottlenecks
Only 36% of control centers were IP-connected in 2024, exposing gaps when merging analog radios with Voice-over-IP routers. Gateway solutions such as Morcom’s CRU995 enabled phased cut-over but lengthened project roadmaps and raised cybersecurity risk, necessitating extra encryption layers.
*Our forecasts treat driver/restraint impacts as directional, not additive. The impact forecasts reflect baseline growth, mix effects, and variable interactions.
Air Traffic Control Equipment Market Segment Analysis
By Equipment Type:
Communication Systems Maintain Lead While Digital Towers SurgeCommunication platforms represented 42.10% of 2025 revenue in the ATC equipment market, underlining the centrality of resilient voice channels and data links. Indra’s USD 244.3 million FAA award to supply 46,000 dual-mode digital radios illustrated replacement momentum for aging analog fleets. Vendors such as Frequentis controlled a 30% share of global controller positions, highlighting the scale economies enjoyed by established providers.
Although remote and digital tower modules account for only 5.45% of 2025 revenue, they are forecast to post the fastest 10.86% CAGR as airports consolidate surveillance under multi-airport centers. The transition reduced staffing costs by up to 30% at Nordic regional fields, bolstering return on invested capital and encouraging regulators to certify low-visibility operations using 4K sensors.


By End User:
Commercial Aviation Dominates But Defense Drives GrowthCommercial carriers generated 66.00% of 2025 revenue for the ATC equipment market thanks to the rebound in global passenger demand and mandatory ADS-B equipage. Boeing projected Africa’s fleet to double by 2043, indicating persistent downstream demand for tower, radar, and data-link upgrades. At the same time, defense agencies accelerated procurements, lifting military revenue at a 9.70% CAGR from 2026 to 2031. A USD 472 million US Air Force order for 19 TPY-4 radars underscored the size of modernization contracts flowing into the segment.
Military applications are mirroring layered air defense priorities. Convergence between civil and defense requirements around cybersecurity, artificial intelligence, and UTM hardware continues to blur supplier boundaries and open cross-selling opportunities for integrated platform vendors.
By Airport Type:
Brownfield Upgrades Dominate While Greenfield Sites Showcase InnovationBrownfield hubs accounted for 65.05% of 2025 revenue in the ATC equipment market, reflecting decades-old infrastructure needing subsystem replacement while maintaining 24/7 operations. The FAA’s roadmap to overhaul 4,600 sites and erect six new control centers confirmed the sheer scope of deferred maintenance at legacy airports.
Though smaller, Greenfield airports are advancing at a 9.25% CAGR. Western Sydney International’s decision to run a fully digital tower from an off-site control center exemplified the blank-sheet approach that bypasses legacy constraints. Projects in Riyadh and Dubai, worth more than USD 85 billion combined, have likewise specified cloud-ready automation suites that align with net-zero operating mandates.
By Investment Category:
Modernization Rules Yet New Installations ClimbModernization captured 58.10% of 2025 spending in the ATC equipment market as aging consoles, interfaces, and primary radars neared the end of life. Indra’s upgrade of five Argentine centers with ManagAir automation provided a template for phased deployment that avoided service interruptions.
New installations are rising 9.30% annually, driven by regional passenger growth and unmanned-traffic corridors that demand standalone surveillance nodes. Thales partnered with Skyguide to introduce an open-architecture OpenSky platform that supports containerized applications, reducing hardware footprints for greenfield projects.
Geography Analysis
North America Air Traffic Control Equipment Market
North America retained 40.20% of 2025 revenue in the ATC equipment market, anchored by the FAA’s USD 15 billion blueprint for digital voice switching, radar replacement, and tower construction. NAV CANADA invested in Digital Aerodrome Air Traffic Services to remotely manage isolated aerodromes, reinforcing the region’s leadership in operational innovation.
APAC Air Traffic Control Equipment Market
Asia-Pacific registered the highest regional growth at 10.35% CAGR. India’s “One Airspace” initiative unified 2.8 million nmi² under a single national system, while China accelerated CNS/ATM roll-outs in tandem with new runways at major hubs. Australia’s early adoption of off-site tower technology further boosted regional momentum.
EMEA and LATAM Air Traffic Control Equipment Market
Europe progressed on schedule with the SESAR 3 program, channeling EUR 30 billion into Digital Sky projects that promise 400 million tonnes of CO₂ savings by 2050. The Middle East and Africa showed pockets of intense spending, led by USD 1 trillion of airport expansions across Dubai, Riyadh, and Doha. Latin America benefited from Indra’s modernization of 70% of the region’s control centers, though funding constraints moderated its growth trajectory.

Regulatory Landscape
Global ATC equipment demand is shaped by harmonized safety and interoperability rules led by ICAO Standards and Recommended Practices (SARPs) and state oversight audits. ICAO updated its Universal Safety Oversight Audit Program (USOAP) Protocol Questions in 2024, adding new audit areas for State Safety Programme and revising air navigation services oversight protocols, increasing compliance scrutiny on CNS/ATM equipment implementation and documentation.
In Europe, the Single European Sky framework strengthened governance and certification requirements. Regulation (EU) 2024/2803 entered into force on 1 December 2024 and introduced stronger independence requirements for National Supervisory Authorities that must be implemented by 2 December 2026, while EASA revised its Easy Access Rules for ATM/ANS in March 2025 to incorporate newer implementing regulations (including Commission Implementing Regulation (EU) 2023/1771 and (EU) 2024/403). Alongside these, ICAO-driven Air Traffic Flow Management (ATFM) provisions mandating ATFM services for controlled airspace and designated aerodromes reinforce the need for standard data exchange and interoperable surveillance and flow-management toolchains across regions.
Value Chain Analysis
The ATC equipment value chain begins with upstream suppliers of safety-critical electronics and RF subsystems (semiconductors, sensors, antennas, power and networking components), followed by OEMs producing communication radios, navigation aids, surveillance radars, and tower/automation hardware. Prime contractors and specialist integrators then combine these into certified end-to-end systems (voice communications systems, radar processing, controller working positions, and tower modules), with deployment typically managed through national ANSPs and government procurement programs. Large, programmatic procurements drive volume through the chain, exemplified by FAA modernization activity tracked via its infrastructure programs that include large counts of radios, digital voice switches, and radar replacements.
Downstream, certification, integration, installation, and commissioning services are critical because new IP-based and data-centric systems must interface with legacy en-route and terminal infrastructure. Bottlenecks concentrate around lengthy procurement and certification cycles, as well as interoperability and cutover complexity when migrating from analog and copper-based networks to digital voice and IP networking. These constraints favor vendors that can deliver turnkey integration, staged migration tooling, and cybersecurity-ready architectures, and they also open partnering pathways where software-focused providers support primes and integrators on flow-management and decision-support layers within modernization programs.
Competitive Landscape
The ATC equipment market displayed moderate concentration. Thales, Indra, and RTX Corporation leveraged decades-long domain relationships to win multi-year framework agreements, yet they faced software-centric rivals that offered cloud-native deployments at lower entry costs. Thales posted a record EUR 25.3 billion (USD 29.33 billion) order book in 2024, with air traffic systems a key contributor.
Indra lifted air traffic management revenue by 63% year-on-year during Q1 2024 after closing a USD 244.3 million US digital-radio contract and signing Canadian defense upgrades. Lockheed Martin advanced its presence with the TPY-4 AESA radar, securing multinational contracts in the United States and Sweden, emphasizing modular software updates and multi-mission capabilities.
Emerging competitors specialized in artificial intelligence and cybersecurity. NoamAI unveiled an AI-augmented controller-support suite at Airspace World 2025, while Searidge’s virtual-ramp modules integrated video analytics to improve turnaround performance at JFK’s Terminal One. The shift from capital sales to service-based subscriptions encouraged incumbents to bundle analytics, cybersecurity and lifecycle support into predictive-maintenance packages.
Air Traffic Control Equipment Industry Leaders
Thales Group
Indra Sistemas S.A.
RTX Corporation
L3HarrisTechnologies, Inc.
Frequentis AG
- *Disclaimer: Major Players sorted in no particular order
Air Traffic Control Equipment Market Companies Covered in this Report
- Thales Group
- IndraSistemas S.A.
- RTX Corporation
- L3Harris Technologies, Inc.
- SITA N.V.
- Honeywell International Inc.
- Frequentis AG
- ACAMS AS
- Searidge Technologies
- Saab AB
- Rohde & Schwarz USA, Inc. (Rohde & Schwarz GmbH & Co. KG)
- General Dynamics Mission Systems, Inc. (General Dynamics Corporation)
- Leonardo S.p.A
- NEC Corporation
- Intelcan Technosystems Inc.
- Aquila Air Traffic Management Services Limited
- ARTISYS, s.r.o.
- Leidos Holdings, Inc.

Market Opportunities and Future Outlook
Large, multi-year modernization programs create clear whitespace for high-volume replacement of surveillance, communications, and voice switching hardware plus the integration layers needed to connect them. In the United States, the FAA BNATCS program and related modernization plans define a concrete equipment runway that includes hundreds of radar replacements, tens of thousands of radios, and hundreds of digital voice switches, pushing demand beyond point upgrades toward standardized, repeatable deployment packages and scalable commissioning capabilities.
A second opportunity band is emerging around flow management, trajectory-based operations, and interoperable data exchange, where new equipment deployments increasingly need to be compatible with SWIM/FF-ICE style information sharing and ATFM requirements. ICAO is conducting a global consultation to mandate ATFM services for controlled airspace and designated aerodromes, with a planned review by the Air Navigation Commission in June 2026, encouraging ANSPs to procure or refresh the surveillance and communications foundations that feed automated flow-management tooling. In Europe, EUROCONTROL programs such as Integrated Network Management, with trajectory management functionality moving into new deployment waves starting in 2026, reinforce demand for modernized controller working positions, IP-based voice, and surveillance inputs that can support network-wide operations rather than isolated facility upgrades.
Recent Industry Developments in Air Traffic Control Equipment Market
- July 2026: L3Harris received an FAA contract to modernize airspace surveillance by upgrading more than 700 ground stations to enhance satellite-based flight positioning data. The award strengthens L3Harris presence in nationwide surveillance infrastructure refresh cycles and supports broader transitions toward data-centric monitoring architectures.
- June 2026: The FAA awarded Air Space Intelligence a 12-year, USD 875 million contract to deliver Flow Management Data Services, including the AI-enabled SMART capability for proactive delay identification. The program shifts procurement emphasis toward AI-assisted flow management and increases integration requirements between operational decision tools and legacy ATC infrastructure.
- April 2024: EUROCONTROL and several ANSPs began the first deployment wave of the Integrated Network Management program, enabling improved trajectory-based operations and interoperable data sharing across European ATM networks. The effort consolidated network-wide surveillance and data exchange foundations to support scalable deployments and cross-border coordination.


Air Traffic Control Equipment Market Report Scope and Research Methodology
Segments Covered in This Report
- By Equipment Type
- Communication Equipment
- Navigation Equipment
- Surveillance/Automation Systems
- Remote / Digital Tower Modules
- By End User
- Commercial
- Military
- By Airport Type
- Brownfield Airports
- Greenfield Airports
- By Investment Category
- New Installations
- Modernization and Upgradation
- By Region
- North America
- United States
- Canada
- Mexico
- Europe
- Germany
- United Kingdom
- France
- Russia
- Rest of Europe
- Asia-Pacific
- China
- Japan
- India
- South Korea
- Australia
- Rest of Asia-Pacific
- South America
- Brazil
- Rest of South America
- Middle East and Africa
- Middle East
- United Arab Emirates
- Saudi Arabia
- Turkey
- Rest of Middle East
- Africa
- South Africa
- Rest of Africa
- Middle East
- North America


Key Questions Answered in the Report
What is the current size of the ATC equipment market?
The ATC equipment market was valued at USD 13.09 billion in 2026 and is forecasted to reach USD 19.59 billion by 2031, reflecting an 8.39% CAGR.
Which region leads ATC equipment spending?
North America held 40.20% of global revenue in 2025, propelled by the FAA’s USD 15 billion modernization plan.
Why are digital towers gaining traction?
Digital or remote towers cut staffing costs and allow multiple small airports to be managed from one center, driving an 10.86% CAGR for this segment.
How do ADS-B mandates influence demand?
Mandatory ADS-B Out equipage created sustained retrofit sales for transponders and surveillance ground stations, lifting the market’s CAGR by about 1.8%.
What role does artificial intelligence play in air traffic control?
AI platforms forecast congestion, optimize sequences and restore capacity lost to weather, with live trials at Heathrow demonstrating 20% efficiency gains.
Which companies dominate the competitive landscape?
Thales Group, Indra Sistemas S.A., and RTX Corporation are among the leaders, supported by rising orders for fully integrated communication, surveillance and automation suites.
Page last updated on:


