Market Overview
| Study Period | 2021 - 2031 |
|---|---|
| Forecast Data Period | 2026 - 2031 |
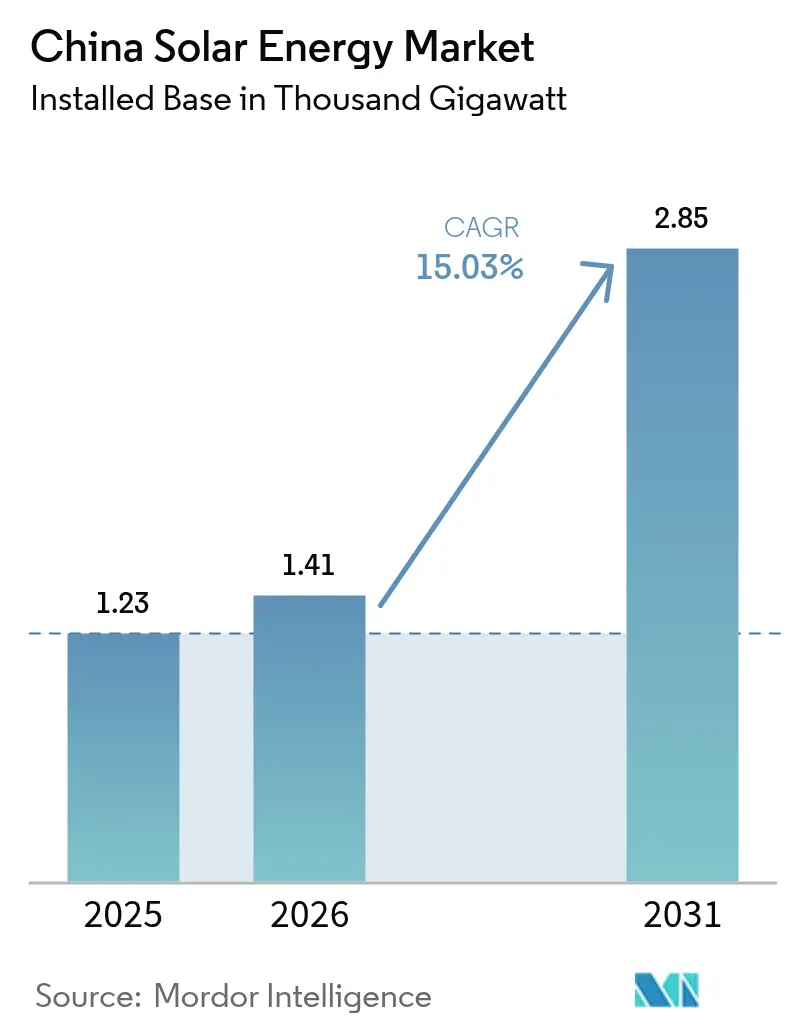
| Base Year Market Size (2025) | 1.23 Thousand gigawatt |
| Market Volume (2026) | 1.41 Thousand gigawatt |
| Market Volume (2031) | 2.85 Thousand gigawatt |
| Growth Rate (2026 - 2031) | 15.03% CAGR |
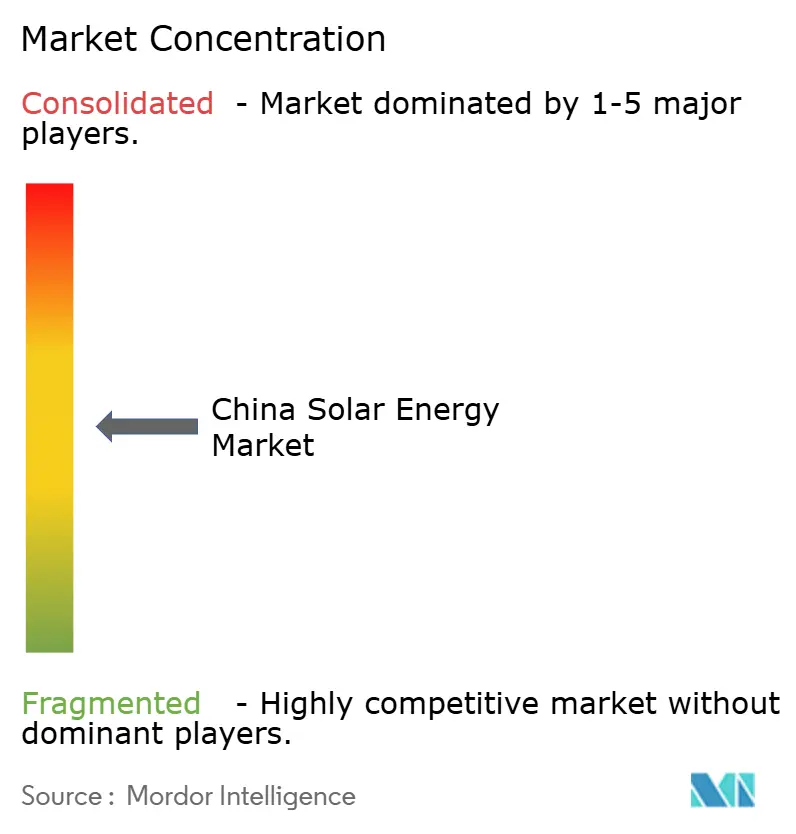
| Market Concentration | Medium |
Major Players *Disclaimer: Major Players sorted in no particular order Image © Mordor Intelligence. Reuse requires attribution under CC BY 4.0. | |
China Solar Energy Market Analysis by Mordor Intelligence
China Solar Energy Market size in 2026 is estimated at 1.41 Thousand gigawatt, growing from 2025 value of 1.23 Thousand gigawatt with 2031 projections showing 2.85 Thousand gigawatt, growing at 15.03% CAGR over 2026-2031.
Accelerated deployment under the 14th Five-Year Plan, record-low module prices, and an expanding corporate PPA ecosystem keep growth momentum high. Rapid improvement in N-type cell efficiency, ultra-high voltage transmission build-out, and policies mandating rooftop systems on public buildings create new project pipelines. At the same time, grid congestion in northwestern provinces, the incoming market-based tariff regime, and intensifying global trade barriers pose structural headwinds. Nonetheless, continued innovation and policy coordination position the Chinese solar energy market to remain the world’s largest renewable-power arena through 2030.
Key Report Takeaways
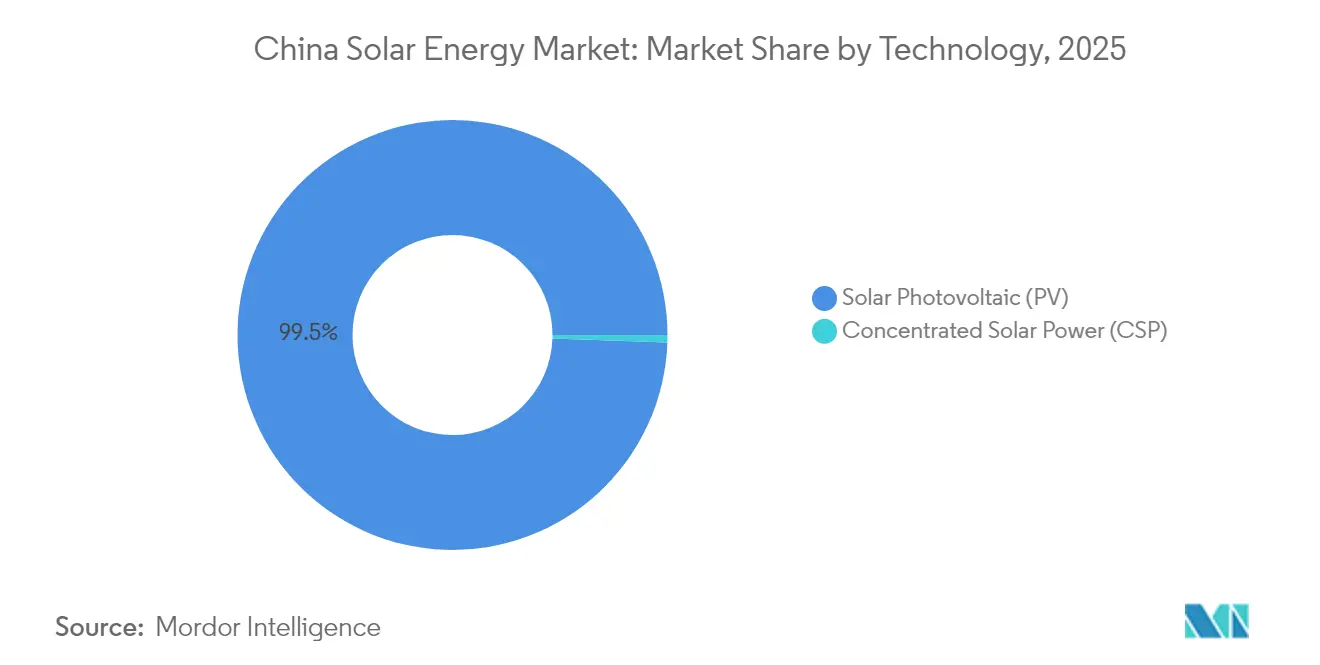
- By technology, solar photovoltaic commanded 99.45% of China's solar energy market share in 2025, while concentrated solar power is forecast to grow at a 18.95% CAGR through 2031.
- By connection type, on-grid installations led with 90.62% of the China solar energy market size in 2025, and this category is projected to expand at a 15.62% CAGR to 2031.
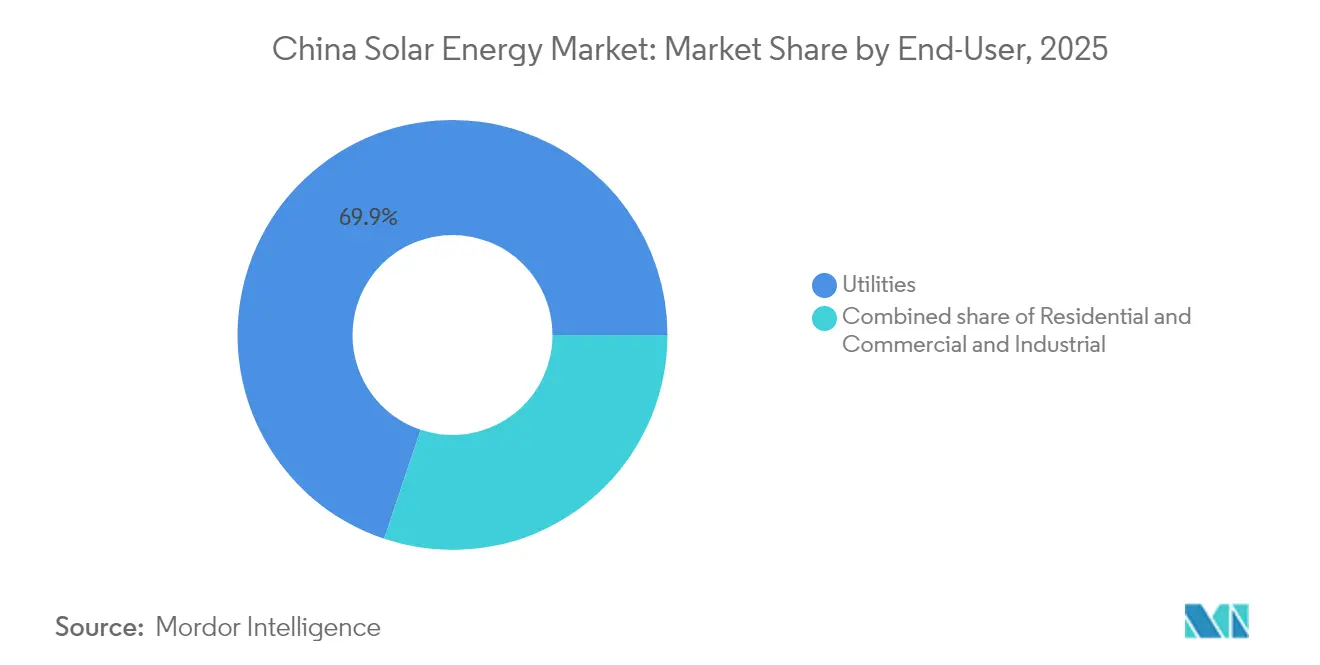
- By end-user, utility-scale plants held 69.85% of the Chinese solar energy market share in 2025, yet commercial and industrial rooftops are advancing at the fastest 16.32% CAGR through 2031.
- By geography, the Northwest provinces jointly captured 54.60% of the installed capacity in 2025.
- LONGi, Trina Solar, JinkoSolar, JA Solar, and Tongwei together supplied 55% of domestic shipments in 2024, underlining a moderately concentrated competitive arena.
Note: Market size and forecast figures in this report are generated using Mordor Intelligence’s proprietary estimation framework, updated with the latest available data and insights as of 2026.
China Solar Energy Market Trends and Insights
Drivers Impact Analysis*
| Driver | (~) % Impact on CAGR Forecast | Geographic Relevance | Impact Timeline |
|---|---|---|---|
| Record-low module prices cut LCOE | +3.2% | Nationwide, strongest in Qinghai, Inner Mongolia, Xinjiang | Short term (≤ 2 years) |
| 14th Five-Year Plan capacity targets | +2.8% | Nationwide, coordinated by provincial energy bureaus | Medium term (2-4 years) |
| Corporate PPAs and green-power trading boom | +2.1% | Jiangsu, Zhejiang, Guangdong, expanding to central provinces | Medium term (2-4 years) |
| Mandatory rooftop PV on new public buildings | +1.6% | Tier-1 and Tier-2 cities, provincial capitals | Long term (≥ 4 years) |
| Grid-friendly inverter retrofits policy | +1.4% | National, prioritizing high-penetration regions in eastern and southern China | Medium term (2-4 years) |
| CSP-plus-storage subsidy scheme | +1.3% | Northwestern China, focusing on Gansu, Xinjiang, and Inner Mongolia desert regions | Long term (≥ 4 years) |
| Source: Mordor Intelligence | |||
Record-Low Module Prices Drive LCOE Competitiveness
Module prices fell to RMB 0.75/W in early 2024 after China’s manufacturing capacity ballooned to 861 GW against global demand of 600 GW.[1]PV Magazine Editorial Team, “China module prices hit record low,” pv-magazine.com Cost leadership pushed solar LCOE below coal in more than 25 provinces, prompting developers to accelerate gigawatt-scale projects without subsidies. Industry consolidation is inevitable, yet leading firms such as LONGi and JinkoSolar benefit from N-type TOPCon lines that preserve margins.
14th Five-Year Plan Targets Accelerate Capacity Expansion
The 14th Five-Year Plan set a 1,200 GW renewable goal by 2025, with solar expected to add more than 600 GW, spurring provincial quotas of 50 GW in Shandong, 40 GW in Henan, and 35 GW in Jiangsu. Bundling mandates that pair every 1 GW of solar with 200 MW of coal or 100 MW of storage raise project capital costs by up to 20%, channeling market share toward vertically integrated developers able to internalize key inputs.
Corporate PPA Market Transforms Energy Procurement
Transaction volume in China’s green electricity certificate market jumped fourfold to 446 million units in 2024, with 59,000 corporate buyers led by multinationals such as Apple and BMW. Average certificate prices of CNY 50 (USD 7) per MWh increased project IRRs by 1-2 percentage points and allowed coastal manufacturers to procure renewable energy virtually from Northwest generators, mitigating physical transmission bottlenecks.
Mandatory Rooftop PV Policies Drive Distributed Growth
Building code GB 55015-2021 requires solar arrays on new public and commercial structures larger than 2,000 m², aiming for 100 GW of building-integrated capacity by 2030. Compliance hit 65% in 2024 across Tier-1 cities where occupancy permits hinge on system commissioning, and inverter suppliers have rolled out micro-inverter lines suited to complex roof geometries, capturing 40% of this segment.
Restraints Impact Analysis*
| Restraint | (~) % Impact on CAGR Forecast | Geographic Relevance | Impact Timeline |
|---|---|---|---|
| Grid congestion and curtailment in NW China | -1.8% | Gansu, Qinghai, Xinjiang, Inner Mongolia | Short term (≤ 2 years) |
| Overseas trade barriers to Chinese modules | -2.3% | Export-oriented provinces Jiangsu, Zhejiang, Anhui | Medium term (2-4 years) |
| Feed-in-tariff phase-out & low auction prices | -1.6% | National, with acute pressure on utility-scale developers across all provinces | Short term (≤ 2 years) |
| ESG scrutiny of Xinjiang polysilicon supply | -1.1% | Xinjiang production base, with downstream effects on national supply chain | Long term (≥ 4 years) |
| Source: Mordor Intelligence | |||
Grid Congestion Constrains Northwestern Capacity Utilization
Curtailment has subsided nationally but remains above 5% in parts of Xinjiang and Gansu.[2]Reuters Correspondent, “China struggles with curtailment in northwestern provinces,” reuters.com The Qinghai-Henan ±800 kV UHVDC corridor evacuated 8 GW of clean power in its first year but averaged only 60% utilization because receiving grids saturate during off-peak demand. Mandatory two-hour storage for every 10 MW of new capacity adds USD 0.015 per kWh, squeezing project returns in regions where midday wholesale prices drop below USD 0.03 per kWh.
Overseas Trade Barriers to Chinese Modules
More than 1,000 module shipments were detained by U.S. Customs in 2024 under the Uyghur Forced Labor Prevention Act, creating 4-6-week delays and forcing developers to switch suppliers. The European Commission’s anti-subsidy inquiry could levy tariffs of up to 30% in mid-2025, and India’s 40% basic customs duty has effectively shut a market that absorbed 15 GW of exports in 2023. Chinese producers have responded by setting up 30 GW of final assembly in Vietnam, Thailand, and Malaysia, yet anti-circumvention reviews may soon extend duties to those locations.
*Our forecasts treat driver/restraint impacts as directional, not additive. The impact forecasts reflect baseline growth, mix effects, and variable interactions.
Segment Analysis
By Technology: N-Type Cells Drive PV Dominance
China's solar energy market size for photovoltaic technology stood at 1,223.24 GW in 2025, equaling 99.45% of total installed capacity, while CSP reached 6,760.76 MW. N-type variants, TOPCon, and heterojunction expanded their domestic shipment share from 25% in 2023 to 45% in 2024, encouraged by LONGi's world-leading 27.09% cell efficiency and Trina's 26.5% milestone. CSP is slated to grow at a 18.95% CAGR, buoyed by a feed-in premium of CNY 1.5 (USD 0.21) per kWh that cushions its three-times-higher capex compared with.
Perovskite-silicon tandems touched 33.9% laboratory efficiency in 2024, and pilot lines targeting mass production by 2027 suggest future cost parity with current mono-crystalline units. Hybrid CSP-PV projects under construction in Qinghai, pairing 200 MW of thermal storage with 1 GW of PV, promise four-hour post-sunset dispatch and 2 percentage-point higher IRRs versus standalone PV. Off-grid PV remains below 9% of yearly additions but serves strategic niches such as telecom base stations and border surveillance, where diesel displacement justifies premium pricing


By Connection Type: Grid Parity Cements On-Grid Supremacy
On-grid capacity represented 90.62% of the China solar energy market in 2025 and is forecast to climb at a 15.62% CAGR through 2031 as nearly 455 GW of desert-based projects move forward. Auction clearing prices between USD 0.025 and 0.035 per kWh undercut coal in 20 provinces, locking solar in as the marginal generation source. Fast-tracking rules allowed Jiangsu and Zhejiang grid companies to approve 95% of on-grid applications within 90 days, whereas off-grid systems often wait half a year for compliance inspections.
Off-grid installations are expanding by 12.5% annually in hard-to-reach communities across Tibet, Sichuan, and Yunnan. Financing is frequently backed by the Asian Infrastructure Investment Bank, whose USD 500 million facility aims to electrify 2 million homes but relies on subsidized tariffs capped at USD 0.10 per kWh to maintain affordability. Lithium iron phosphate batteries, now priced at USD 150 per kWh, deliver five-hour autonomy yet require replacement after eight years, affecting the total cost of ownership
By End-User: C&I Rooftops Outpace Utility Growth
Utility-scale projects commanded 69.85% of aggregate capacity in 2025, reflecting 180 GW under the portfolios of state-owned heavyweights such as State Power Investment Corporation and China Three Gorges. However, commercial and industrial rooftops are projected to advance at a 16.32% CAGR, with paybacks of four to six years in Jiangsu, where electricity averages above USD 0.10 per kWh. Zhejiang sweetens the economics by paying CNY 0.3 (USD 0.04) per kWh for surplus exports, while Guangdong exempts rooftop arrays from land-use taxes, trimming capex by 10%.
Residential systems contributed 12% of 2024 additions. “Whole-county” programs in Shandong have connected 1.2 million homes, achieving 8% penetration and supporting household incomes through net-metering credits pegged at 90% of retail tariffs. Shanghai’s more generous crediting further encourages battery pairing, although Hebei’s 50% ratio dampens adoption.
Geography Analysis
Northwestern provinces, Xinjiang, Inner Mongolia, and Qinghai, added more than 40% of new utility PV in 2024, capitalizing on solar insolation above 1,200 kWh/m² and first-year utilization over 900 hours. However, distance from demand centers necessitates heavy-duty UHVDC lines such as the ±800 kV Gansu-Zhejiang corridor that will transmit 40 billion kWh annually on completion in 2027.
Eastern coastal provinces, including Jiangsu, Zhejiang, and Guangdong, collectively surpassed 100 GW of distributed capacity thanks to dense load centers, robust rooftop stock, and favorable net-billing schemes. Shandong’s local grids struggle to absorb midday surpluses, triggering targeted reinforcement and storage incentives that mitigate curtailment. These initiatives diversify growth across the Chinese solar energy market while balancing regional resource disparities.
The Northwest Power Grid delivered 100.5 billion kWh of renewable energy across provincial borders in 2024, representing more than 60% of national long-distance green-power flows. Proactive interconnection planning underpins national carbon-neutrality ambitions and integrates large-scale storage initiatives such as molten-salt CSP in desert hubs. As transmission projects come online, intraregional portfolio balancing should unlock latent capacity reserves, lifting overall utilization in the Chinese solar energy market.
Competitive Landscape
China hosts the world’s largest module suppliers, yet the sector remains moderately concentrated. LONGi, JinkoSolar, and Trina Solar shipped a combined 150 GW in 2024, more than half of global deliveries, but face shrinking gross margins amid oversupply. JinkoSolar reported 25.9 GW shipments in Q3 2024 with 90% N-type, underscoring the rapid technology pivot. LONGi pushed module efficiency to 25.4% and launched selective capacity cuts to manage inventories.
Government rules now require 30% equity for new factory investments and a 26% minimum efficiency threshold for N-type cells, curbing speculative expansions. M&A attempts such as Tongwei’s proposed Runergy takeover illustrate consolidation drives but spotlight financing constraints. Overseas diversification accelerates: JinkoSolar committed USD 990 million for a 10 GW Saudi joint venture, and Drinda allocated USD 700 million for a wafer-cell-module complex in Oman, mitigating tariff exposure while tapping local demand.
Pricing pressure trimmed smaller contenders, yet leading vendors leverage economies of scale, proprietary metallization, and vertically integrated wafer-polysilicon supply. Ongoing R&D in perovskite tandem stacks may open new differentiation channels post-2027, maintaining innovation intensity within the Chinese solar energy market.
China Solar Energy Industry Leaders
LONGi Green Energy
Trina Solar
JA Solar
JinkoSolar
Tongwei Solar
- *Disclaimer: Major Players sorted in no particular order

Recent Industry Developments
- February 2025: Aiko Solar announced a CNY 10 billion investment for a 25 GW TOPCon cell line in Anhui.
- January 2025: The National Energy Administration issued revised distributed PV measures categorizing projects into four classes and simplifying registration.
- October 2024: LONGi achieved 25.4% module efficiency, setting a crystalline-silicon record.
- August 2024: Canadian Solar secured USD 200 million private placement to fund new solar projects.


China Solar Energy Market Report Scope
Solar energy can be defined as a type of renewable energy in which solar panels are used to generate electricity. Solar energy has become the fastest-growing renewable energy source owing to the country's supporting government initiatives and surging investments in renewable energy projects.
The report covers the market size and forecasts for the solar energy market across the segment. For each segment, the market sizing and forecasts have been done based on installed capacity (GW). The China solar energy market report includes:
By Technology
| Solar Photovoltaic (PV) |
| Concentrated Solar Power (CSP) |
By Connection Type
| On-Grid |
| Off-Grid |
By End-User
| Utility-Scale |
| Commercial and Industrial (C&I) |
| Residential |
By Component (Qualitative Analysis)
| Solar Modules/Panels |
| Inverters (String, Central, Micro) |
| Mounting and Tracking Systems |
| Balance-of-System and Electricals |
| Energy Storage and Hybrid Integration |
| By Technology | Solar Photovoltaic (PV) |
| Concentrated Solar Power (CSP) | |
| By Connection Type | On-Grid |
| Off-Grid | |
| By End-User | Utility-Scale |
| Commercial and Industrial (C&I) | |
| Residential | |
| By Component (Qualitative Analysis) | Solar Modules/Panels |
| Inverters (String, Central, Micro) | |
| Mounting and Tracking Systems | |
| Balance-of-System and Electricals | |
| Energy Storage and Hybrid Integration |


Key Questions Answered in the Report
What is the current installed capacity of the China solar energy market?
Installed capacity reached 1,230 GW in 2025 and is set to rise to 1,414.87 GW in 2026.
How fast is capacity expected to grow in the next five years?
The China solar energy market is forecast to expand at a 15.03% CAGR between 2026 and 2031, reaching 2,850.06 GW.
Which segment is growing fastest within China's solar sector?
Commercial and industrial rooftops are projected to grow at 16.32% CAGR through 2031 due to attractive self-consumption economics.
How are trade barriers impacting Chinese solar exports?
Tariffs and forced-labor checks in the United States and Europe have shifted exports toward Southeast Asia and Belt and Road regions, prompting new offshore assembly lines.
What technological trend dominates new capacity additions?
N-type cell architectures such as TOPCon and heterojunction, offering efficiencies above 26%, are rapidly replacing P-type formats.
Why are Northwest provinces critical to future solar growth?
They provide abundant land and high irradiance, hosting 54.60% of utility-scale capacity, and rely on UHV transmission to serve distant demand centers.
Page last updated on:


