Thermophotovoltaics Market Size and Share
Market Overview
| Study Period | 2019 - 2030 |
|---|---|
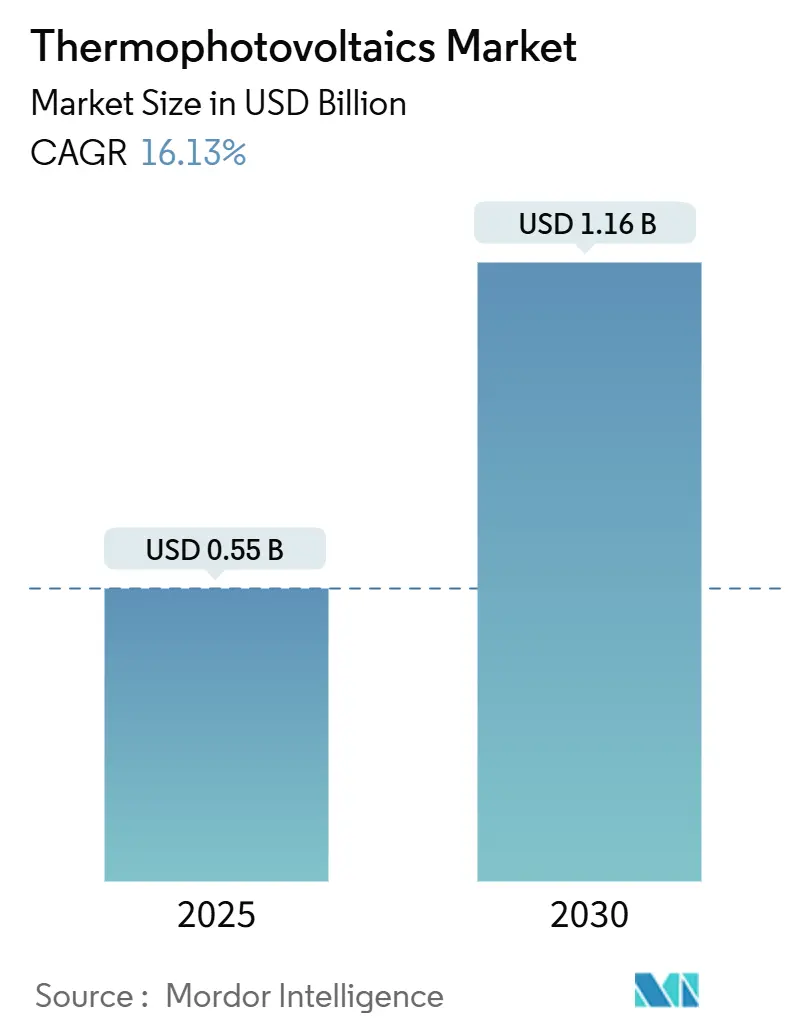
| Market Size (2025) | USD 0.55 Billion |
| Market Size (2030) | USD 1.16 Billion |
| Growth Rate (2025 - 2030) | 16.13% CAGR |
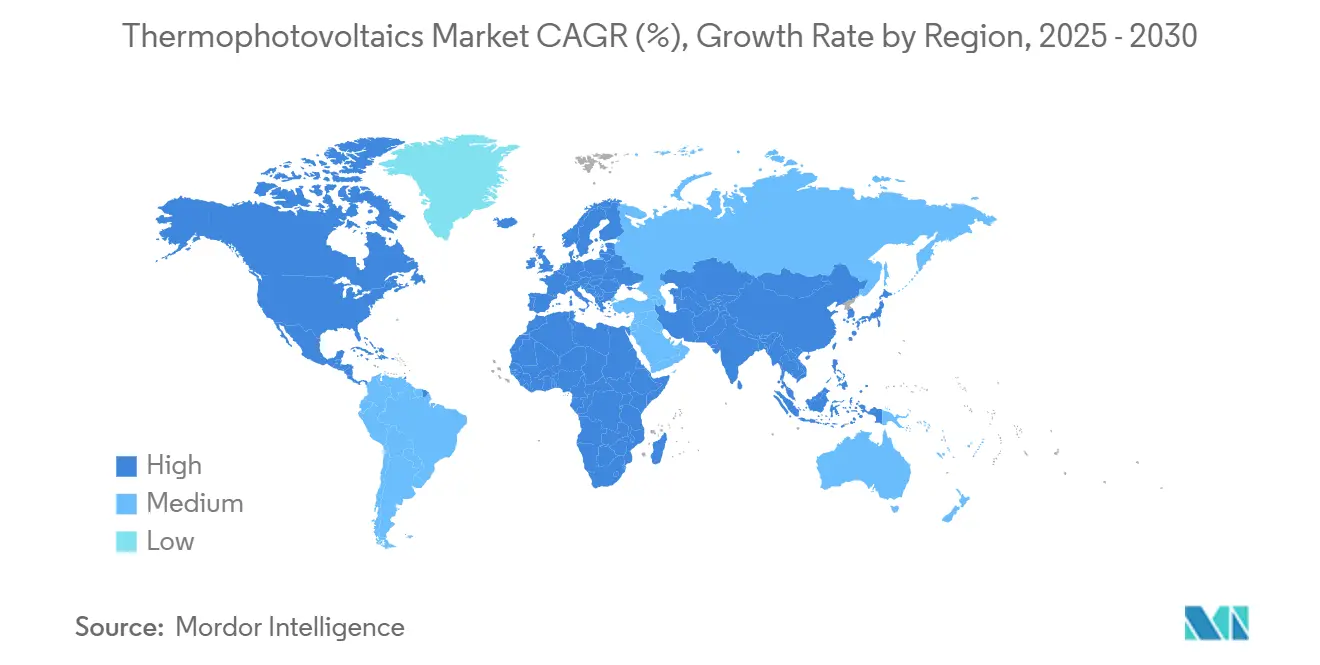
| Fastest Growing Market | North America |
| Largest Market | North America |
| Market Concentration | Medium |
Major Players *Disclaimer: Major Players sorted in no particular order Image © Mordor Intelligence. Reuse requires attribution under CC BY 4.0. | |
Thermophotovoltaics Market Analysis by Mordor Intelligence
The Thermophotovoltaics Market size is estimated at USD 0.55 billion in 2025, and is expected to reach USD 1.16 billion by 2030, at a CAGR of 16.13% during the forecast period (2025-2030).
Breakthrough cell efficiencies above 40%, widening industrial decarbonization mandates, and rising investments in thermal-battery architectures underpin this trajectory. Thermophotovoltaic (TPV) devices deliver power densities up to 500 times that of conventional solar cells while operating without moving parts, making them attractive for waste-heat recovery, distributed generation, and 24/7 renewable-energy storage. The market rewards mid-temperature designs that balance efficiency with material durability, positioning TPV as a near-term complement—not only an alternative—to thermoelectric and organic Rankine solutions. Competitive intensity is strengthening as venture-backed entrants retrofit silicon lines for TPV production and national laboratories license high-efficiency tandem architectures to industrial partners.
Key Report Takeaways
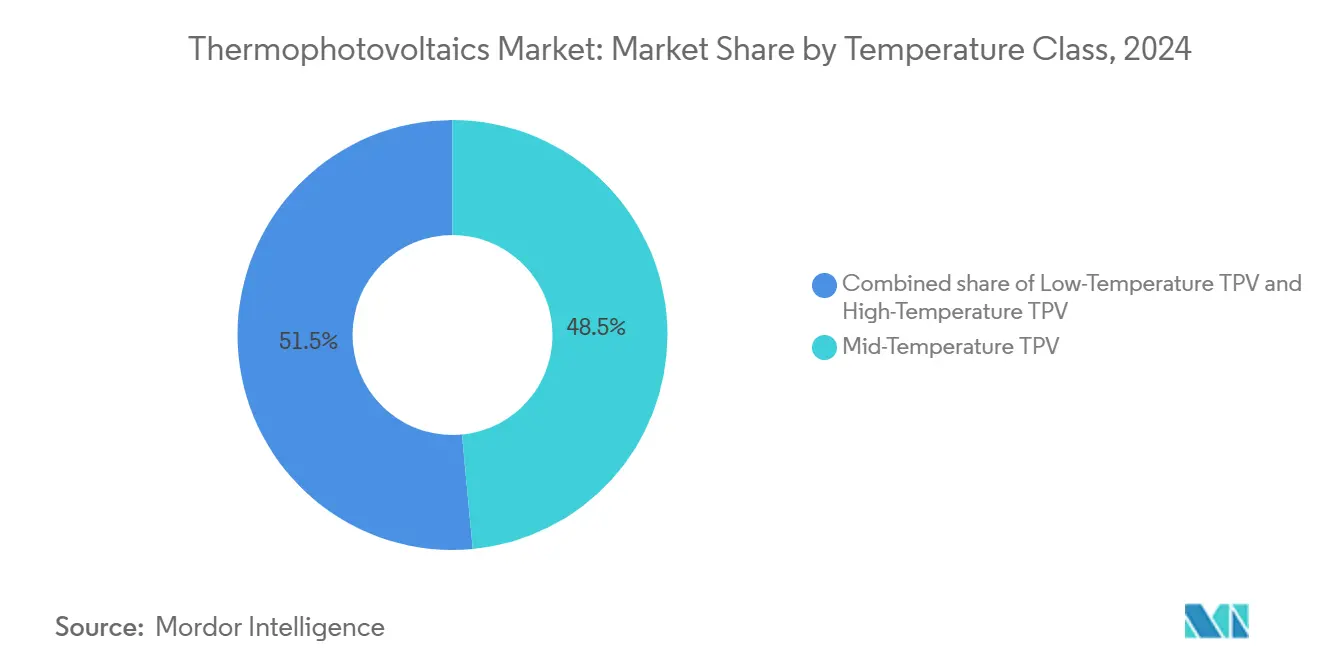
- By temperature class, mid-temperature systems captured 48.5% revenue share in 2024; high-temperature systems pace growth at a 19.7% CAGR to 2030.
- By cell material, GaSb retained 60.1% of the thermophotovoltaics market share in 2024, while InGaAs alloys are set to expand at a 20.8% CAGR through 2030.
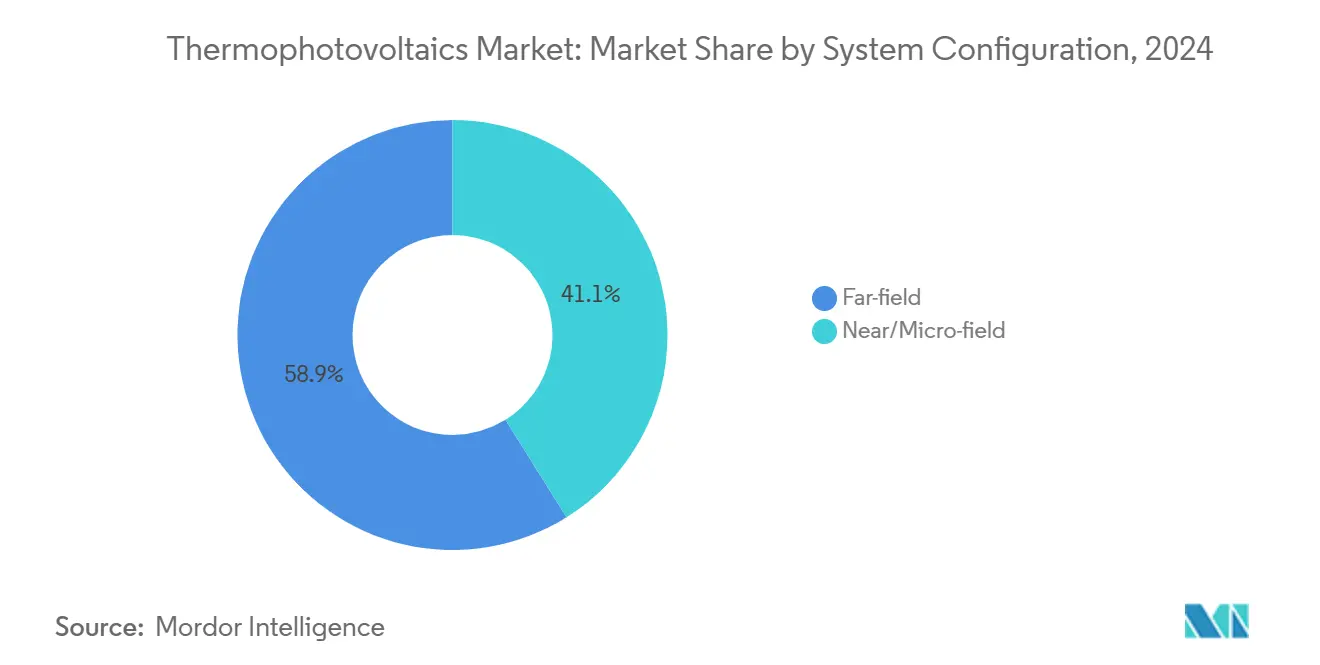
- By system configuration, far-field designs led with 58.9% share in 2024; near-field systems are forecast to increase at 20.1% CAGR.
- By application, industrial waste-heat recovery accounted for 34.8% of the thermophotovoltaics market size in 2024, whereas primary power generation is advancing at a 20.5% CAGR.
- By geography, North America dominated with 45.3% revenue share in 2024, and the region is projected to post a 17.3% CAGR through 2030.
Global Thermophotovoltaics Market Trends and Insights
Drivers Impact Analysis*
| Driver | (~) % Impact on CAGR Forecast | Geographic Relevance | Impact Timeline |
|---|---|---|---|
| Break-through >40% cell efficiency milestones | 4.20% | Global (North America & Europe early adopters) | Medium term (2-4 years) |
| Rising industrial waste-heat recovery spend | 3.80% | Global (Asia-Pacific hubs prominent) | Long term (≥4 years) |
| Thermal-storage paired TPV for 24/7 renewables | 3% | North America & EU expanding to APAC | Long term (≥4 years) |
| Near-field TPV mini-cogeneration architectures | 2.40% | North America & Europe early, APAC scaling | Medium term (2-4 years) |
| Photonic-crystal selective emitters slashing $/W | 1.90% | Advanced economies worldwide | Medium term (2-4 years) |
| Silicon-line retrofits enabling mass production | 1.80% | Global (APAC manufacturing leadership) | Short term (≤2 years) |
| Source: Mordor Intelligence | |||
Break-through >40% Cell Efficiency Milestones Drive Commercial Viability
Record 41.1%–44% conversion efficiencies demonstrated by MIT, NREL, and the University of Michigan in 2024 reposition TPV from laboratory curiosity to utility-scale option.[1]“41.1% TPV record by MIT and NREL,” nrel.govAntora Energy scaled these advances, inaugurating a 2 MW-per-year facility that ships cells exceeding 40% efficiency. Devices now attain 3.78 W/cm² at 1,850 °C, comparable with steam-turbine benchmarks yet with silent, solid-state operation. Higher power density cuts radiator mass, improving the feasibility for thermal-battery storage that smooths renewable output. Efficiency leadership is therefore the single most powerful catalyst for near-term market acceleration.
Rising Industrial Waste-Heat Recovery Spend Accelerates Adoption
Steel, cement, and chemical plants now allocate larger capex to capture thermal losses that historically topped 50% of input energy.[2]“Industrial heat losses and decarbonization,” agora-energy.de Recent TPV pilots achieved 26.4% efficiency and 4.3 W/cm² using 1,592 °C graphite emitters, outperforming organic Rankine rivals above 1,000 K.[3]“Graphite-emitter TPV achieving 26.4% efficiency,” arxiv.org Solid-state devices avoid working fluids, reducing maintenance and safety costs. Payback periods are shrinking as energy prices and carbon fees climb, elevating TPV to boardroom agendas in Asia-Pacific and North America.
Thermal-Storage Paired TPV Enables 24/7 Renewable Energy
Heat-storage blocks heated to 1,500 °C and coupled with ≥40%-efficient TPV cells supply on-demand power when solar or wind output dips. California grid planners cite levelized costs nearing USD 0.128/kWh, undercutting peaker gas assets. Systems promise 20-year life with minimal degradation and simultaneous electricity and heat delivery, aligning with industrial electrification targets. Antora Energy’s field units embody the concept, illustrating how thermal storage plus TPV can anchor high-renewable grids.
Near-Field TPV Mini-Cogeneration Architectures Unlock Distributed Power
Sub-millimeter emitter-to-cell gaps exploit evanescent wave coupling to surpass 8 W/cm², achieving 50% projected efficiency at 1,100 K. The University of Colorado Boulder demonstrated gap-free assemblies that maintain output despite temperature swings, paving the way for 1–10 kW micro-cogeneration sets targeting apartments and commercial rooftops. Compact, vibration-free designs meet urban noise ordinances, expanding TPV reach into city centers.
Restraints Impact Analysis*
| Restraint | (~) % Impact on CAGR Forecast | Geographic Relevance | Impact Timeline |
|---|---|---|---|
| High cost of antimonide & arsenide compounds | -2.80% | Global (supply-constrained regions acute) | Medium term (2-4 years) |
| Competing TEG & ORC waste-heat solutions | -2.10% | Global (mature industrial users) | Long term (≥4 years) |
| Reliability issues in sub-100 µm gap cavities | -2% | Global (near-field applications) | Short term (≤2 years) |
| Critical-metal (In, Sb) supply vulnerabilities | -1.40% | Import-dependent economies | Long term (≥4 years) |
| Source: Mordor Intelligence | |||
High Cost of Antimonide & Arsenide Compounds Constrains Market Expansion
GaSb wafers priced above USD 1,000 each and low recycling rates keep material overhead at 40-60% of cell cost, delaying large-scale rollouts.[4]“GaSb wafer cost analysis,” aip.org Precision epitaxy for quaternary InGaAsSb cells elevates defect risk, hurting yields. Substrate recycling and silicon-tandem surrogates are in development yet remain below flagship efficiency so that price pressure will persist mid-decade.
Competing TEG & ORC Waste-Heat Solutions Limit Market Penetration
Thermoelectric generators excel below 600 K, while organic Rankine units hold decades-long track records in factories and maritime vessels. ORC hybrids already cut ship fuel bills by USD 1 million yearly at 18.3% efficiency, creating customer familiarity that TPV must displace. Risk-averse operators may stick with incumbent technologies until TPV proves field longevity.
*Our forecasts treat driver/restraint impacts as directional, not additive. The impact forecasts reflect baseline growth, mix effects, and variable interactions.
Segment Analysis
By Temperature Class: Mid-Temperature Dominance Drives Industrial Adoption
Mid-temperature systems operating at 800–1,200 °C captured 48.5% revenue in 2024, supported by steel, cement, and glass furnaces that run in this thermal window. At the segment level, the thermophotovoltaics market size for mid-temperature units is forecast to rise at a 19.7% CAGR to 2030, outpacing both low- and high-temperature alternatives. Recent bifacial converter prototypes achieved >30% efficiency while doubling power density, catalyzing industrial pilots in Asia-Pacific.
Material degradation above 1,200 °C limits the adoption of high-temperature devices despite their superior theoretical yield, whereas low-temperature options face direct competition from mature thermoelectrics. Manufacturers, therefore, favor mid-band designs that balance reliability, cost, and thermal match with existing waste-heat profiles. This consensus accelerates procurement cycles in North American cement kilns and European glass lines.


By Cell Material: GaSb Leadership Faces InGaAs Challenge
Gallium antimonide held a 60.1% share in 2024 on the strength of flight-qualified reliability and entrenched supply chains. However, InGaAs alloys are projected to post a 20.8% CAGR through 2030 as bandgap-tuning lifts conversion efficiency toward 39% at 1,850 °C. The thermophotovoltaics market share for GaSb may erode as scale economies in III-V alloy growth reduce price premiums.
Machine-learning-led discovery of Ge-InGaAsSb heterojunctions hints at silicon-compatible pathways that could rewire cost curves. Investors, therefore, pursue diversified procurement of GaSb and InGaAs wafers to hedge against critical-metal shocks while maintaining performance targets.
By System Configuration: Near-Field Innovation Challenges Far-Field Dominance
Far-field assemblies retained 58.9% revenue share in 2024 thanks to simpler mechanics and broader field experience. Yet the thermophotovoltaics market is seeing brisk orders for prototype near-field packages expected to enjoy a 20.1% CAGR. Lab demonstrations with zero-vacuum gaps achieve power densities similar to high-temperature far-field rigs but at only 1,000 °C, reducing emitter stress.
Large-area near-field devices built via epitaxial co-fabrication produced 1.22 mW at 460 °C, promising low-grade process heat in food and beverage plants. Engineering teams prioritize rugged gap-control frames and contamination-resistant coatings to meet industrial qualification tests slated for 2026.
By Application: Industrial Recovery Leads as Primary Generation Accelerates
Industrial waste-heat recovery accounted for 34.8% of 2024 revenue due to abundant high-temperature exhaust in steel and chemical plants. However, the thermophotovoltaics market size for primary power generation will expand at a 20.5% CAGR as thermal batteries scale from MW to GW deployments. Antora Energy’s carbon-block storage paired with TPV converters now supplies co-located heat and electricity to California factories, validating the commercial model.
Space, defense, and radioisotope niches continue to offer stable if modest demand profiles. Consumer and IoT devices remain experimental, yet silent, vibration-free micro-generators could capture emerging smart-building retrofits once cost crosses the USD 1/W threshold.
Geography Analysis
North America commanded 45.3% of global revenue in 2024 and is forecast to lead a 17.3% CAGR through 2030. Generous Inflation Reduction Act tax credits and targeted ARPA-E grants funnel capital into pilot lines and early commercial installations. Record 44% efficiency cells from U.S. universities reinforce the region’s innovation edge.
Europe is the second-largest region, propelled by industrial electrification drives and coordinated programs such as the TPX thermophotonics consortium. Germany leverages Fraunhofer ISE expertise to support demonstration plants while Nordic utilities test TPV-based thermal storage for district heating. Policy harmonization under the Green Deal will unlock cross-border projects after 2026.
Asia-Pacific represents the next major frontier, hosting the bulk of global furnace capacity and semiconductor fabrication lines. Japanese and South Korean researchers bring decades of TPV know-how, and Chinese PV giants possess compatible tooling that could flood the thermophotovoltaics market with lower-cost modules. Supply-chain risk around antimony and indium remains a regional Achilles’ heel amid tightening export rules, incentivizing joint ventures aimed at recycling and substitution.

Competitive Landscape
The field remains fragmented, with no vendor owning more than a mid-single-digit revenue share. Antora Energy leads commercialization, operating the first dedicated TPV production line and closing cumulative funding above USD 350 million. Fourth Power targets utility-scale thermal storage with 41% efficient cells functioning at 2,400 °C, positioning its platform as a fossil-peaker replacement.
Boeing’s Spectrolab division applies satellite PV heritage to defense contracts, while MicroLink Devices and JX Crystals supply specialty III-V wafers. Strategic moves concentrate on vertical integration; firms lock in material supply, emitter fabrication, and system-level assembly to protect margins in a rising-cost environment. Patent landscapes are thickening, with tandem TPV architectures and selective-emitter recipes forming the backbone of licensing negotiations.
Mergers remain limited, yet observers expect consolidation once at-scale manufacturing brings cost visibility. Early movers that pair manufacturing prowess with diversified raw-material access will likely emerge as tier-one suppliers by decade’s end.
Thermophotovoltaics Industry Leaders
Antora Energy
TPV Technology Inc.
Spectrolab (Boeing)
MicroLink Devices
Solaronix SA
- *Disclaimer: Major Players sorted in no particular order

Recent Industry Developments
- February 2025: Antora Energy secured USD 4 million from the California Energy Commission and ARPA-E to expand TPV cell output.
- January 2025: Heat2Power launched to exploit TPV for stored-heat conversion.
- January 2025: The U.S. Department of Energy published its Harsh Environment Materials Roadmap, highlighting TPV as a priority technology.
- November 2024: Rice University unveiled quantum-inspired tungsten emitters surpassing 60% efficiency.


Global Thermophotovoltaics Market Report Scope
| Low-Temperature TPV (Below 800 °C) |
| Mid-Temperature TPV (800 to 1,200 °C) |
| High-Temperature TPV (Above 1,200 °C) |
| GaSb |
| InGaAs/InGaAsSb |
| Si and Si-based Tandems |
| Others (Ge, GaInAsP, etc.) |
| Near/Micro-field (Below 1 mm gap) |
| Far-field (Above 1 mm gap) |
| Primary Power Generation |
| Industrial Waste-Heat Recovery |
| Space Power |
| Defense and Military |
| Consumer and IoT Electronics |
| North America | United States |
| Canada | |
| Mexico | |
| Europe | Germany |
| United Kingdom | |
| France | |
| Italy | |
| NORDIC Countries | |
| Russia | |
| Rest of Europe | |
| Asia-Pacific | China |
| India | |
| Japan | |
| South Korea | |
| ASEAN Countries | |
| Rest of Asia-Pacific | |
| South America | Brazil |
| Argentina | |
| Rest of South America | |
| Middle East and Africa | Saudi Arabia |
| United Arab Emirates | |
| South Africa | |
| Egypt | |
| Rest of Middle East and Africa |
| By Temperature Class | Low-Temperature TPV (Below 800 °C) | |
| Mid-Temperature TPV (800 to 1,200 °C) | ||
| High-Temperature TPV (Above 1,200 °C) | ||
| By Cell Material | GaSb | |
| InGaAs/InGaAsSb | ||
| Si and Si-based Tandems | ||
| Others (Ge, GaInAsP, etc.) | ||
| By System Configuration | Near/Micro-field (Below 1 mm gap) | |
| Far-field (Above 1 mm gap) | ||
| By Application | Primary Power Generation | |
| Industrial Waste-Heat Recovery | ||
| Space Power | ||
| Defense and Military | ||
| Consumer and IoT Electronics | ||
| By Geography | North America | United States |
| Canada | ||
| Mexico | ||
| Europe | Germany | |
| United Kingdom | ||
| France | ||
| Italy | ||
| NORDIC Countries | ||
| Russia | ||
| Rest of Europe | ||
| Asia-Pacific | China | |
| India | ||
| Japan | ||
| South Korea | ||
| ASEAN Countries | ||
| Rest of Asia-Pacific | ||
| South America | Brazil | |
| Argentina | ||
| Rest of South America | ||
| Middle East and Africa | Saudi Arabia | |
| United Arab Emirates | ||
| South Africa | ||
| Egypt | ||
| Rest of Middle East and Africa | ||


Key Questions Answered in the Report
What was the thermophotovoltaics market size in 2024 and its projected 2030 value?
It stood at USD 470.83 million in 2024 and is forecast to reach USD 1,158.04 million by 2030.
Which temperature class leads commercial adoption?
Systems operating at 800–1,200 °C hold the largest share thanks to compatibility with industrial exhaust streams.
Which region is expected to expand fastest through 2030?
North America is projected to grow at a 17.3% CAGR due to generous incentives and early manufacturing scale-up.
What efficiency milestones unlocked recent market interest?
Laboratory records surpassed 40% conversion, with cells hitting 44% in 2024.
How do TPV thermal batteries compete with lithium-ion storage?
They store energy as heat in low-cost materials, offer 20-year life with minimal degradation, and deliver both heat and electricity.
What limits near-field TPV commercialization today?
Maintaining sub-100 µm gaps under industrial conditions remains an engineering challenge impacting reliability.
Page last updated on:


