Market Overview
| Study Period | 2021 - 2031 |
|---|---|
| Forecast Data Period | 2026 - 2031 |
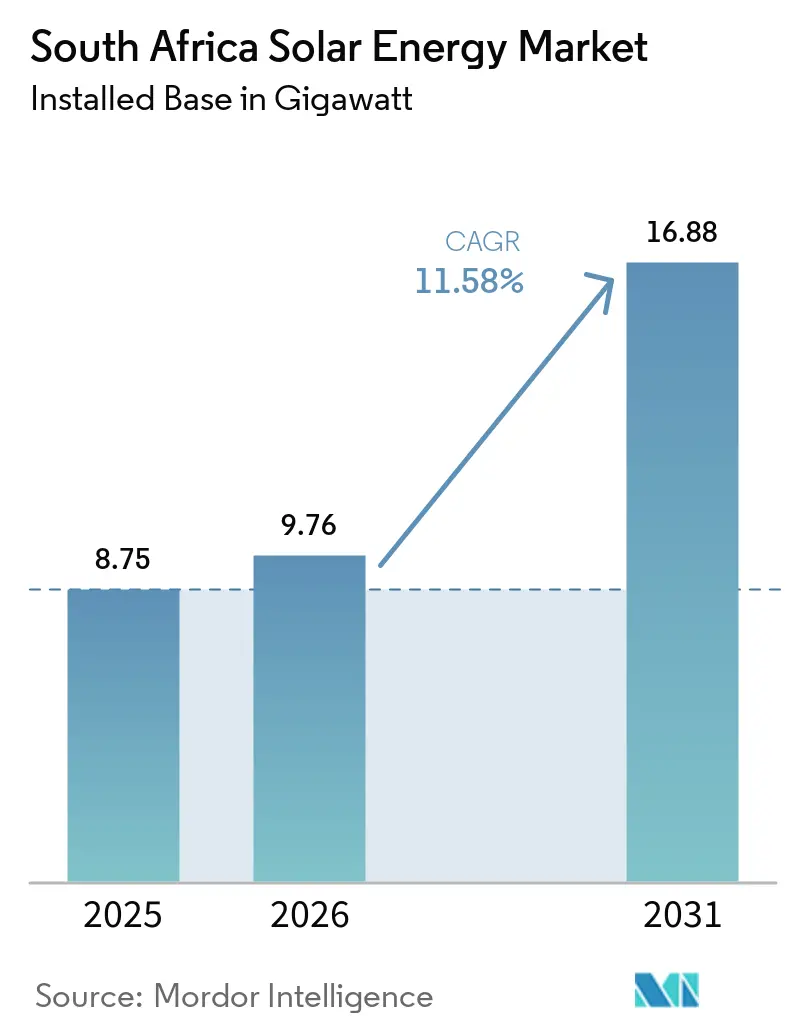
| Base Year Market Size (2025) | 8.75 gigawatt |
| Market Volume (2026) | 9.76 gigawatt |
| Market Volume (2031) | 16.88 gigawatt |
| Growth Rate (2026 - 2031) | 11.58% CAGR |
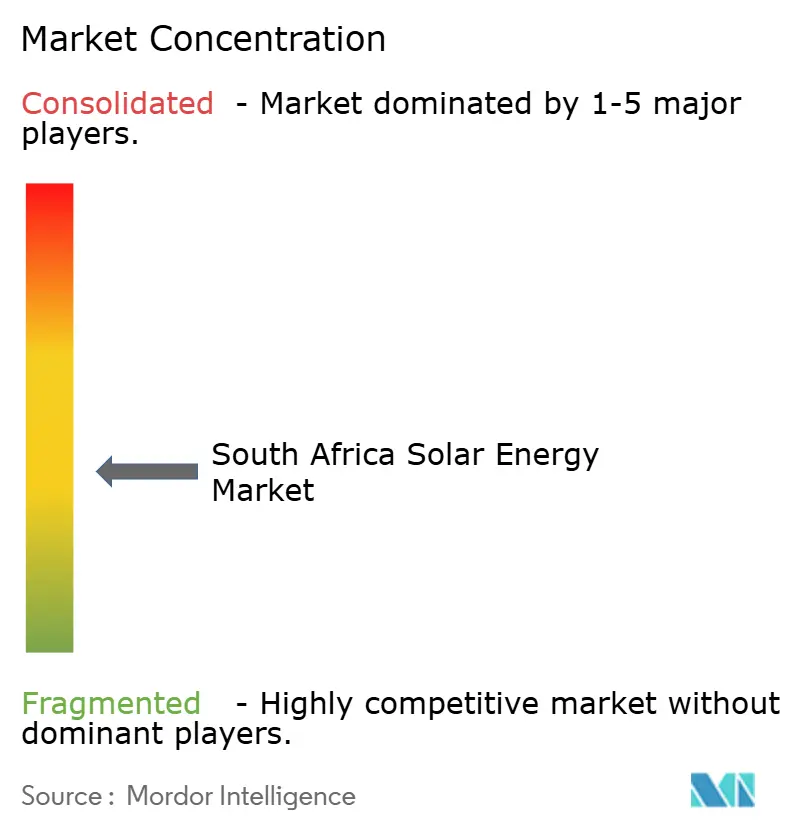
| Market Concentration | Medium |
Major Players *Disclaimer: Major Players sorted in no particular order Image © Mordor Intelligence. Reuse requires attribution under CC BY 4.0. | |
South Africa Solar Energy Market Analysis by Mordor Intelligence
The South Africa Solar Energy Market size was valued at 8.75 gigawatt in 2025 and estimated to grow from 9.76 gigawatt in 2026 to reach 16.88 gigawatt by 2031, at a CAGR of 11.58% during the forecast period (2026-2031).
Growth hinges on accelerating coal-to-solar substitution, record corporate demand for clean electricity, and persistent grid instability that prompts policymakers and investors to adopt proven photovoltaic solutions. Declining module and balance-of-system costs continue to compress levelized tariffs below Eskom’s new-build coal benchmarks, while streamlined permitting under the Renewable Energy Independent Power Producer Procurement Programme (REIPPPP) shortens project lead times. A widening pipeline of corporate power purchase agreements (PPAs) from mining companies and data-center operators diversifies offtake structures, unlocking new capital from domestic banks, international climate-finance facilities, and development finance institutions. Nevertheless, grid bottlenecks in the Northern Cape, higher storage integration costs, and land-use conflicts in biodiversity zones insert friction that moderates deployment velocity and shapes technology choices across segments.
Key Report Takeaways
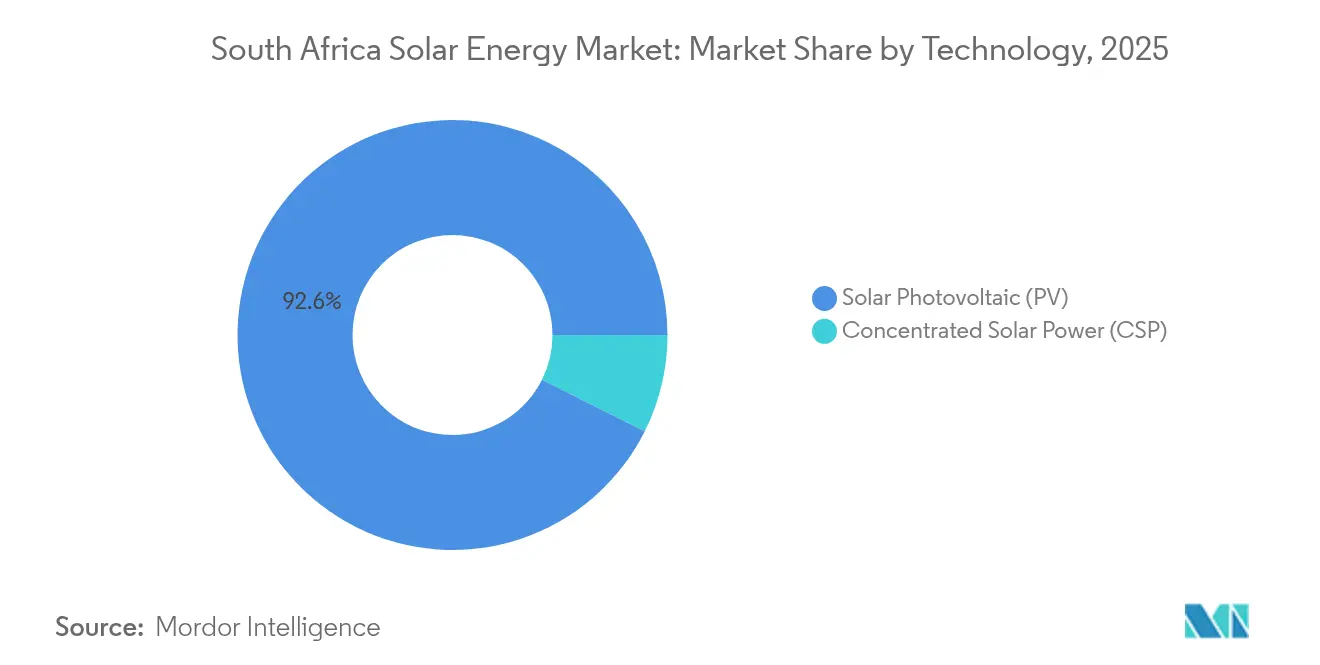
- By technology, photovoltaic (PV) installations commanded a 92.62% revenue share of the South Africa solar energy market in 2025, whereas concentrated solar power (CSP) is forecast to advance at a 14.35% CAGR through 2031.
- By grid type, on-grid plants accounted for 93.66% of the South Africa solar energy market share in 2025, while off-grid systems are projected to expand at a 15.05% CAGR to 2031.
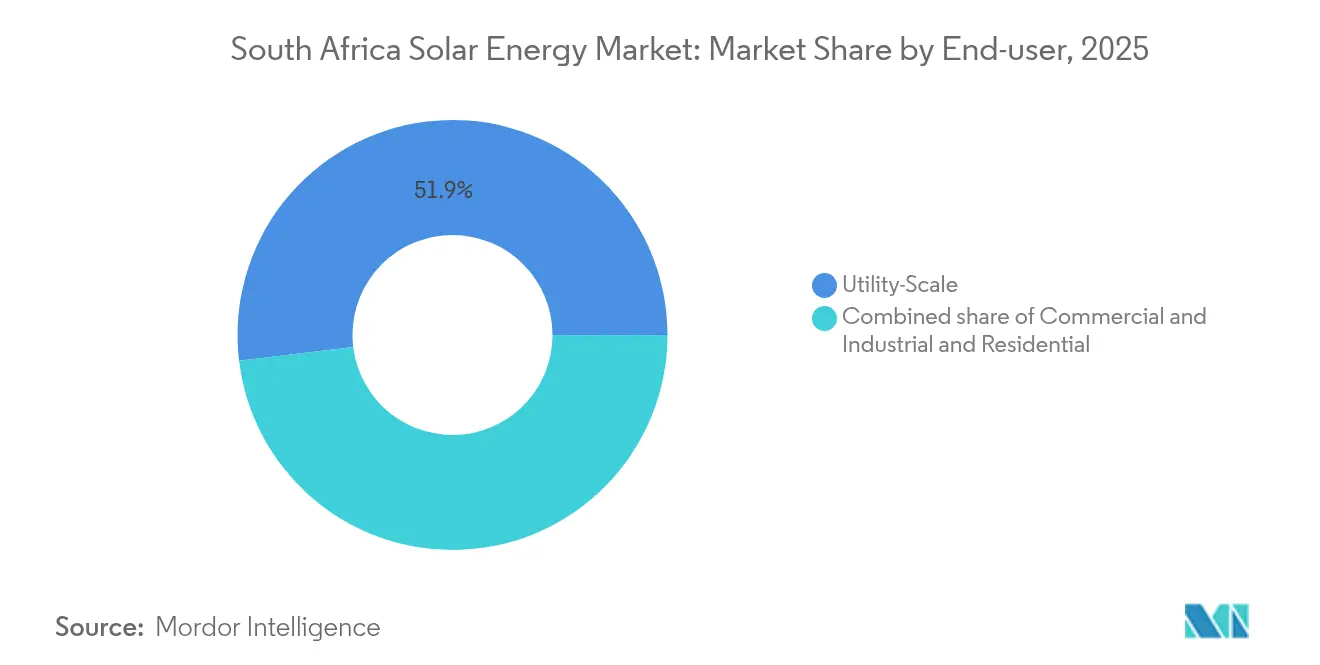
- By end-user, utility-scale assets led the South African solar energy market with 51.92% of the market size in 2025, and residential installations are projected to track an 17.65% CAGR over the forecast period.
Note: Market size and forecast figures in this report are generated using Mordor Intelligence’s proprietary estimation framework, updated with the latest available data and insights as of 2026.
South Africa Solar Energy Market Trends and Insights
Drivers Impact Analysis*
| Driver | (~) % Impact on CAGR Forecast | Geographic Relevance | Impact Timeline |
|---|---|---|---|
| Declining PV module prices and BOS costs | +2.80% | Western Cape, Northern Cape, Gauteng | Short term (≤ 2 years) |
| Robust REIPPPP pipeline & tender schedule | +3.20% | Northern Cape, Western Cape | Medium term (2-4 years) |
| Urgent grid-stability needs amid Eskom load-shedding | +2.10% | Gauteng, KwaZulu-Natal corridors | Short term (≤ 2 years) |
| Abundant DNI & solar irradiation levels | +1.40% | Northern Cape, Western Cape, Free State | Long term (≥ 4 years) |
| Corporate PPAs from mining & data-center operators | +1.60% | Gauteng, Limpopo, North West | Medium term (2-4 years) |
| International climate-finance inflows | +1.90% | National | Long term (≥ 4 years) |
| Source: Mordor Intelligence | |||


Declining PV Module Prices and Balance-of-System Cost Reductions
Average global module prices fell 42% between 2023 and 2024, pulling South African utility-scale tariffs to ZAR 0.58 per kWh, which is well below the recently commissioned coal plants that exceed ZAR 1.20 per kWh.(1)PV Magazine reporters, “Global Module Pricing Trends 2024,” PV-Magazine, pv-magazine.com Comparable cost compression across inverters, trackers, and mounting structures widens project margins and increases bid competitiveness in REIPPPP Bid Window 7, which procured 2.6 GW of new solar capacity in 2024.(2) ESI Africa editors, “REIPPPP Procurement Acceleration,” ESI-Africa, esi-africa.com Developers increasingly adopt bifacial modules and dual-axis trackers that elevate energy yields by up to 35% in the high-irradiation Northern Cape. Because hardware is mostly denominated in U.S. dollars, currency volatility introduces procurement risk, prompting sponsors to secure forward contracts and deepen local-content partnerships that temper exchange-rate exposure. These dynamics position cost leadership as the primary lever for differentiation among EPC contractors and developers competing for forthcoming Bid Window 8 capacity.
Robust REIPPPP Pipeline and Tender Schedule Acceleration
The Department of Mineral Resources and Energy has condensed tender cycles from an average of 24-36 months in earlier rounds to 18 months in Bid Window 7, in part through standardized grid studies and fast-track environmental approvals. The agency plans a 3 GW Bid Window 8 with a mandatory 4-hour storage requirement on 40% of the awarded capacity, reflecting the government's intent to secure dispatchable renewable profiles suitable for evening peaks. Newly instituted delay penalties sharpen execution discipline, while provincial development zones in the Northern Cape offer pre-approved sites that shave up to one year off typical development timelines. As a result, financiers perceive lower permitting risk, which drives narrower spreads on construction debt and improves the bankability of larger, multi-technology projects.
Urgent Grid-Stability Needs amid Eskom Load-Shedding
Eskom’s generation shortfalls led to over 350 days of load-shedding in 2024, accelerating customer migration to embedded generation and prompting municipalities to expedite wheeling frameworks. Intermittency mitigation tools, including flexible tariffs, demand-response schemes, and battery-supported solar farms, are becoming mandatory features in new power-purchase contracts, particularly for energy-intensive mining operations in Gauteng and KwaZulu-Natal. System operators favor photovoltaic capacity with integrated voltage support capabilities to stabilize local feeders; consequently, inverter suppliers that certify advanced grid-support functions gain a competitive advantage in tenders. The urgency to shore up reliability is expected to sustain above-average growth in the South Africa solar energy market over at least the next two fiscal years.
Abundant DNI & Solar Irradiation Levels
South Africa’s Northern Cape records direct normal irradiation (DNI) above 2,800 kWh/m² annually, among the highest globally. Superior resource quality lowers the levelized cost of energy for both PV and CSP installations, offsetting logistical challenges of remote locations. Strong solar conditions extend well into the Western Cape and Free State, strengthening the economics of distributed rooftop PV in peri-urban and agricultural settings. Over the long term, this natural advantage underpins the country’s comparative edge in energy-intensive export sectors, especially green hydrogen and mineral processing, which require low-cost renewable inputs.
Restraints Impact Analysis*
| Restraint | (~) % Impact on CAGR Forecast | Geographic Relevance | Impact Timeline |
|---|---|---|---|
| Grid-connection bottlenecks & curtailment risk | -1.80% | Northern & Western Cape | Medium term (2-4 years) |
| High upfront capex for storage-ready projects | -1.20% | National | Short term (≤ 2 years) |
| Land-use conflicts in Northern Cape biodiversity zones | -0.70% | Nama Karoo biome | Long term (≥ 4 years) |
| Local content rules causing supply-chain delays | -0.90% | National | Medium term (2-4 years) |
| Source: Mordor Intelligence | |||
Grid Connection Bottlenecks and Curtailment Risk Escalation
Transmission circuits in the Northern Cape operate at 85–90% capacity utilization, extending grid-access queues beyond 36 months for new projects and triggering curtailment events that shaved 15–20% of annual output from certain operational plants in 2024.(3)Engineering News staff, “Transmission Bottlenecks in Northern Cape,” Engineering News, engineeringnews.co.za Eskom’s planned ZAR 12 billion Aries-Oranjemond reinforcement faces funding gaps, deferring completion to 2027–2028. Revised grid codes now require advanced frequency response capabilities, adding ZAR 0.15–0.25 million per MW in control hardware expenses. Time-of-use access charges also shift cost responsibility to generators, challenging returns on merchant PPAs unless coupled with storage that arbitrages peak tariffs.
High Upfront Capital Expenditure for Storage-Ready Project Configurations
Bid Window 8 mandates 4-hour storage on 40% of the awarded capacity, adding ZAR 8-12 million per MW to capital expenditure (capex), roughly a 45% uplift compared to PV-only builds. Storage asset lives an average of 10 to 15 years, mismatching 25-year solar revenue tenors and thus raising the weighted-average cost of capital by up to 200 basis points. Development finance institutions have launched specialized storage facilities, but sovereign guarantees remain a gating factor for many private sponsors. Hybrid solar-wind-storage complexes mitigate some risk by elevating capacity factors above 45%, yet increased design complexity elongates permitting and interconnection studies by 12 to 18 months.
*Our forecasts treat driver/restraint impacts as directional, not additive. The impact forecasts reflect baseline growth, mix effects, and variable interactions.
Segment Analysis
By Technology: Photovoltaic Leads While CSP Gains Momentum
Photovoltaic assets represented 92.62% of the installed capacity in 2025, translating to a dominant revenue position in the South African solar energy market. The segment maintained an 8.2% compound annual growth rate from 2019 to 2024 and now benefits from expanded REIPPPP allocations and surging private PPAs. CSP, although currently small, is poised for a 14.35% CAGR through 2031, as mining firms and industrial users favor its dispatchable profile, which aligns output with evening system peaks. The South Africa solar energy market size for CSP projects is projected to triple by the end of the decade, catalyzing a modest rebalancing of the technology mix without eroding PV’s foundational role.
PV’s momentum also stems from rapid innovation. Bifacial modules paired with single-axis trackers increase capacity factors to the 28–32% range, while laboratory advances in perovskite-silicon tandem cells indicate future efficiencies exceeding 35%. In contrast, CSP facilities such as Kathu and Bokpoort achieve capacity factors of nearly 65% thanks to 4.5-hour molten-salt storage, which supports grid stabilization after sunset. Hybrid designs that co-locate PV panels with CSP towers are under evaluation to blend low-cost daytime energy with dispatchable evening output, potentially reducing levelized costs by up to 18%.


By Grid Type: On-Grid Dominance with Rapid Off-Grid Uptake
On-grid installations held 93.66% of capacity in 2025, reflecting the continued importance of centralized procurement and wheeling regulations that encourage corporate use of Eskom's network. Off-grid solutions nevertheless exhibit a 15.05% forecast CAGR, underpinned by mining clusters and rural microgrids where grid extension remains uneconomic. The South African solar energy market share for off-grid projects is projected to rise to 8.60% by 2031, absorbing the capacity earmarked in the Integrated Resource Plan for distributed generation.
On-grid assets are increasingly required to furnish grid-support services that extend beyond energy delivery. Inverters must provide voltage regulation, and many developers incorporate small battery arrays to manage ramp-rate constraints. Off-grid systems rely heavily on software-defined microgrid controllers that are capable of seamless islanding during load shedding. Demonstration projects in KwaZulu-Natal show that tariffs undercut Eskom's residential rates, thereby bolstering social acceptance and municipal support. Continued cost declines in lithium-ion batteries are likely to accelerate off-grid adoption, particularly in agriculture and community electrification programs.
By End-User: Utility-Scale Out-in-Front, Residential Gathers Speed
Utility-scale projects accounted for 51.92% of installed capacity in 2025, driven by REIPPPP and large private PPAs that typically exceed 100 MW per site. Residential systems, though smaller, are forecast to grow at 17.65% CAGR amid load-shedding fatigue and favorable net-metering policies. The South Africa solar energy market size for residential rooftops is projected to surpass 2.18 GW by 2031, equating to roughly 1 million homes nationwide.
Utility-scale developments achieve the lowest tariffs due to economies of scale and superior site irradiation, averaging ZAR 0.60 per kWh in Bid Window 7. Residential systems are more expensive on a kilowatt-hour basis but command a resilience premium because households avoid power cuts during Eskom outages. Battery attachment rates reached 65% of new residential installs in 2024, indicating growing consumer willingness to pay extra for autonomy. Meanwhile, commercial-and-industrial (C&I) buyers leverage long-term PPAs to lock in sub-inflationary power prices, a trend that should preserve steady mid-teen growth in the segment through 2030.
Geography Analysis
The Northern Cape hosted 67.40% of the national solar capacity in 2025, owing to its superior irradiation, exceeding 2,800 kWh/m², and ample land availability. Project clustering around Upington and De Aar supports specialized maintenance hubs and a skilled technician workforce that cuts operational expenses by up to 20%. Forecast allocations in REIPPPP Bid Window 8 and corporate pipelines suggest the province will retain leadership, with its solar fleet anticipated to exceed 12.2 GW by 2031, representing a 12.95% CAGR over the outlook period.
The Western Cape captured an 18.40% share in 2025, propelled by Cape Town’s wheeling framework, which enables rooftop and ground-mounted PV to sell surplus power to off-site consumers. Municipal procurement programs further stimulate adoption, especially among industrial users in the Atlantis and Saldanha Bay corridors. Improved distribution network planning could increase the South African solar energy market share in the Western Cape to roughly 20.25% by 2031, contingent on timely substation upgrades.
Gauteng held an 8.10% market share, despite lower resource quality, due to robust commercial demand and dense load centers that favor behind-the-meter PV. Provincial authorities actively facilitate rooftop permitting, compressing approval steps to under four weeks in Johannesburg and Ekurhuleni. Emerging provinces such as the Free State and North West, which have historically been minor players, are now attracting mining-linked off-grid projects and agricultural PV, setting the stage for combined capacity to double from 2025 levels and reach 6.50% of national installations by 2031.
Competitive Landscape
The South African solar energy industry exhibits moderate concentration, with the five leading developers —Scatec ASA, ACWA Power, Enel Green Power South Africa, Mainstream Renewable Power, and Sonnedix —controlling around 45% of operational capacity.(5)Engineering News staff, “Company Announcements and Project Updates,” Engineering News, engineeringnews.co.zaIncumbents secure repeat-bidder status by demonstrating on-time delivery and compliance with local-content mandates, yet face new competition from technology-focused entrants offering hybrid solar-wind-storage packages that outperform standalone PV on dispatchability metrics.
Strategic moves in 2024–2025 underscore shifting competitive dynamics. Scatec reached financial close on the 540 MW Kenhardt hybrid complex that pairs PV with 4-hour batteries, signaling investor appetite for storage-heavy projects. ACWA Power landed a 20-year PPA with Sibanye-Stillwater, marking the largest single-buyer solar contract in South Africa’s mining sector. Enel Green Power commissioned the 140 MW Oyster Bay hybrid project, which combines wind, solar, and battery capacity, showcasing the complementarity of resources that achieves a 52% capacity factor.
The residential and commercial and industrial (C&I) sub-segments remain fragmented, with more than 200 registered installers nationwide. Consolidation is accelerating as larger EPC firms acquire regional installers to capture economies of scale in panel procurement and after-sales services. Technology differentiation, particularly in the form of bifacial panels, smart inverters, and AI-driven performance monitoring, emerges as a key battleground for customer acquisition. Firms with strong regulatory affairs teams also gain an edge, as increasingly stringent grid-code updates require sophisticated compliance planning.
South Africa Solar Energy Industry Leaders
Canadian Solar Inc.
IBC Solar AG
Segen Solar(Pty) Ltd
ARTsolar (Pty) Ltd
Energy Partners Holdings (Pty) Ltd
- *Disclaimer: Major Players sorted in no particular order

Recent Industry Developments
- January 2025: Scatec ASA achieved financial close on the 540 MW Kenhardt solar-plus-storage project in the Northern Cape, investing ZAR 18 billion and incorporating 4-hour batteries to supply grid-stability services.
- December 2024: ACWA Power signed a 20-year, 420 MW solar PPA with Sibanye-Stillwater, featuring wheeling through municipal networks in the North West Province.
- November 2024: Enel Green Power inaugurated the 140 MW Oyster Bay wind-solar-battery hybrid facility in the Eastern Cape, posting a 52% blended capacity factor.
- October 2024: The Department of Mineral Resources and Energy opened REIPPPP Bid Window 8 for 3 GW, introducing a 4-hour storage mandate on 40% of capacity and raising local-content thresholds to 45%.
- September 2024: Mainstream Renewable Power committed ZAR 24 billion to developing the 1.3 GW Oya Energy hybrid complex, which features solar, wind, storage, and green hydrogen facilities in the Northern Cape.


South Africa Solar Energy Market Report Scope
Solar power is energy from the sun that is converted into thermal or electrical energy. Solar energy is the cleanest and most abundant renewable energy source globally. Solar technologies can harness this energy for various uses, including generating electricity, providing light or a comfortable interior environment, and heating water for domestic, commercial, or industrial use.
The South African solar energy market is segmented by technology and end users. By technology, the market is segmented by concentrated solar power (CSP) and solar photovoltaic (PV). By the end user, the market is segmented by residential, commercial and industrial (C&I), and utility. For each segment, the market size and forecasts have been done based on installed capacity.
By Technology
| Solar Photovoltaic (PV) |
| Concentrated Solar Power (CSP) |
By Grid Type
| On-Grid |
| Off-Grid |
By End-User
| Utility-Scale |
| Commercial and Industrial (C&I) |
| Residential |
By Component (Qualitative Analysis)
| Solar Modules/Panels |
| Inverters (String, Central, Micro) |
| Mounting and Tracking Systems |
| Balance-of-System and Electricals |
| Energy Storage and Hybrid Integration |
| By Technology | Solar Photovoltaic (PV) |
| Concentrated Solar Power (CSP) | |
| By Grid Type | On-Grid |
| Off-Grid | |
| By End-User | Utility-Scale |
| Commercial and Industrial (C&I) | |
| Residential | |
| By Component (Qualitative Analysis) | Solar Modules/Panels |
| Inverters (String, Central, Micro) | |
| Mounting and Tracking Systems | |
| Balance-of-System and Electricals | |
| Energy Storage and Hybrid Integration |


Key Questions Answered in the Report
How large is the South Africa solar energy market in 2026?
Installed capacity reached 9.76 GW in 2026 and is projected to hit 16.88 GW by 2031.
What CAGR is forecast for South African solar through 2031?
Capacity is expected to expand at an 11.58% CAGR over the 2026-2031 period.
Which technology dominates current installations?
Photovoltaic systems hold a 92.62% share of capacity, far ahead of CSP.
Why is the Northern Cape pivotal for new projects?
It offers direct normal irradiation above 2,800 kWh/m² and extensive pre-zoned land, which lowers levelized costs.
What role do corporate PPAs play in market growth?
Mining houses and data-center operators secured more than 1 GW of PPAs in 2024, diversifying demand beyond public tenders.
What are the main obstacles to faster deployment?
Transmission bottlenecks, high storage capex, and stringent biodiversity regulations in sensitive zones slow project roll-out.
Page last updated on:


