Agriculture Sprayers Market Size and Share
Market Overview
| Study Period | 2021 - 2031 |
|---|---|
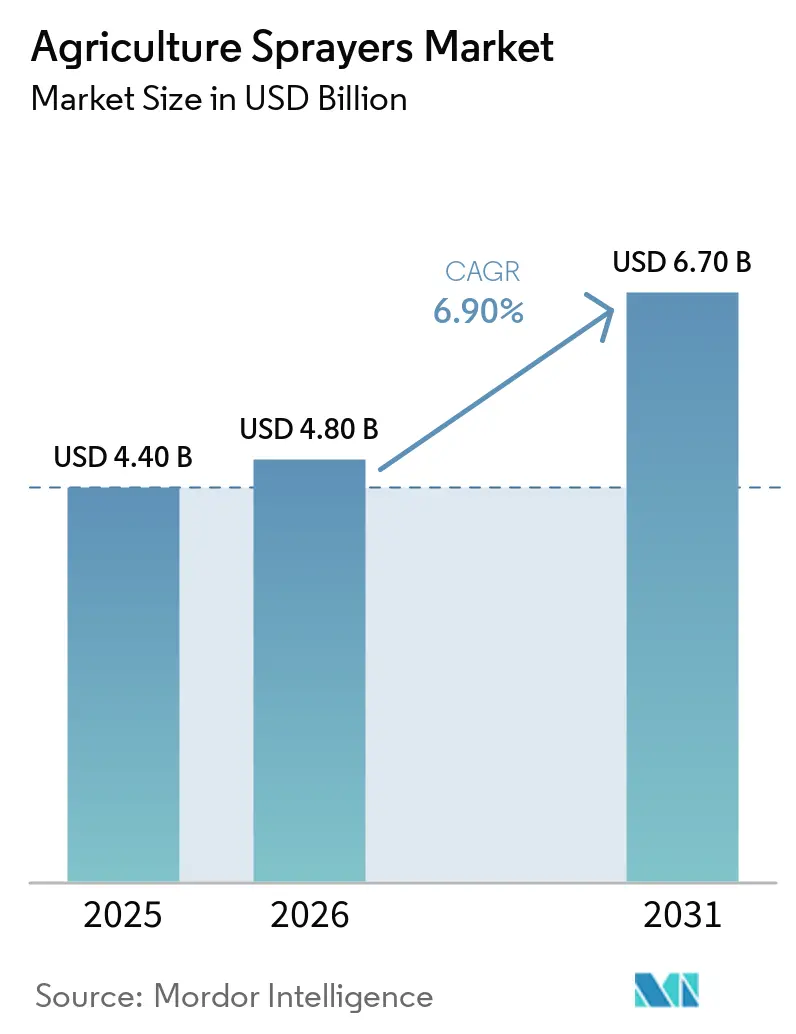
| Market Size (2026) | USD 4.80 Billion |
| Market Size (2031) | USD 6.70 Billion |
| Growth Rate (2026 - 2031) | 6.90% CAGR |
| Fastest Growing Market | Asia Pacific |
| Largest Market | North America |
| Market Concentration | Medium |
Major Players *Disclaimer: Major Players sorted in no particular order Image © Mordor Intelligence. Reuse requires attribution under CC BY 4.0. | |
Agriculture Sprayers Market Analysis by Mordor Intelligence
The agriculture sprayers market size is projected to grow from USD 4.4 billion in 2025 to USD 4.8 billion in 2026 and USD 6.7 billion by 2031, registering a CAGR of 6.9% from 2026 to 2031. The market growth is being driven by a shift in purchasing behavior, as growers increasingly evaluate the upfront cost of precision equipment against herbicide savings and anticipated payback per acre. According to University of Arkansas field research published in March 2025, targeted spraying reduced herbicide use by 43% to 59%, with a USD 25,000 upgrade achieving payback after 819 acres under high-sensitivity settings. This has strengthened the business case for precision equipment upgrades. This evolving demand pattern highlights a growing divide between value-based procurement in developed farming regions and price-driven purchasing in Africa and South Asia. Meanwhile, policy-supported mechanization in China is accelerating adoption in the Asia-Pacific region. However, financial constraints can impact purchasing decisions, as evidenced by EXEL Industries reporting a 15.7% decline in agricultural spraying revenue during the first half of fiscal year 2024-2025, attributed to cautious capital spending by North American farmers.
Key Report Takeaways
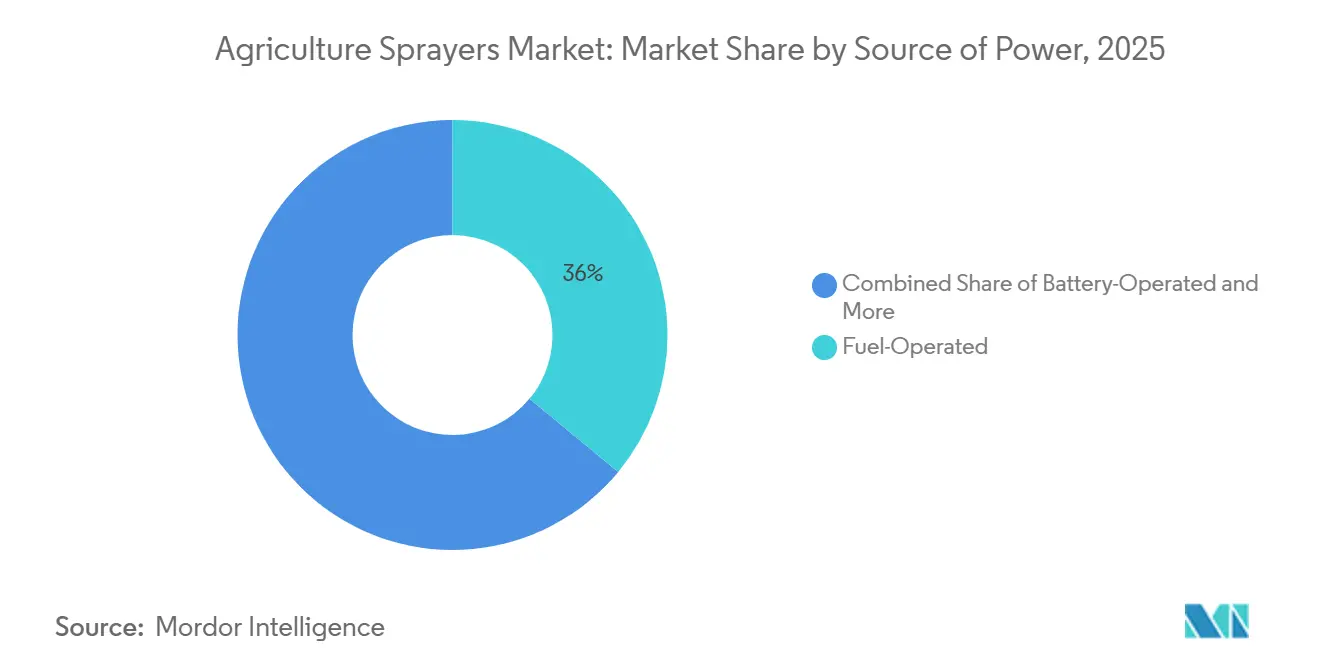
- By source of power, the agriculture sprayers market share for the fuel-operated segment accounted for the largest 36.0% in 2025, while the agriculture sprayers market size for the battery-operated segment is projected to expand at the fastest 12.1% CAGR from 2026 to 2031.
- By product type, tractor-mounted systems held the largest 41.4% share in 2025, while unmanned aerial vehicle sprayers are projected to advance at the fastest 28.1% CAGR from 2026 to 2031.
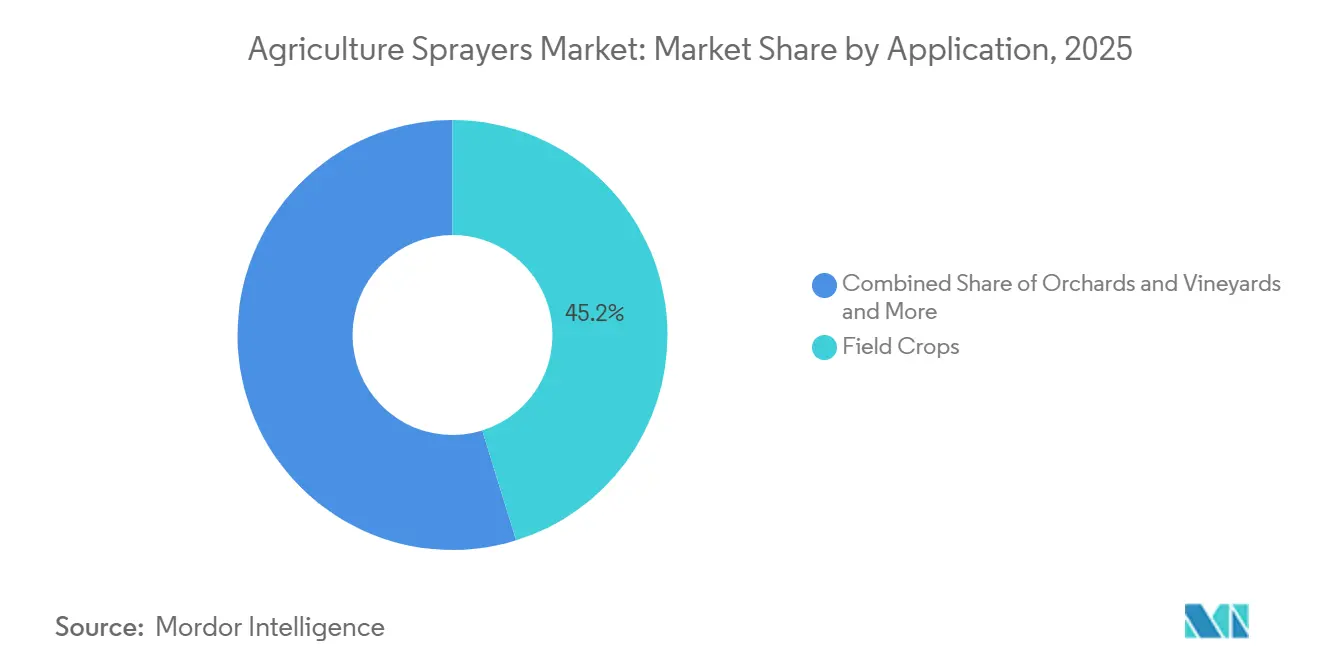
- By application, field crops accounted for the largest 45.2% share in 2025, while orchards and vineyards are forecast to grow at the fastest 13.9% CAGR from 2026 to 2031.
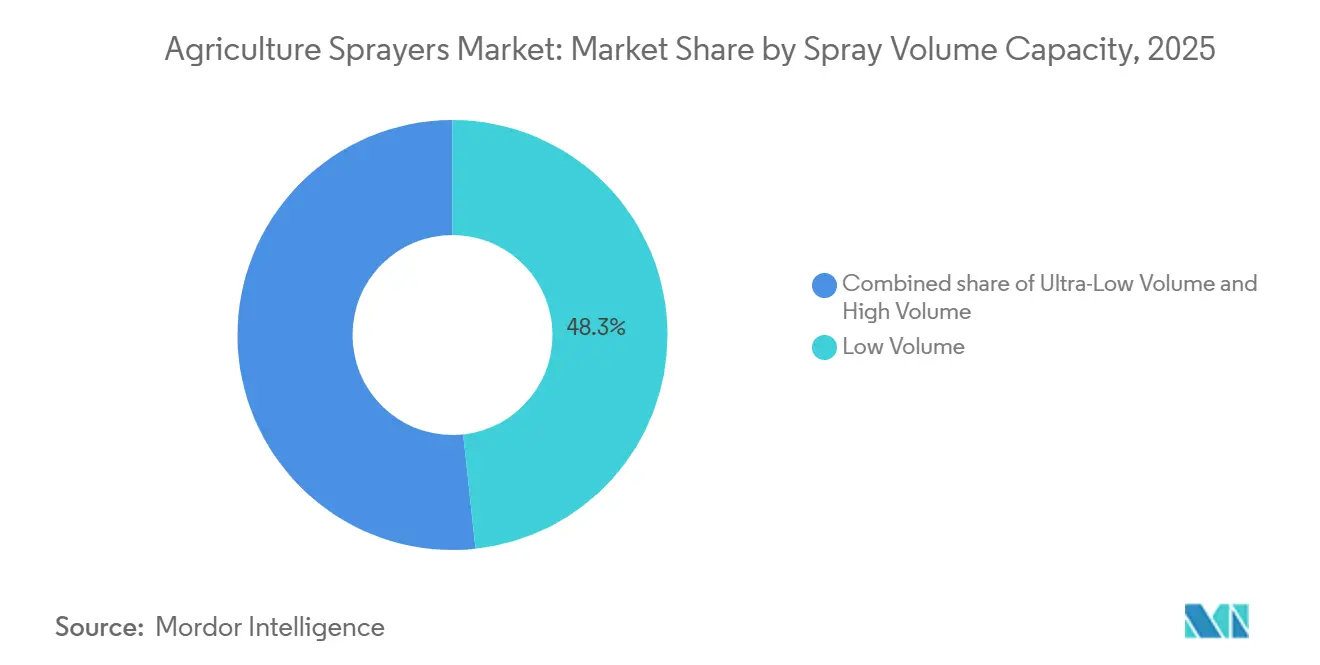
- By spray volume capacity, low volume platforms held the largest 48.3% share in 2025, while ultra-low volume systems are projected to rise at the fastest 21.4% CAGR from 2026 to 2031.
- By technology level, conventional systems held the largest 52.8% share in 2025, while artificial intelligence-enabled and autonomous systems are forecast to grow at the fastest 29.1% CAGR from 2026 to 2031.
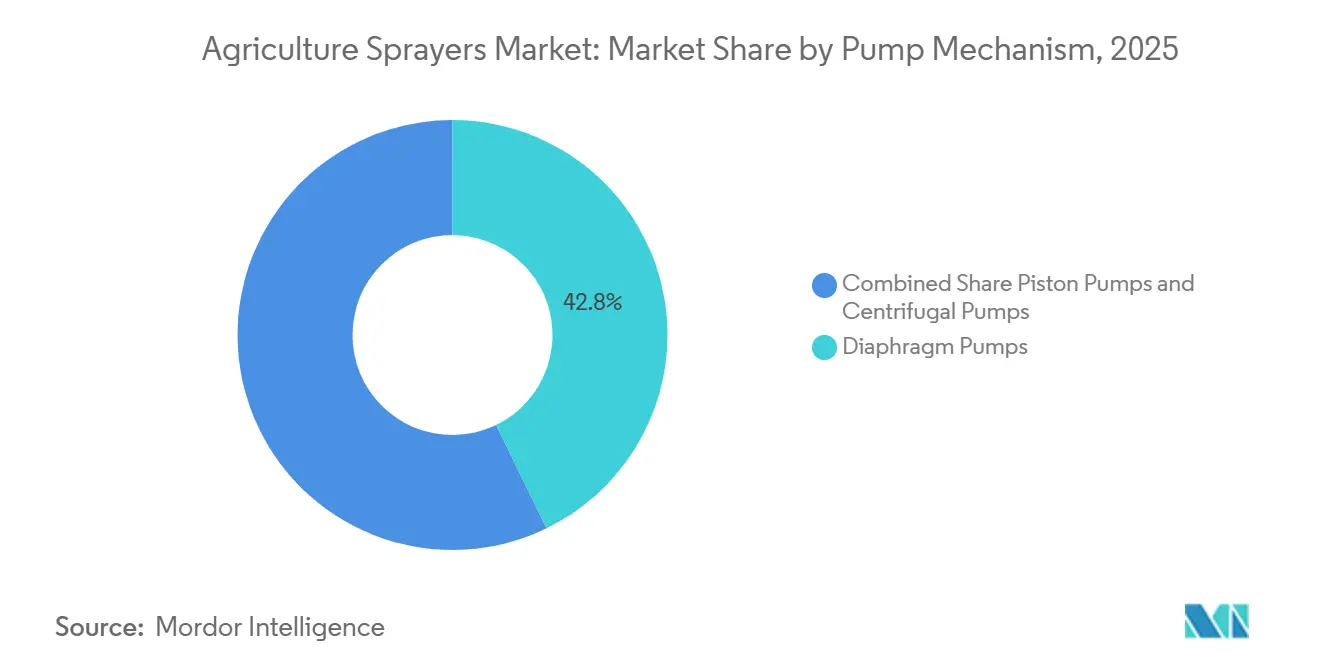
- By pump mechanism, diaphragm pumps held the largest 42.8% in 2025, while centrifugal pumps are projected to expand at the fastest 10.5% CAGR from 2026 to 2031.
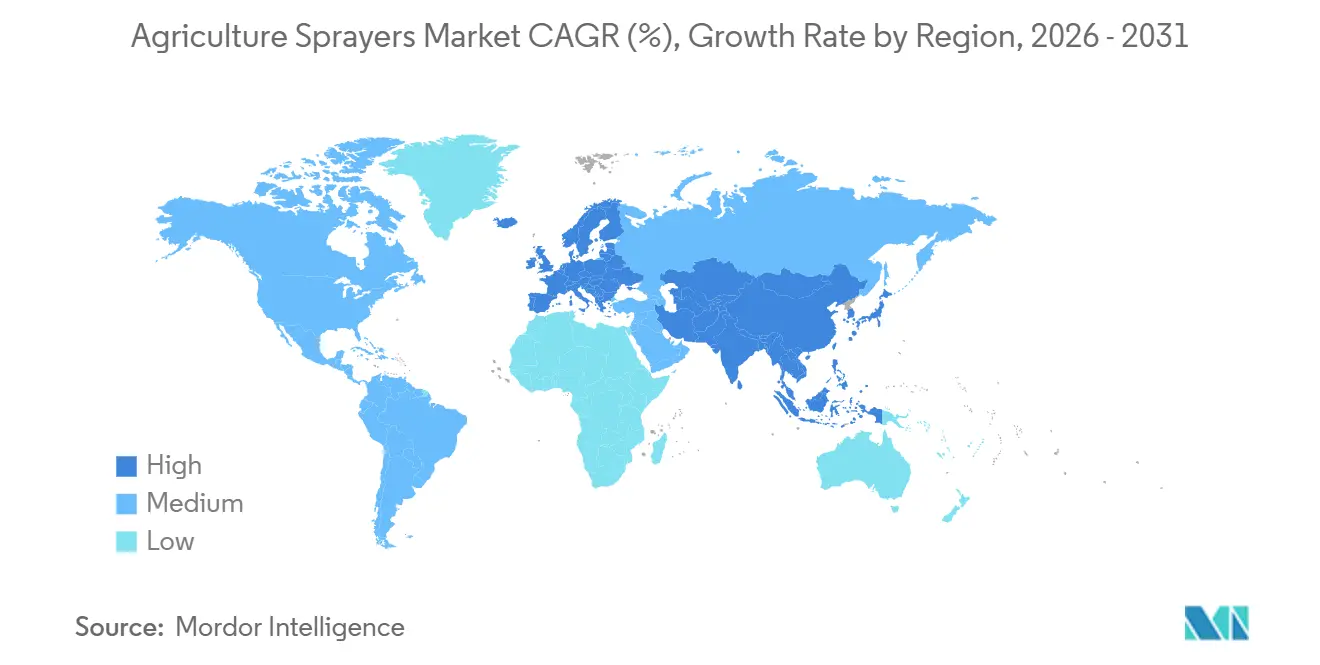
- By geography, North America held the largest 32.0% share in 2025, while Asia-Pacific is forecast to grow at the fastest 8.5% CAGR from 2026 to 2031.
Note: Market size and forecast figures in this report are generated using Mordor Intelligence’s proprietary estimation framework, updated with the latest available data and insights as of January 2026.
Global Agriculture Sprayers Market Trends and Insights
Driver Impact Analysis*
| Driver | (~) % Impact on CAGR Forecast | Geographic Relevance | Impact Timeline |
|---|---|---|---|
| Growth in agrochemical usage | +1.3% | Global | Long term (≥ 4 years) |
| Precision spraying upgrades using sensors | +1.1% | North America and Europe, expanding to Asia-Pacific | Medium term (2-4 years) |
| Rising labor costs and operator shortages | +0.9% | North America, Europe, and Asia-Pacific | Medium term (2-4 years) |
| Government mechanization and smart-farming subsidies | +1.0% | China, India, and South America | Short term (≤ 2 years) |
| Artificial Intelligence (AI) spot-spraying economics improve chemical-use payback | +1.2% | North America and Europe, emerging in Asia-Pacific | Medium term (2-4 years) |
| Growth of specialized drone and orchard spray-service fleets | +0.7% | Asia-Pacific core, spill-over to South America and Middle East and Africa | Short term (≤ 2 years) |
| Source: Mordor Intelligence | |||
Growth in Agrochemical Usage
Increasing pesticide application intensity continues to drive baseline equipment demand in the agriculture sprayers market. According to the United States Department of Agriculture Economic Research Service (USDA, ERS), herbicide-tolerant soybean acreage in the United States accounted for 96% of the planted area in 2024 and 2025, highlighting the ongoing reliance on crop protection chemical applications in large-scale farming systems[1]Source: United States Department of Agriculture Economic Research Service, “Recent Trends in GE Adoption,” ERS USDA, ers.usda.gov. Higher spraying frequency in broadacre crops leads to increased equipment operating hours and accelerates wear on components such as nozzles, pumps, hoses, and boom assemblies. This trend supports consistent replacement demand for agricultural sprayers and aftermarket consumable components, particularly in intensive row-crop production regions where multiple spray applications are standard during the growing season.
Precision Spraying Upgrades Using Sensors
Sensor-based upgrades are expanding opportunities in the agriculture sprayers market, as many growers can retrofit their existing equipment instead of replacing entire machines. Deere & Company has introduced expanded upgrade options and boom configurations for Model Year 2026 equipment and earlier models, indicating that retrofitting is becoming a significant adoption pathway rather than a niche solution. As sensing accuracy improves and installation costs become more justifiable, precision spraying is transitioning from a premium feature to a standard productivity tool for commercial farming operations.
Rising Labor Costs and Operator Shortages
Labor constraints are impacting ownership trends in the agriculture sprayers market, particularly in areas where recruiting and retaining skilled sprayer operators is difficult. This issue is most pronounced in orchard, vineyard, and specialty-crop systems, where challenging terrain and limited spray windows drive demand for autonomous or supervised equipment. According to the American Farm Bureau Federation, labor costs in the United States agricultural industry are projected to exceed USD 53 billion by 2025, with H-2A farmworker wages rising significantly in recent years, adding operational pressure on growers. In August 2025, Deere & Company acquired GUSS Autonomous, enhancing its portfolio in high-value crop autonomy. Similarly, Kubota Corporation has increased its focus on autonomous specialty-crop spraying through its KFAST program and related partnerships, indicating that equipment manufacturers view labor scarcity as a long-term commercial challenge rather than a temporary issue. As a result, service models and supervised autonomy are gaining importance in segments where operator availability limits field operations more than machine capacity.
Government Mechanization and Smart-Farming Subsidies
Public support programs are accelerating adoption cycles in the agriculture sprayers market, particularly in cases where farmer budgets alone would not enable rapid technology adoption. For instance, China has expanded its 2025 agricultural machinery subsidy program to include additional categories such as plant protection drones, thereby strengthening policy support for mechanized crop protection equipment[2]Source: The State Council Information Office of the People’s Republic of China, “China to Ramp Up Agricultural Machinery Renewal Efforts,” The State Council of the People’s Republic of China, english.www.gov.cn. Subsidy-backed purchases can significantly advance adoption, often by several replacement cycles, especially in regions where drones are typically acquired through service groups and organized providers rather than individual farms. This policy impact is most pronounced in the Asia-Pacific region but also contributes to faster growth in parts of South America, where smart-farming initiatives are tied to productivity and sustainability objectives. As these programs scale, they influence dealer inventories, product design priorities, and local training requirements simultaneously.
Restraint Impact Analysis*
| Restraint | (~) % Impact on CAGR Forecast | Geographic Relevance | Impact Timeline |
|---|---|---|---|
| High upfront capital expenditure and financing hurdles | -0.7% | North America and Europe | Medium term (2-4 years) |
| Limited operator and agronomy data skills | -0.4% | South America, Africa, and South Asia | Long term (≥ 4 years) |
| Mixed-fleet software and control-system interoperability gaps | -0.5% | Global | Medium term (2-4 years) |
| Battery lifecycle, charging, and uptime constraints in peak spray windows | -0.6% | Asia-Pacific and Middle East and Africa | Short term (≤ 2 years) |
| Source: Mordor Intelligence | |||
High Upfront Capital Expenditure and Financing Hurdles
Capital costs continue to pose a significant challenge for the agriculture sprayers market, particularly for farms unable to recoup the investment in advanced equipment within two to three seasons. EXEL Industries reported a 15.7% decline in agricultural spraying revenue during the first half of the fiscal year 2024-2025, attributing the weakness in North America to farmers adopting a cautious approach due to limited economic visibility[3]Source: EXEL Industries, “Q2 2024–2025 Revenue,” EXEL Industries, exel-industries.com. The challenge is more pronounced in the segment of AI-enabled and autonomous equipment, where purchase decisions often encompass hardware, software, and service costs rather than a single machine expense. This has led some growers to opt for retrofits, delay equipment replacement, or rely on external service providers, even when the technical benefits of upgrading are evident. Without an easing of credit conditions or broader adoption of leasing models, the uptake of advanced technologies is likely to remain below its potential in several established farming regions.
Limited Operator and Agronomy Data Skills
Limited operator knowledge and inadequate digital agronomy capabilities continue to hinder the adoption of advanced technologies in the agriculture sprayers market. Precision spraying systems require operators to manage application settings, interpret field data, calibrate equipment, and address guidance or sensor-related issues during operations. In many developing agricultural regions, the availability of training and technical support infrastructure remains insufficient compared to the growing complexity of modern spraying equipment. This limits the efficiency gains achievable through precision technologies and slows adoption among small and medium-sized farms. Consequently, the gap between equipment capabilities and operator execution restricts productivity improvements and broader market penetration for advanced agricultural sprayers.
*Our forecasts treat driver/restraint impacts as directional, not additive. The impact forecasts reflect baseline growth, mix effects, and variable interactions.
Segment Analysis
By Source of Power: Battery-Operated Platforms Erode Conventional Fuel Dominance
The agriculture sprayers market share for the fuel-operated segment held the largest 36.0% in 2025. These sprayers maintain their dominance due to their longer operating endurance and suitability for large boom and self-propelled applications in broadacre farming systems. They are widely preferred in regions such as North America, South America, and Europe, where large field sizes necessitate uninterrupted spraying during narrow application windows. Manual and solar-assisted systems continue to serve niche roles in smallholder agriculture and greenhouse production. The segment's stability is further supported by established dealer networks, maintenance familiarity, and existing fuel infrastructure in major agricultural economies.
The agriculture sprayers market size for the battery-operated segment is forecasted to grow at the fastest 12.1% CAGR from 2026 to 2031. This growth is driven by increasing adoption of drones, lightweight autonomous platforms, and advancements in lithium-ion battery efficiency. Battery-powered systems are becoming increasingly suitable for orchard spraying, greenhouse operations, and compact field applications, where their lower operating noise and reduced emissions offer significant advantages. Manufacturers are also incorporating digital monitoring and automated application systems into battery-operated platforms to enhance precision and performance. Despite this growth, fuel-operated systems remain essential for high-capacity crop protection applications, where extended operating hours are critical for maintaining productivity.


By Product Type: UAV Sprayers Redefine Speed-to-Field Economics
Tractor-mounted systems accounted for the largest 41.4% share in 2025. These sprayers maintain a strong position due to their seamless integration with existing tractor fleets and their cost-effective approach to adopting precision spraying technologies. They are widely used in North America and Europe, where established agricultural machinery infrastructure supports consistent replacement demand. Additionally, trailed and self-propelled sprayers remain relevant for large-scale field operations that require higher tank capacities and wider boom coverage. This segment benefits from robust aftermarket support, easier maintenance, and compatibility with guidance and retrofit technologies commonly used in commercial farming operations.
Unmanned aerial vehicle sprayers are forecasted to expand at the fastest 28.1% CAGR from 2026 to 2031. This growth is driven by increasing labor shortages, rising demand for precision application, and the expanding adoption of aerial spraying in orchards, rice fields, and specialty crops. Unmanned aerial vehicle (UAV) sprayers offer advantages such as terrain adaptability, reduced reliance on labor, and rapid deployment during narrow treatment windows. Manufacturers are enhancing commercial adoption by providing training support, fleet management software, and autonomous route-planning systems. While ground-based sprayers continue to dominate global installed capacity, drone systems are increasingly being adopted for applications where speed, targeted spraying accuracy, and operational efficiency deliver greater economic value to agricultural operators.
By Application: Field Crops Anchor Volume, Orchards and Vineyards Drive Precision Investment
Field crops accounted for the largest market share at 45.2% in 2025. The extensive production of soybeans, corn, wheat, and cotton drives significant demand for high-capacity boom and self-propelled spraying equipment. These operations necessitate frequent applications of fungicides, herbicides, and insecticides, where speed of field coverage and precise application timing are critical operational factors. Additionally, field crop spraying benefits from well-established dealer support networks, wider availability of replacement parts, and greater agronomic expertise compared to specialized applications. Meanwhile, greenhouse, turf, and landscaping applications maintain a smaller yet stable demand, supported by controlled-environment spraying needs and the increasing adoption of advanced precision application technologies in commercial and municipal maintenance operations worldwide.
Orchards and vineyards are forecasted to grow at the fastest CAGR of 13.9% from 2026 to 2031. This growth is attributed to rising labor shortages and increasing demand for precision spraying technologies in permanent crop systems. Specialty-crop environments are particularly well-suited for autonomous navigation, targeted spraying, and drone-based applications, as their repetitive row structures enhance operational efficiency. Manufacturers are focusing on developing compact autonomous sprayers and digital orchard management systems tailored for vineyards and fruit cultivation. Despite the growing investment in permanent crop technologies, field crops remain the dominant application category due to the higher overall spraying volumes and larger installed equipment fleets required for broadacre farming across global agricultural production systems.
By Spray Volume Capacity: Ultra-Low Volume Surges on Drone-Led Demand
Low volume platforms accounted for the largest 48.3% share in 2025. These spraying systems are widely adopted due to their ability to balance application efficiency, chemical coverage, and operational flexibility, particularly in broadacre farming systems. They are predominantly used in cereal, oilseed, and row-crop applications across North America, Europe, and South America, where standard herbicide and fungicide programs dominate spraying activities. High-volume systems, on the other hand, continue to serve specialized applications in orchards and vegetable crops, which require dense canopy penetration and higher liquid delivery rates. Low-volume spraying systems remain structurally significant as they align effectively with conventional crop protection practices employed in major agricultural production regions globally.
Ultra-low volume systems are forecasted to grow at the fastest 21.4% CAGR from 2026 to 2031. This growth is driven by the increasing deployment of agricultural drones and the rising preference for targeted aerial spraying applications. Ultra-low volume systems enable reduced carrier usage, enhanced operational efficiency, and greater compatibility with automated spraying technologies. Manufacturers are focusing on developing specialized nozzles, pumps, and droplet-control technologies optimized for low-volume aerial delivery. While conventional low-volume platforms continue to maintain broad demand in field crop production, the adoption of ultra-low volume systems is accelerating, particularly in commercial service fleets and precision-focused crop protection programs across various agricultural regions worldwide.
By Technology Level: Conventional Still Leads, but AI-Enabled and Autonomous Systems Post the Fastest Growth
Conventional systems accounted for the largest 52.8% of the agriculture sprayer market share in 2025. These systems remain dominant due to their affordability, ease of repair, and long replacement cycles, which are critical factors for many agricultural regions. This trend is particularly evident in South Asia, Africa, and other developing farming economies where advanced precision technologies are often cost-prohibitive. Precision-guided systems are gradually gaining traction as intermediate solutions, offering improved application control without requiring full adoption of autonomous technologies. The segment reflects a phased technology transition, with growers increasingly incorporating selected digital features into existing equipment while continuing to rely on mechanically simpler systems for mainstream agricultural operations and cost-sensitive farming environments.
Artificial intelligence-enabled and autonomous systems are projected to grow at the fastest 29.1% CAGR from 2026 to 2031. This growth is driven by increasing demand for targeted spraying, machine vision, and automated field operations that enhance chemical efficiency and reduce labor dependency. Manufacturers are integrating artificial intelligence, geospatial mapping, and autonomous navigation into spraying platforms to improve compatibility across various crops. These advanced systems are also enhancing operating speeds and precision application performance in both row-crop and specialty-crop farming. However, despite the rapid adoption of these technologies, conventional systems remain the most widely installed category, as many agricultural operators weigh technology investments against affordability, infrastructure readiness, and operator training challenges in global farming markets.
By Pump Mechanism: Diaphragm Pumps Lead While Centrifugal Pumps Gain on Drone Proliferation
Diaphragm pumps accounted for the largest 42.8% share in 2025. These pumps are widely preferred due to their strong chemical compatibility, self-priming capability, and durability under abrasive spraying conditions commonly encountered in row-crop agriculture. Diaphragm systems are extensively integrated into conventional boom sprayers and tractor-mounted equipment, where operational reliability is a key purchasing criterion. Piston pumps also play a significant role in high-pressure spraying applications, such as orchard air-blast systems and heavy-duty crop protection equipment. This segment benefits from established engineering familiarity and lower maintenance complexity, which supports its continued adoption in mainstream agricultural spraying applications and across extensive installed equipment fleets globally.
Centrifugal pumps are projected to expand at the fastest 10.5% CAGR from 2026 to 2031. This growth is driven by increasing drone adoption and the broader shift toward low-pressure aerial spraying systems. These pumps are increasingly used in lightweight and ultra-low volume spraying platforms due to their efficient liquid handling capabilities and simplified system integration. Agricultural spraying requirements are diversifying as aerial application technologies expand into orchards, specialty crops, and commercial spraying fleets. Despite the stronger growth of centrifugal systems, diaphragm pumps continue to hold the largest installed base, as conventional ground spraying equipment remains essential for large-scale field crop protection operations in major agricultural production economies.
Geography Analysis
North America held the largest 32.0% share in 2025. This leadership is attributed to extensive production systems for crops such as corn, soybean, wheat, and canola, which require high-capacity spraying operations. The United States drives regional demand through the widespread adoption of self-propelled sprayers, precision application technologies, and digital farm management systems. Canada also contributes significantly, with large commercial grain operations necessitating advanced spraying equipment capable of high field coverage. Factors such as an established dealer network, recurring equipment replacement cycles, and strong adoption of precision agriculture technologies continue to support stable demand for advanced agricultural spraying platforms across large-scale commercial farming operations in the region.
Asia-Pacific is forecast to grow at the fastest 8.5% CAGR from 2026 to 2031. This growth is driven by increasing farm mechanization, rising deployment of agricultural drones, and expanding government support for precision agriculture technologies. China is advancing agricultural equipment modernization through subsidy programs that promote plant protection drones and smart farming technologies. India, Japan, and Australia are also increasing the adoption of Unmanned Aerial Vehicle (UAV) spraying systems, as labor shortages and challenging terrain enhance the economic value of aerial spraying. Regional manufacturers are focusing on expanding operator training, dealer support, and digital spraying ecosystems, solidifying Asia-Pacific’s position as a growing hub for the production and development of advanced agricultural spraying solutions globally.
Europe remains a mature market influenced by regulatory frameworks, where recurring equipment renewal is driven by compliance requirements and improved application control. The European Commission's December 2025 simplification proposal has introduced the possibility of general drone derogations under specific risk conditions, potentially expanding the market for Unmanned Aerial Vehicle (UAV) spraying after 2026. In South America, Brazil's extensive commercial farming base and strong demand for tractor-mounted and self-propelled equipment make the region significant. Meanwhile, the Middle East and Africa, though at an earlier stage, are becoming increasingly relevant as food security objectives and export residue standards encourage selective precision upgrades.

Competitive Landscape
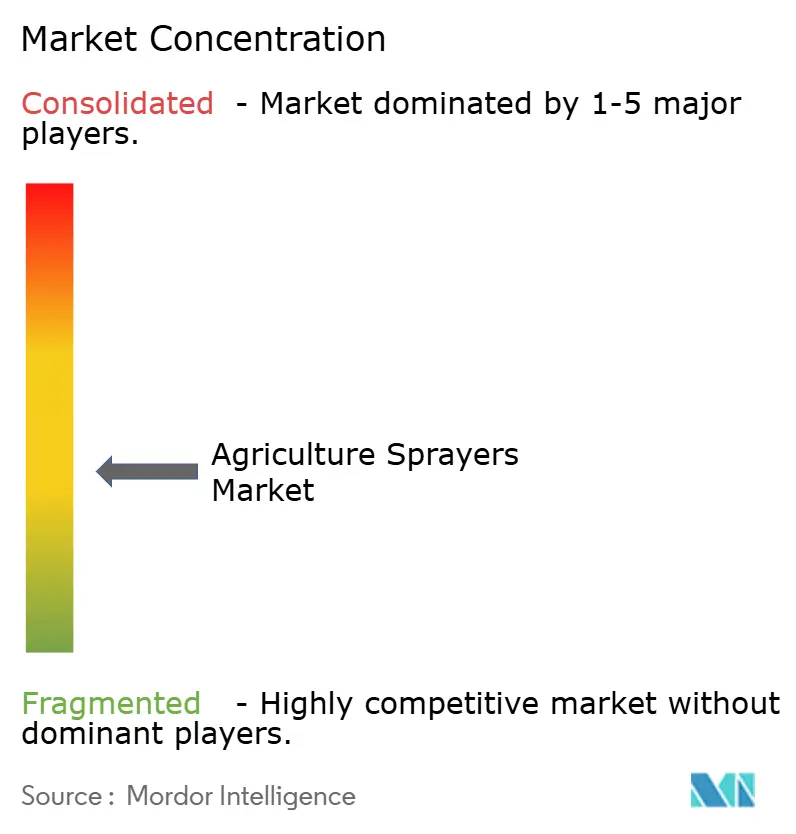
The market remains moderately fragmented with competition distributed among diversified agricultural equipment manufacturers and specialized spraying technology providers. Major players such as Deere & Company, CNH Industrial N.V., AGCO Corporation, SZ DJI Technology Co., Ltd., and Kubota Corporation compete through extensive agricultural machinery portfolios and integrated precision agriculture technologies. Meanwhile, specialized companies like EXEL Industries, Máquinas Agrícolas Jacto S.A., and HORSCH Maschinen GmbH maintain strong positions in crop-protection-focused applications. Competitive differentiation is increasingly driven by precision software integration, dealer support capabilities, digital spraying ecosystems, and crop-specific application expertise, rather than solely by mechanical hardware scale.
Manufacturers are increasingly focusing investment on autonomy, specialty-crop spraying, and digital agriculture integration. Strategic activities since 2025 have emphasized autonomous navigation, targeted application systems, and robotics-enabled crop protection technologies. Companies are also expanding partnerships, software ecosystems, and precision application capabilities to enhance their long-term positioning in high-value agricultural segments. Drone manufacturers are heavily investing in operator training, route-planning software, and fleet management support to improve scalability and adoption. These trends indicate a shift in competitive strategies toward integrated technology ecosystems, where hardware, software, automation, and aftermarket support are developed cohesively rather than as separate product categories within global agricultural spraying operations.
The competitive landscape is increasingly shifting towards an ecosystem-driven approach, with agricultural drone suppliers expanding their offerings beyond equipment manufacturing to include training, software, and data management services. For example, SZ DJI Technology Co., Ltd. reported that by the end of 2025, over 600,000 SZ DJI Technology Co., Ltd. agricultural drones were in operation globally, supported by more than 600,000 trained operators across over 100 countries. Companies are incorporating features such as prescription mapping, autonomous route planning, and digital fleet management into their spraying platforms. Vendors that combine reliable hardware with agronomic workflow support and robust aftersales services are enhancing their competitive position, as precision spraying technologies become more reliant on software within commercial agricultural operations.
Agriculture Sprayers Industry Leaders
Deere & Company
AGCO Corporation
CNH Industrial N.V.
Kubota Corporation
SZ DJI Technology Co., Ltd.
- *Disclaimer: Major Players sorted in no particular order

Recent Industry Developments
- February 2026: Kubota Corporation conducted a EUR 6.5 million (USD 6.8 million) pre-Series B investment round in Kilter AS, a developer specializing in ultra-precise spot-spraying robots for high-value crop applications. Additionally, the company established a commercial distribution partnership for Germany and the Netherlands.
- November 2025: Kubota Corporation introduced the next-generation KFAST autonomous sprayer at Agritechnica 2025 in Hannover, Germany, with a limited commercial launch planned for mid-2026. The KFAST platform is designed for specialty-crop operators addressing significant labor shortages, positioning Kubota Corporation as a comprehensive autonomous sprayer provider.
- August 2025: Deere & Company has completed the acquisition of GUSS Automation, a producer of autonomous orchard and vineyard sprayers. GUSS Automation has a fleet of over 250 units and a documented operating history covering more than 2.6 million acres. This acquisition expands Deere & Company's autonomous application portfolio to include high-value specialty crop environments in addition to broadacre row crops.


Research Methodology Framework and Report Scope
Market Definitions and Key Coverage
Our study defines the agricultural sprayers market as every powered or manual device and integrated boom, nozzle, or drone system used to atomize and deliver crop-protection chemicals, foliar nutrients, and irrigation water across open fields, orchards, greenhouses, and turf. Units range from small knapsack sets to tractor-mounted rigs, self-propelled high-clearance machines, and autonomous UAV platforms.
Scope exclusion: replacement pumps, stand-alone nozzles, and aftermarket parts sold separately are not valued.
Segmentation Overview
- By Source of Power
- Manual
- Battery-Operated
- Solar-Powered
- Fuel-Operated
- By Product Type
- Handheld
- Tractor-Mounted
- Trailed
- Self-Propelled
- Unmanned Aerial Vehicle Sprayers
- By Application
- Field Crops
- Orchards and Vineyards
- Greenhouse Crops
- Turf and Gardening
- By Spray Volume Capacity
- Ultra-Low Volume
- Low Volume
- High Volume
- By Technology Level
- Conventional
- Precision and GPS-Guided
- Artificial Intelligence-Enabled and Autonomous
- By Pump Mechanism
- Diaphragm Pumps
- Piston Pumps
- Centrifugal Pumps
- By Geography
- North America
- United States
- Canada
- Mexico
- Rest of North America
- South America
- Brazil
- Argentina
- Rest of South America
- Europe
- Germany
- United Kingdom
- France
- Italy
- Spain
- Russia
- Rest of Europe
- Asia-Pacific
- China
- India
- Japan
- Australia
- Rest of Asia-Pacific
- Middle East
- Saudi Arabia
- United Arab Emirates
- Turkey
- Rest of Middle East
- Africa
- South Africa
- Nigeria
- Rest of Africa
- North America
Detailed Research Methodology and Data Validation
Primary Research
Interviews and surveys with sprayer engineers, agro-chemical distributors, large growers, and drone-service start-ups across Asia-Pacific, the Americas, Europe, and Africa validated selling prices, replacement cycles, and adoption ceilings, which we used to refine desk assumptions.
Desk Research
Mordor analysts began with publicly available machinery output statistics from the FAO, USDA, Eurostat, and India's Ministry of Agriculture and then mapped those series to customs codes accessed through Volza shipment dashboards. We overlaid dealer price lists, audited company filings, Dow Jones Factiva news, patent counts from Questel, and trade papers issued by AEM and CEMA to size revenue pools and spot technology shifts. The sources named are illustrative; numerous additional repositories supported data gathering, cross-checks, and clarifications.
Market-Sizing & Forecasting
A top-down model starts with national production plus net imports and expected fleet retirements, which are then reconciled with sampled average selling price times volume roll-ups from supplier discussions to balance totals. Key variables include hectares under mechanized cropping, pesticide application intensity, subsidy disbursements, labor cost inflation, UAV regulatory approvals, and battery price curves. Forecasts apply multivariate regression blended with scenario analysis so that weather or policy shocks stay visible. When bottom-up evidence is scarce, we interpolate from the nearest regional proxy before seeking respondent confirmation.
Data Validation & Update Cycle
Outputs pass three layers of variance testing against pesticide use data, OEM backlog reports, and commodity price trends; anomalies trigger fresh calls before sign-off. The model refreshes each year, with interim revisions issued when major policy or technology events shift market direction.
Why Mordor's Agricultural Sprayers Baseline Commands Reliability
Published estimates often differ because every research house chooses its own product mix, base year, and conversion logic, while end users mostly see the headline number.
Differences in other studies arise from excluding UAV and battery units, working off older currency bases, or counting only factory shipments without aftermarket value; by contrast, Mordor's disciplined scope, multi-source inputs, and annual refresh keep our view balanced and current.
Benchmark comparison
| Market Size | Anonymized source | Primary gap driver |
|---|---|---|
| USD 5.10 B (2025) | Mordor Intelligence | - |
| USD 3.32 B (2025) | Global Consultancy A | Omits UAV and battery models |
| USD 3.38 B (2023) | Regional Consultancy B | Older base year, minimal inflation adjustment |
| USD 2.50 B (2022) | Trade Journal C | Counts factory shipments only, no aftermarket value |
The comparison shows that our numbers sit higher because we capture newer technologies, current-year pricing, and aftermarket flows, giving decision-makers a dependable, transparent baseline they can trace, question, and replicate.


Key Questions Answered in the Report
What is the size of the agriculture sprayers market anticipated to reach by 2031?
The agricultue sprayers market size for agriculture sprayers is projected to reach at USD 6.7 billion in 2031.
Which product category is expanding the fastest through 2031?
Unmanned Aerial Vehicle (UAV) Sprayers are growing the fastest, with a projected 28.1% CAGR from 2026 to 2031.
Which application area still drives the largest revenue base?
Field crops remain the largest application segment with 45.2% share in 2025.
Which region leads demand and which region is growing the fastest?
North America led with the largest 32.0% share in 2025, while Asia-Pacific is the fastest-growing region with an 8.5% CAGR from 2026 to 2031.
Page last updated on:


