Drip Irrigation Market Size and Share
Market Overview
| Study Period | 2021 - 2031 |
|---|---|
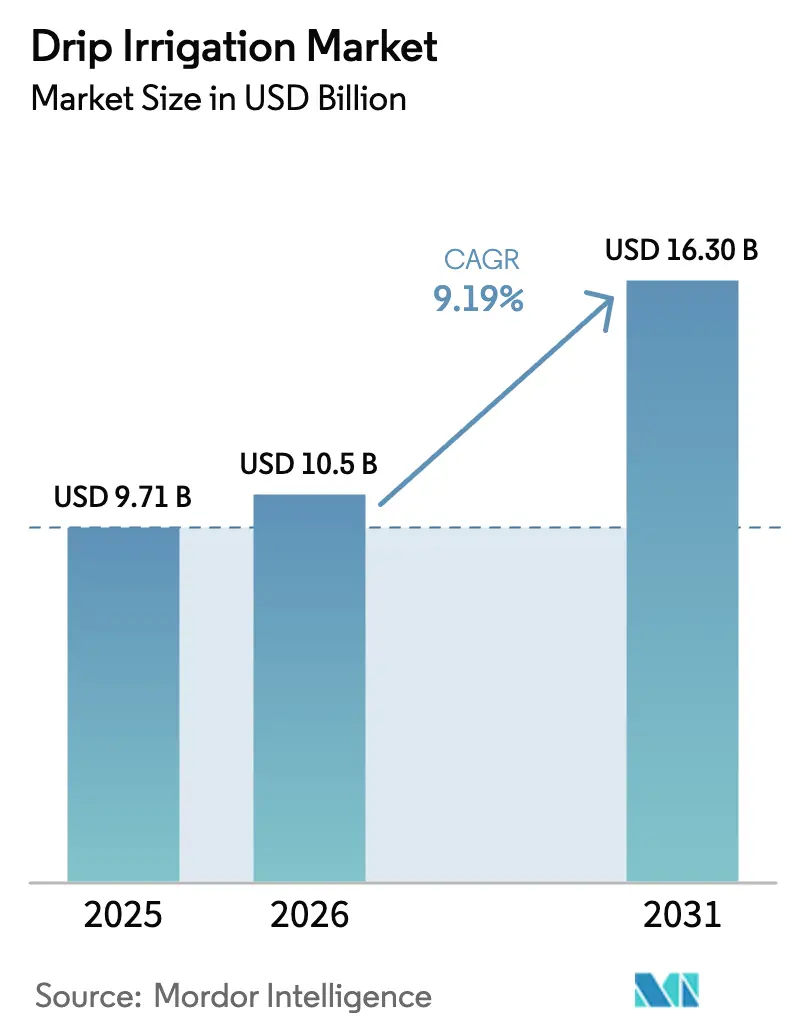
| Market Size (2026) | USD 10.5 Billion |
| Market Size (2031) | USD 16.30 Billion |
| Growth Rate (2026 - 2031) | 9.19% CAGR |
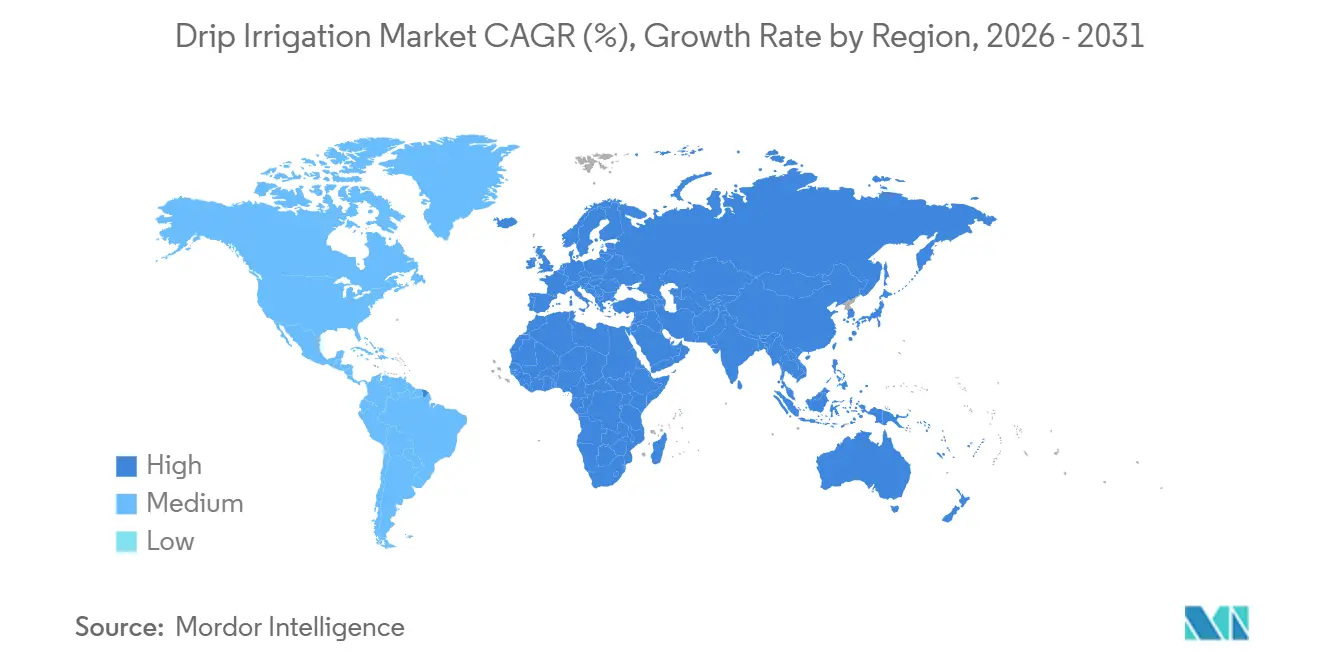
| Fastest Growing Market | Africa |
| Largest Market | Asia Pacific |
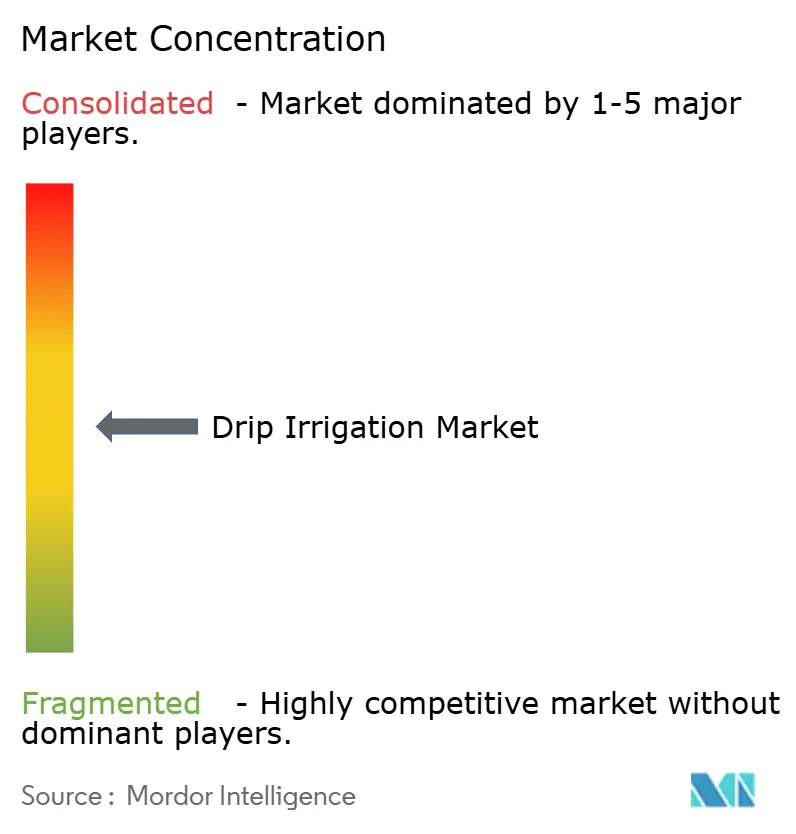
| Market Concentration | Medium |
Major Players *Disclaimer: Major Players sorted in no particular order Image © Mordor Intelligence. Reuse requires attribution under CC BY 4.0. | |
Drip Irrigation Market Analysis by Mordor Intelligence
The drip irrigation market size was valued at USD 9.71 billion in 2025 and is estimated to reach USD 10.50 billion in 2026, further projected to grow at a CAGR of 9.19% to reach USD 16.30 billion by 2031, underscoring a decisive shift toward water-efficient farming systems. Rising groundwater depletion, stronger precision-agriculture economics, and expanded government subsidies compress capital recovery periods to fewer than three years, steering growers toward automated micro-irrigation. Controllers and sensors that cut labor use by 20% to 30% spur component upgrades, while online retail platforms open direct-to-grower channels in price-sensitive regions. Competitive intensity remains moderate as the top five suppliers defend their margins through vertical integration and digital service bundles, even as low-cost Asian entrants chip away at market share in developing economies. Africa logs the fastest regional growth, while the Asia-Pacific region anchors absolute demand through India’s large subsidy program and China’s modernization of its cotton belt.
Key Report Takeaways
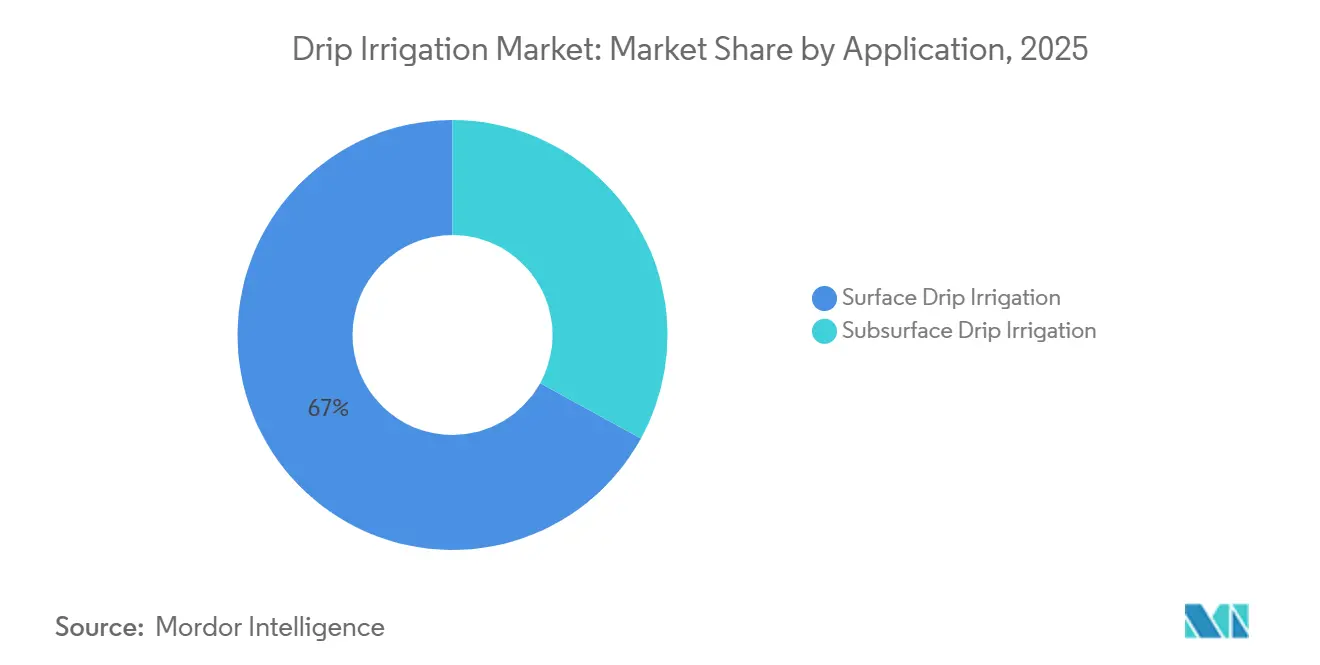
- By application, surface systems held a 67.0% revenue share in 2025, whereas subsurface technology is projected to expand at an 11.6% CAGR through 2031.
- By component, drip tubes accounted for a 30.0% share of the drip irrigation market in 2025; however, controllers and sensors are projected to have the highest CAGR of 14.0% through 2031.
- By crop type, field crops captured 48.5% of demand in 2025, and orchard crops will post a 10.2% CAGR from 2026 to 2031.
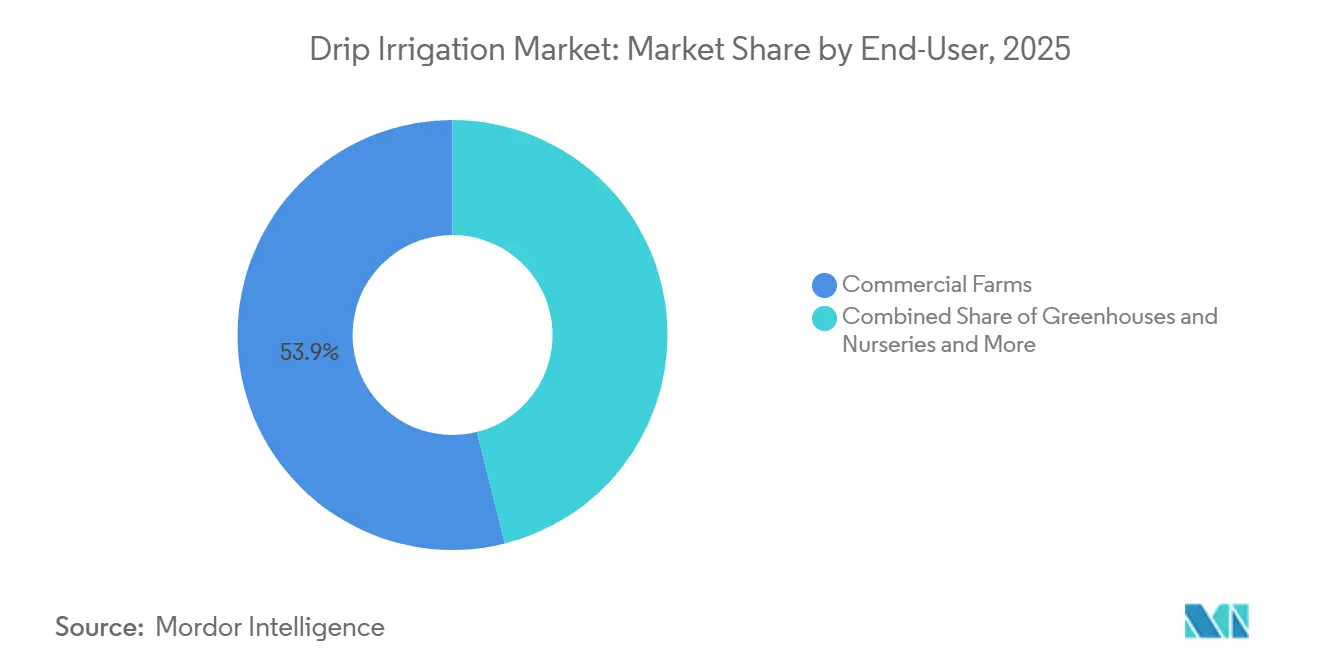
- By end-user, commercial farms held 53.9% revenue share in 2025, while residential landscapes are forecast to expand at a 9.8% CAGR through 2031.
- By sales channel, dealers and distributors accounted for 46% of the drip irrigation market share in 2025, whereas online retail is projected to log the fastest CAGR of 13.3% through 2031.
- By region, Asia-Pacific led with 42.0% of the drip irrigation market size in 2025, while Africa is poised for an 11.0% CAGR through 2031.
Note: Market size and forecast figures in this report are generated using Mordor Intelligence’s proprietary estimation framework, updated with the latest available data and insights as of January 2026.
Global Drip Irrigation Market Trends and Insights
Drivers Impact Analysis*
| Driver | (~) % Impact on CAGR Forecast | Geographic Relevance | Impact Timeline |
|---|---|---|---|
| Government subsidies for micro-irrigation | +1.8% | India, United States, Israel, and Middle East | Medium term (2-4 years) |
| Precision agriculture adoption | +1.5% | North America and Europe, expanding in Brazil and Australia | Medium term (2-4 years) |
| Escalating water scarcity | +2.2% | Asia-Pacific, Middle East, and North Africa | Long term (≥ 4 years) |
| Proven 20%-40% yield gains | +1.3% | Global, strongest in field and orchard crops | Short term (≤ 2 years) |
| Internet of Things (IoT) Sensor Integration Unlocks Precision Water Management | +1.0% | North America, Europe, Israel, emerging in India and China | Medium term (2-4 years) |
| Climate-resilient cropping mandates | +0.9% | Asia-Pacific, Middle East, Africa, and Mediterranean Europe | Long term (≥ 4 years) |
| Source: Mordor Intelligence | |||
Government subsidies for micro-irrigation
Fiscal incentives compress capital-recovery timelines for commercial growers. India’s Pradhan Mantri Krishi Sinchayee Yojana disbursed INR 21,968.7 crore (USD 2.6 billion) between fiscal years 2016 and 2025, subsidizing up to 55% of the system cost for small farmers[1]Source: Ministry of Agriculture and Farmers Welfare, “Pradhan Mantri Krishi Sinchayee Yojana,” agricoop.nic.in. The United States allocated USD 300 million annually through the Environmental Quality Incentives Program, with drip accounting for 42% of funded projects in 2024[2]Source: USDA Natural Resources Conservation Service, “Environmental Quality Incentives Program,” nrcs.usda.gov. Israel’s tax credits trimmed effective capital outlay by 30%, while Saudi Arabia mandated drip on new farms larger than 10 hectares, channeling USD 500 million in grants. Across programs, payback now falls below 2.5 years for high-value crops, such as vegetables and orchards, driving sustained growth in the drip irrigation market.
Precision agriculture adoption
Large farms incorporate drip systems, satellite imagery, soil sensors, and variable-rate controllers. Precision technology adoption reached 68% among United States farms exceeding 1,000 acres by 2025, with 35% utilizing controlled irrigation. Australian cotton growers reduced water use by 22% while maintaining lint yields through the integration of Internet of Things (IoT) Sensors, Unlocking Precision Water Management-Enabled drip irrigation. Brazilian sugarcane estates increased sucrose content by 8%-12% via forecast-guided fertigation. Controller prices fell 18% from 2023 to 2025, facilitating the adoption of automation in mid-size operations and solidifying the drip irrigation market as a cornerstone of digital farming.
Escalating water scarcity
Groundwater tables dropped 0.3-1 meter annually in major basins from 2020 to 2025, transforming drip from an efficiency option to a survival strategy. California’s Sustainable Groundwater Management Act requires a balance by 2040, prompting the conversion of 120,000 hectares of almond and pistachio orchards to drip irrigation between 2023 and 2025. India lists 256 districts in a critical groundwater status, and state mandates are pushing sugarcane and cotton toward micro-irrigation. Desalinated water in Saudi Arabia and the United Arab Emirates replenishes fossil aquifers, however, conditional farm permits often require drip irrigation, thereby reinforcing structural demand.
Internet of Things (IoT) Sensor Integration Unlocks Precision Water Management
Capacitance sensors, combined with cloud analytics, reduce water use by 12% to 16% compared to fixed-schedule drip irrigation in Arizona trials. Netafim’s digital platform increased greenhouse tomato water productivity by 28% above the national average. Maharashtra subsidized sensor kits for 15,000 farmers, resulting in a 22% reduction in pump electricity costs. Sensor prices slid from USD 150 to USD 80 between 2023 and 2025, broadening adoption beyond early adopters.
Restraints Impact Analysis*
| Restraint | (~) % Impact on CAGR Forecast | Geographic Relevance | Impact Timeline |
|---|---|---|---|
| Capital Constraints Limit Smallholder Adoption | −1.2% | Asia-Pacific, Africa, and South America | Short term (≤ 2 years) |
| Clogging Escalates Operating Costs in Hard-Water Zones | −0.8% | Middle East, North Africa, and South Asia | Medium term (2-4 years) |
| Dealer Fragmentation Impedes Service Quality | −0.6% | Africa, Southeast Asia, and parts of South America | Medium term (2-4 years) |
| Electricity Subsidies Distort Irrigation Choices | −0.7% | India, Pakistan, and selected Middle Eastern countries | Short term (≤ 2 years) |
| Source: Mordor Intelligence | |||
Capital Constraints Limit Smallholder Adoption
Installation costs of USD 1,200-USD 1,800 per hectare exceed annual farm incomes in many two-hectare operations. Despite 55% subsidies in India, out-of-pocket spending still tops USD 540 per hectare, above collateral-free borrowing limits. Pay-as-you-go pilots in Bangladesh, priced at USD 15 per month, achieved a 72% repayment rate yet remain small-scale. Until hardware prices drop by another 20%-30%, financing will align with crop cycles, however, penetration in fragmented holdings will lag behind the broader drip irrigation market.
Clogging Escalates Operating Costs in Hard-Water Zones
Total dissolved solids above 1,000 ppm trigger emitter clogging within three years, reducing system life to eight years and incurring costs of USD 80-USD 120 per hectare for acid flushing. Desalinated water in the Gulf still precipitates salts, forcing filtration investments of USD 200-USD 400 per hectare. Maintenance burdens hit smallholders the hardest, driving abandonment rates above 15% in high-salinity belts and tempering overall growth in the drip irrigation market.
*Our forecasts treat driver/restraint impacts as directional, not additive. The impact forecasts reflect baseline growth, mix effects, and variable interactions.
Segment Analysis
By Application: Surface Systems Dominate, Subsurface Leads Growth
Surface drip irrigation retained the largest share at 67.0% of the by-application segment in 2025, reflecting its lower installation cost and suitability for annual crops. Subsurface drip irrigation is the fastest-growing sub-segment and is projected to expand at an 11.6% CAGR through 2031, as orchard and vineyard operators focus on reducing evaporative losses and weed pressure. Rising long-term water stress drives the adoption of subsurface irrigation beyond premium crops, increasing its contribution to the drip irrigation market by the end of the forecast window[3]Source: Journal of Irrigation and Drainage Engineering, “Subsurface Drip Irrigation Performance,” ascelibrary.org.
As component prices gradually decline and guidance technologies improve, growers are pairing subsurface lines with soil-moisture sensors that fine-tune scheduling, increasing water-use efficiency to up to 90% in premium orchards. State incentives in India and allocation cuts under the Sustainable Groundwater Management Act in California also favor buried systems, shortening payback periods to fewer than four seasons. Surface systems will remain influential for short-cycle crops. However, rising electricity tariffs and stricter evaporation caps will progressively reallocate capital toward subsurface installations. The combined shift sustains balanced growth across both formats, but the faster trajectory of subsurface technology underpins long-run upgrades in the drip irrigation market.


By Component: Tubes Lead Revenue, Controllers Drive Acceleration
Drip tubes and lines held the largest share at 30.0% of the by-component segment in 2025, driven by regular replacement cycles and the expansion of broad acreage. Controllers and sensors represent the fastest-growing sub-segment, advancing at a 14.0% CAGR through 2031 as farms automate water delivery, trim labor by up to 30%, and integrate real-time weather data. The drip irrigation market size, linked to digital hardware, therefore tracks well above the overall market pace, buoyed by falling sensor prices and cloud-based analytics that compress the payback period to less than three years.
Growth in higher-value electronics also helps incumbents shield margins as price competition intensifies for commoditized emitters, where Chinese pressure-compensating units now sell for USD 0.08 each. Filters and pumps are rising steadily in response to water-quality and off-grid trends, yet digital devices remain the clear performance differentiator. Manufacturers bundle software subscriptions with controllers, generating recurring revenue and securing clients for future upgrades. As adoption spreads from mega-farms to mid-size operators, sensor penetration will continue to accelerate, keeping controllers and sensors at the forefront of component-level growth.
By Crop Type: Field Crops Anchor Demand, Orchards Climb Fast
Field crops accounted for the largest share, at 48.5% of the by crop type segment in 2025, driven by extensive acreage of cotton, sugarcane, and maize across the Asia-Pacific and South America regions. Orchard crops emerge as the fastest-growing sub-segment, projected to rise at a 10.2% CAGR through 2031 as permanent plantings amortize system costs over decades and regulators tighten water allocations for high-value fruit and nut trees. The switch from flood to drip in California and Spain lifts returns per cubic meter of water, making orchards a focal point for premium hardware such as subsurface tape and variable-rate controllers.
Vegetables and vineyards also enjoy robust adoption because precise fertigation boosts marketable yields 25% to 35% and enhances wine-grape quality scores. By contrast, landscape and ornamental segments grow from a smaller base yet benefit from urban water restrictions that favor drip over pop-up sprinklers. Across all crop groups, yield premiums of 20%-40% coupled with shrinking groundwater reserves ensure continued uptake, but the steeper orchard trajectory underscores a shift toward long-lived installations with higher revenue density per hectare.
By End-User: Commercial Farms Remain Core, Residential Demand Accelerates
Commercial farms retained the largest share, 53.9%, of the end-user segment in 2025, reflecting large project sizes and access to subsidized finance in India, China, and the United States. Residential gardens and landscapes form the fastest-growing sub-segment, projected to post a 9.8% CAGR through 2031 as homeowners respond to tiered water pricing and utility rebates of USD 200-USD 500 per installation. Greenhouses are situated in the middle, capturing strict nutrient runoff regulations and achieving 85% water savings through closed-loop drip systems.
Beyond rebate pull, residential growth is catalyzed by easy-to-install kits sold online for USD 80, covering 0.1 hectares, and by municipal ordinances limiting sprinkler runtimes to two days per week. Sports fields and golf courses, which account for only 4% of demand, are installing subsurface lines to meet drought mandates without compromising turf quality. For commercial farms, digital controllers and fertigation units enable compliance with nutrient-management plans, ensuring continued investment as farms expand their acreage. Together, these trends diversify the customer base while leaving large agribusinesses as the anchor of demand.
By Sales Channel: Dealers Hold Sway, Online Platforms Surge
Dealer and distributor networks held 46% of the drip irrigation market share in 2025 but grew at a slower rate of 8.5% as e-commerce expanded its reach. Online platforms are projected to clock a 13.3% CAGR through 2031, driven by value kits retailed at USD 80 for 0.1 hectare and same-week delivery. Direct sales to large farms remain vital, accounting for 38% of sales, with a focus on bundling customized design and agronomic audits. Dealer relevance persists in after-sales service, yet margins compress, compelling a shift toward advisory offerings rather than pure equipment resale.
Dealer and distributor outlets captured the largest share, at 46.0%, of the by-sales-channel segment in 2025, reflecting their entrenched rural networks and bundled installation services. Online retail is the fastest-growing sub-segment and is projected to log a 13.3% CAGR through 2031 as e-commerce platforms bypass dealer mark-ups, offer transparent pricing, and provide video tutorials for do-it-yourself installation. Direct sales to large farms remain important at 38%, leveraging customized system design and agronomic audits that optimize emitter spacing and flow rates.
Geography Analysis
The Asia-Pacific region holds the largest market share, accounting for 42% of the global revenue in the drip irrigation market in 2025. Favorable subsidy programs in India and broad modernization efforts in China encourage growers to convert vast field-crop acreage, allowing distributors to scale quickly. Governments couple capital grants with water-pricing reforms, making automated systems economically sensible even for mid-size farms. Manufacturers also localize production in India and Australia, reducing logistics costs and shortening delivery times for high-volume projects. Digital platforms that integrate soil sensors and weather data are attracting early adopters among large cotton estates in Xinjiang and specialty crop producers in Japan and South Korea.
Asia-Pacific’s expansion is underpinned by persistent groundwater depletion across the Indo-Gangetic Plain and by recurring drought in Australia’s Murray–Darling Basin. National climate action plans incorporate micro-irrigation into adaptation targets, creating a dependable multi-year demand for controllers, filters, and drip tape. Strong dealer networks in India and government e-marketplaces facilitate the integration of smallholders into organized procurement channels, which bundle installation with agronomic support. Export-oriented fruit growers in Thailand and Vietnam adopt subsurface lines to secure consistent quality for premium markets. Suppliers respond by offering subscription-based remote monitoring, ensuring system uptime during critical growth stages.
Africa is projected to record the fastest growth, registering an 11.0% CAGR through 2031, propelled by development-bank financing that pairs hardware with agronomic training. Kenya deploys drip kits in semi-arid counties, reducing crop losses from erratic rainfall and improving food security outcomes. Egypt promotes desert agriculture with the use of drip systems, enabling the high-value export of citrus and grapes despite its limited surface water resources. South Africa’s Western Cape wine region adopts deficit-irrigation strategies through sensor-guided drip irrigation, safeguarding vines during prolonged droughts. Middle East producers, Europe’s Mediterranean growers, and North American orchardists observe these successes and adapt similar models, reinforcing global momentum toward water-efficient farming.

Competitive Landscape
Market concentration is moderate. Netafim Limited (Orbia Advance Corporation), Jain Irrigation Systems Ltd. (Rivulis Irrigation Ltd.), The Toro Company, Lindsay Corporation, and Valmont Industries Inc. are the major players in the drip irrigation market, leveraging vertical integration and digital platforms. Netafim’s cloud-based scheduler increased water productivity by 15%-20% and generated software subscription revenue. Jain Irrigation trimmed its USD 180 million debt in 2024 and pivoted toward high-margin micro-irrigation, thereby sharpening its domestic competitiveness. Toro and Rain Bird cross-sell drip irrigation to their landscape base, embedding weather-smart controllers that save users 25% of their water.
Regional challengers from China and India offer hardware at 30%-40% lower prices, effectively pressing price points in developing markets. Dayu Irrigation secured a USD 8 million cotton project in Uzbekistan, signaling export ambition. Solar-powered drip irrigation packages are disrupting off-grid farming, with panel costs down 22% in just two years. Counterfeit parts, estimated at 12%-18% of emerging-market sales, threaten system reliability, prompting incumbents to promote ISO-compliant quality seals and extended service contracts.
White-space lies in smallholder pay-as-you-go financing and modular kits. Manufacturers are piloting bundled deals that align repayment with harvest cash flow, aiming to unlock latent demand and cement long-term loyalty within the drip irrigation market. Partnerships with microfinance institutions and mobile-money platforms reduce customer acquisition costs and enhance repayment visibility, making the approach scalable beyond pilots. Firms now embed prepaid telemetry chips that pause water flow when balances run low, protecting asset quality and encouraging timely top-ups. Usage data then feeds predictive-maintenance algorithms, allowing vendors to upsell replacement parts before breakdowns and expand revenue with agronomy-as-a-service subscriptions.
Drip Irrigation Industry Leaders
The Toro Company
Lindsay Corporation
Jain Irrigation Systems Ltd. (Rivulis Irrigation Ltd.)
Netafim Limited (Orbia Advance Corporation)
Valmont Industries Inc.
- *Disclaimer: Major Players sorted in no particular order

Recent Industry Developments
- January 2025: Netafim opened a USD 45 million facility in Gujarat to produce drip systems for 50,000 hectares annually, targeting expansion in Southeast Asia and Africa.
- October 2024: Netafim expanded its NetBeat digital platform within the drip irrigation market by embedding artificial intelligence (AI) algorithms for predictive scheduling across 50,000 hectares in Israel, California, and Australia, delivering 15-18% water savings while maintaining yield stability.
- June 2024: Rivulis Irrigation formed a joint venture with an East African development group to supply drip irrigation systems to 18,000 smallholders in Kenya, Tanzania, and Uganda, coupling finance and agronomic training to unlock the region’s drip irrigation market potential.


Research Methodology Framework and Report Scope
Market Definitions and Key Coverage
According to Mordor Intelligence, our study views the global drip irrigation market as the sale of complete new drip systems, including laterals, emitters, filters, pressure regulators, valves, pumps, and basic controllers, supplied to farms, greenhouses, landscaped estates, and sports turf worldwide. The definition follows the ISO micro-irrigation standard and tracks value in USD at manufacturer selling price.
Scope exclusion: Sprinkler, pivot, micro-sprinkler devices, and any revenue from refurbishment, installation service, or water-as-a-service contracts sit outside the scope.
Segmentation Overview
- By Application
- Surface Drip Irrigation
- Subsurface Drip Irrigation
- By Component
- Emitters and Drippers
- Drip Tubes and Lines
- Filters
- Pressure Pumps
- Valves and Fittings
- Controllers and Sensors
- Accessories (Stake, Joiners, and Plugs)
- By Crop Type
- Field Crops
- Vegetable Crops
- Orchard Crops
- Vineyards
- Other Crops (Commercial and Ornamental)
- By End-User
- Commercial Farms
- Greenhouses and Nurseries
- Residential Gardens and Landscapes
- Sports Fields and Golf Courses
- By Sales Channel
- Direct Sales
- Dealer and Distributor
- Online Retail
- By Geography
- North America
- United States
- Canada
- Mexico
- Rest of North America
- Europe
- Germany
- United Kingdom
- France
- Spain
- Italy
- Russia
- Rest of Europe
- Asia-Pacific
- India
- China
- Japan
- South Korea
- Australia
- Rest of Asia-Pacific
- South America
- Brazil
- Argentina
- Chile
- Rest of South America
- Middle East
- Israel
- Saudi Arabia
- United Arab Emirates
- Turkey
- Rest of Middle East
- Africa
- South Africa
- Egypt
- Kenya
- Rest of Africa
- North America
Detailed Research Methodology and Data Validation
Primary Research
Mordor analysts interviewed drip-system makers, irrigation dealers, agronomists, and large growers across Asia-Pacific, North America, Europe, and South America. These discussions clarified typical price spreads, subsidy pass-through rates, and adoption barriers, letting us reconcile interview ranges with desk findings.
Desk Research
We began by stitching together irrigated-crop acreage, subsidy disbursements, and water-tariff histories from sources such as FAO AQUASTAT, USDA ERS farm surveys, Eurostat structure counts, India's PMKSY dashboard, and Israel Water Authority statistics. Company 10-Ks, customs shipment data, and peer-reviewed journals on emitter clogging supplied cost and lifespan clues. Our team then drew on select paid databases, notably D&B Hoovers for revenue splits and Dow Jones Factiva for production news, to confirm shipment volumes. The sources listed are illustrative; many additional public and subscription references informed the desk phase.
Market-Sizing & Forecasting
We anchor 2025 demand with a top-down irrigated-area pool layered with crop-wise penetration ratios. We then align the total with sampled average selling prices and selective supplier roll-ups. Key variables inside the model include share of water-stressed hectares, government rebate intensity, greenhouse floor area, emitter density per hectare, fertilizer-through-drip usage, and irrigation labor costs. A multivariate regression links these drivers to historic sales and projects 2026-2030; abnormal residuals trigger manual review.
Data Validation & Update Cycle
Outputs pass two analyst reviews; variance alerts flag any ±5 percent gap versus fresh trade or customs prints, and we refresh the model each July. Material policy shifts prompt an interim update so clients receive the latest view.
Why Mordor's Drip Irrigation Baseline Stands Firm
Published estimates often diverge because firms fold drip into broader micro-irrigation kits, use different subsidy assumptions, or convert currencies on unmatched dates.
Our disciplined equipment-only scope, consistent FY-close exchange rates, and annual refresh keep Mordor's baseline dependable.
Benchmark comparison
| Market Size | Anonymized source | Primary gap driver |
|---|---|---|
| USD 1.79 bn (2025) | Mordor Intelligence | - |
| USD 5.60 bn (2024) | Global Consultancy A | Includes sprinklers and post-sale services |
| USD 6.10 bn (2023) | Regional Consultancy B | Uses list prices, omits subsidy offsets |
| USD 13.90 bn (2024) | Industry Journal C | Reports entire micro-irrigation category |
These contrasts show that our clear scope setting, variable tracking, and timely updates give decision-makers a balanced, transparent baseline they can trust.


Key Questions Answered in the Report
How large is the drip irrigation market in 2026 and where is it headed?
The drip irrigation market size is USD 10.50 billion in 2026 and is projected to reach USD 16.30 billion by 2031 at a 9.19% CAGR.
Which region contributes the most to global demand?
Asia-Pacific holds 42% of global revenue in 2025, driven by large subsidy programs in India and infrastructure upgrades in China.
What segment is growing fastest within the component category?
Controllers and sensors lead component growth, registering a CAGR of 14.0% during the 2026–2031 forecast period, reflecting accelerated automation on commercial farms.
Why are subsurface systems gaining popularity?
Subsurface drip cuts evaporative losses and weed pressure, delivering 18% water savings and faster payback for orchards and vineyards.
Page last updated on:


