South Africa Agriculture Market Analysis by Mordor Intelligence
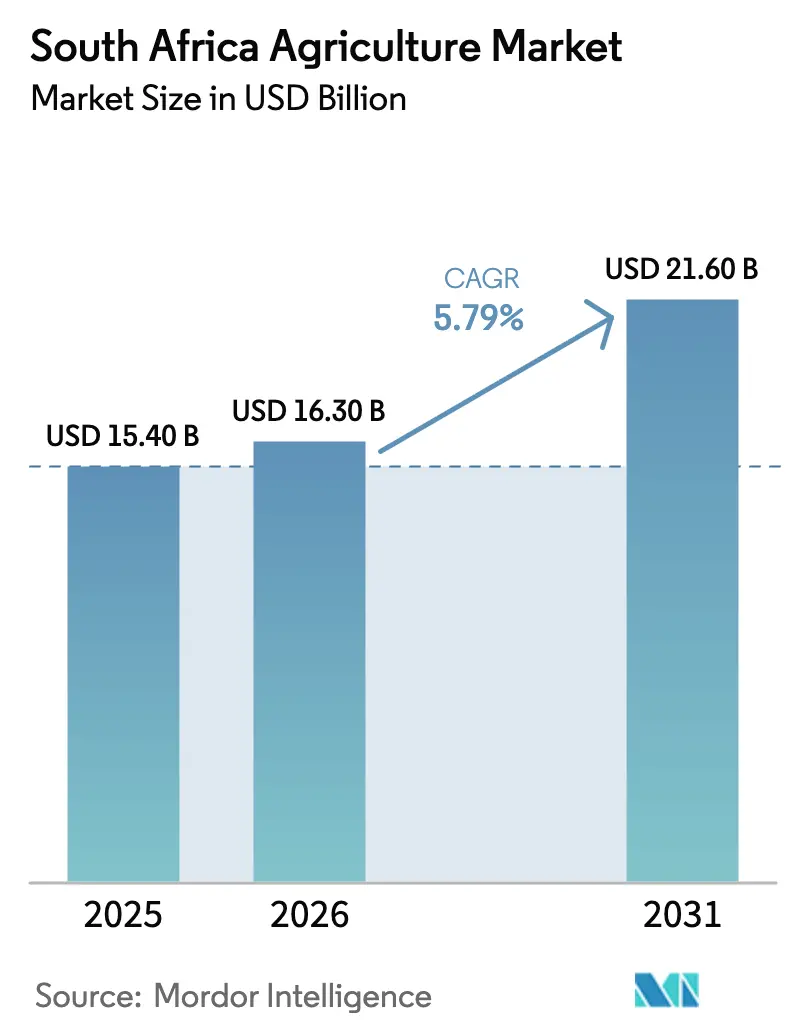
South Africa's agriculture market size is projected to expand from USD 15.4 billion in 2025 and USD 16.3 billion in 2026 to USD 21.6 billion by 2031, registering a CAGR of 5.79% between 2026 to 2031. Structural gains stem from export-oriented horticulture, rapid deployment of precision-agriculture tools, and expanded value-chain finance rather than pure acreage growth. Commercial farms lifted yield per hectare through satellite-guided fertilization, drone-based pest scouting, and soil-moisture sensors embedded in variable-rate irrigation rigs. Policy support under the Agriculture and Agro-processing Master Plan (AAMP) has unlocked USD 64 million for irrigation upgrades and packhouse expansion, resulting in a 15% reduction in post-harvest losses since 2024. Significant agricultural exports in 2024 highlighted the sector's dual role as a generator of foreign exchange and a cornerstone of domestic food security.
Key Report Takeaways
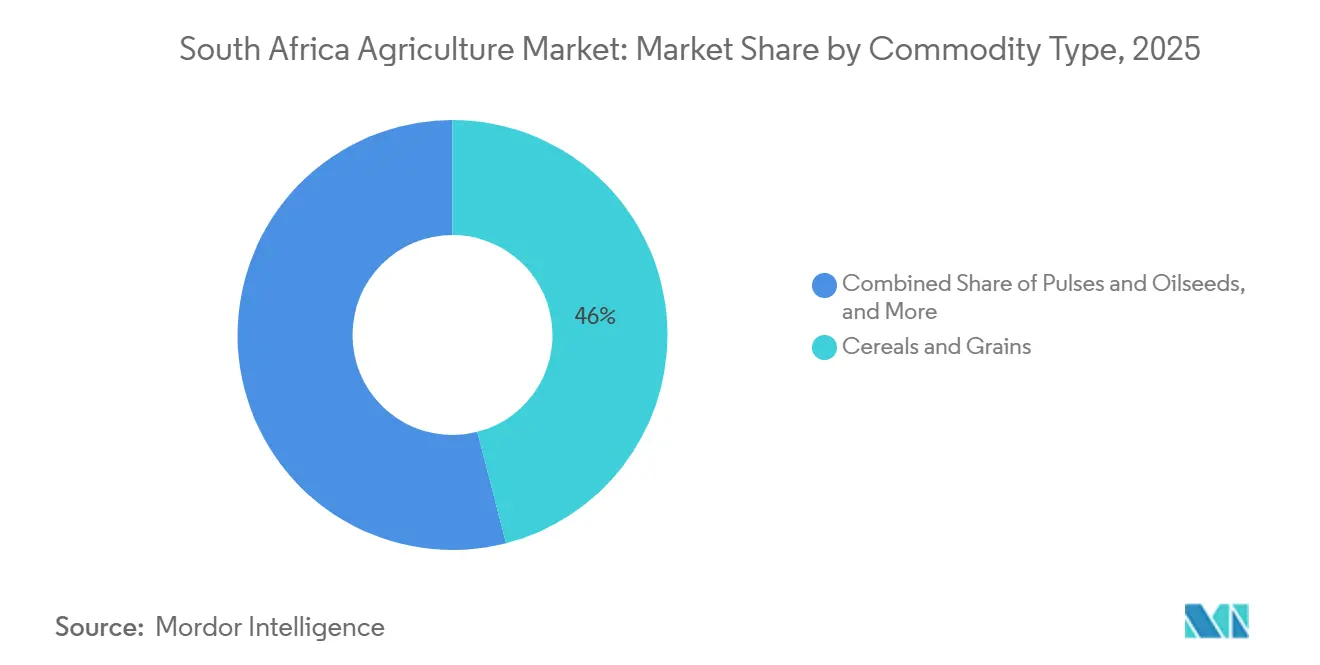
- By commodity type, cereals and grains led with 46% of South Africa agriculture market share in 2025, while vegetables are forecast to grow at a 6.9% CAGR through 2031.
Note: Market size and forecast figures in this report are generated using Mordor Intelligence’s proprietary estimation framework, updated with the latest available data and insights as of January 2026.
South Africa Agriculture Market Trends and Insights
Drivers Impact Analysis*
| Driver | (~) % Impact on CAGR Forecast | Geographic Relevance | Impact Timeline |
|---|---|---|---|
| High demand for food crops with a rising population | +1.8% | National, with concentration in Gauteng, Western Cape urban centers | Long term (≥ 4 years) |
| Adoption of advanced ag technologies | +1.2% | Western Cape, Mpumalanga, Free State commercial farming areas | Medium term (2-4 years) |
| Government support via the Agriculture and Agro-processing Master Plan | +0.9% | National, with priority focus on Eastern Cape, Limpopo transformation zones | Long term (≥ 4 years) |
| Surge in horticulture exports | +1.5% | Western Cape, Limpopo citrus regions, KwaZulu-Natal subtropical zones | Short term (≤ 2 years) |
| Expansion of carbon-credit revenue streams for regenerative practices | +0.7% | Free State, Northwest, Mpumalanga grain production areas | Medium term (2-4 years) |
| Corporate off-take agreements with retailers | +0.5% | National, with early adoption in the Western Cape, KwaZulu-Natal | Medium term (2-4 years) |
| Source: Mordor Intelligence | |||
High Demand for Food Crops With a Rising Population
South Africa agriculture market benefits from a population that is projected to reach 62 million by 2030, lifting urban demand for cereals, pulses, and fresh produce [1]Source: Statistics South Africa, “Population Projections 2030,” statssa.gov.za. Maize consumption, which supplies more than 60% of caloric intake, has remained near 11 million metric tons annually, while wheat-based foods are increasingly popular in metropolitan regions. Regional food-security mandates divert surplus cereals to Botswana, Namibia, and Zimbabwe, helping to stabilize producer cash flow during bumper harvests. Quarterly climate-adjusted yield forecasts have sharpened grain-reserve management, reducing import spikes in drought years. Rising disposable income is shifting plates toward higher-value proteins and greenhouse vegetables, generating downstream demand for fodder crops and protected cultivation infrastructure.
Adoption of Advanced Ag Technologies
Precision-agriculture platforms reached scale, as the Council for Scientific and Industrial Research (CSIR) mapped 450,000 hectares on its decision-support system by 2025. Variable-rate irrigation reduced water use by 18% to 25% on citrus and avocado estates in Limpopo, a critical step in a province prone to drought. Multispectral drones enabled early pest detection, reducing pesticide volumes by 12% and aligning farms with the Department of Forestry, Fisheries, and the Environment (DFFE) stewardship codes [2]Source: Council for Scientific and Industrial Research, “Precision Agriculture Information System,” csir.co.za. According to the International Soil Reference and Information Centre (ISRIC) Report, GPS-guided planters, now installed on 70% of large grain farms, have improved seed placement and increased maize and soybean yields by 5% to 8% since 2024. Data analytics, combined with agronomic advice, generated recurring revenue for equipment dealers. The flow of farm-level data is also improving credit risk assessment, thereby widening access to working capital lines.
Government Support Via the Agriculture and Agro-processing Master Plan
The AAMP, steered by the Department of Agriculture, Land Reform, and Rural Development (DALRRD), deployed ZAR 1.2 billion (approximately USD 64 million) in 2024 for irrigation canals, cold storages, and skills hubs. Twenty-two new refrigerated depots added 85,000 metric tons of capacity, halving spoilage in berries and stone fruit. Streamlined phytosanitary clearance now requires only seven days, down from fourteen, accelerating avocado and blueberry shipments to Europe. Preferential procurement earmarks have brought ZAR 800 million (USD 43 million) in institutional contracts to black-owned producers, although the provincial rollout remains uneven. The plan’s monitoring dashboard, updated quarterly, flags bottlenecks in licensing, export certification, and logistics, enabling rapid policy tweaks.
Surge in Horticulture Exports
According to the Citrus Growers’ Association (CGA), citrus exports experienced year-over-year growth following the adoption of new market protocols with China, Japan, and South Korea. Avocado volumes reached record levels, supported by packhouse upgrades that reduced shipping lead times by three days. Table grapes, apples, and pears benefited from preferential tariffs under the European Partnership Agreement. Transnet increased refrigerated rail slots, and the Cape Town port significantly expanded its reefer-container capacity. However, congestion at the Durban port led to cargo being redirected through Maputo and Walvis Bay. Since 2024, private equity funds have planted 8,500 hectares of blueberries and macadamias in Limpopo and Mpumalanga, capitalizing on higher export margins.
Restraints Impact Analysis*
| Restraint | (~) % Impact on CAGR Forecast | Geographic Relevance | Impact Timeline |
|---|---|---|---|
| Low land productivity and soil degradation | -1.1% | Eastern Cape communal areas, Free State marginal lands | Long term (≥ 4 years) |
| Limited access to affordable finance for smallholders | -0.8% | Rural areas across Limpopo, Eastern Cape, KwaZulu-Natal | Medium term (2-4 years) |
| Risk of losing duty-free access | -0.9% | Western Cape citrus regions, automotive manufacturing zones | Short term (≤ 2 years) |
| Increasing water licensing compliance costs | -0.6% | Commercial farming areas in the Western Cape, Mpumalanga | Short term (≤ 2 years) |
| Source: Mordor Intelligence | |||
Low Land Productivity and Soil Degradation
Roughly one-third of cropland suffers moderate to severe soil degradation marked by erosion, nutrient depletion, and declining organic matter. Maize yields in the Free State and North West average 4.5 metric tons per hectare, 35% below hybrid potential, primarily due to low soil pH and compaction. A national survey identified 2.1 million hectares that require lime application, at a cost of ZAR 1,800 to ZAR 2,500 (USD 97 to USD 135) per hectare, a burden that most smallholders cannot afford. Erosion on Eastern Cape communal lands exceeds 10 metric tons per hectare annually, stripping the topsoil and reducing the water-holding capacity. Pilot rehabilitation on 18,000 hectares shows promise but needs sustained extension support and subsidized inputs to scale.
Limited Access to Affordable Finance for Smallholders
The Land Bank’s loan book decreased from ZAR 48 billion (USD 2.6 billion) in 2021 to ZAR 29 billion (USD 1.6 billion) by 2024, resulting in a funding gap for smallholders[3]Source: Land Bank, “Annual Financial Statements 2024,” landbank.co.za. Commercial banks demand collateral and audited accounts, criteria that exclude three-quarters of applicants. Agricultural loan rates averaged 11.5% to 13.5% in 2025, which was between 2 and 4 percentage points above the prime rate, reflecting weather-related credit risk. Concessional vehicles, such as the Industrial Development Corporation’s agro-processing fund, disbursed ZAR 1.8 billion (USD 97 million) between 2023 and 2025. Demand outstripped supply threefold. Microfinance caps of ZAR 50,000 (USD 3,700) are inadequate for machinery or irrigation pivots, limiting technology diffusion.
*Our forecasts treat driver/restraint impacts as directional, not additive. The impact forecasts reflect baseline growth, mix effects, and variable interactions.
Segment Analysis
By Commodity Type: Cereals Anchor, Horticulture Accelerates
Cereals and grains maintained dominance with 46% of South Africa agriculture market share in 2025, supported by maize that leveraged favorable rainfall and drought-tolerant hybrids. Sorghum and barley remain niche, but feed the growing craft-beer industry. The climatic reliability of the maize belt underpins domestic food security while generating surpluses for Southern African Customs Union neighbors, stabilizing regional grain prices. Precision planters and variable-rate fertilizer systems on large grain estates further embedded economic yield growth without acreage expansion, a trend that keeps cereals critical to the South Africa agriculture market.
Vegetables, projecting a 6.9% CAGR through 2031, exploit international appetite for vitamin-rich produce and extend South Africa agriculture market size in higher-margin categories. Limpopo, Mpumalanga, and Western Cape estates added 12,500 hectares of citrus, avocado, and blueberry orchards between 2023 and 2025. Controlled-atmosphere cold storage now prolongs shelf life by up to 14 days, enabling containerized exports to East Asia without requiring layovers in ripening rooms. Pulses and oilseeds are reducing protein-meal imports and improving feed-processing margins. Cash crops are primarily driven by sugarcane, with cane-based cogeneration contributing baseload renewable electricity through utility power-purchase agreements. Tobacco acreage has declined due to stricter health regulations, although small areas in Limpopo continue to produce specialty grades for premium cigar leaf.


Geography Analysis
The South Africa agriculture market spreads across diverse agro-climatic zones that dictate regional specialization. The Free State, North West, and Mpumalanga maize triangle contributed significantly to the national grain output in 2025, benefiting from deep vertisol soils, mechanized operations, and silage infrastructure that reduce harvest losses. Farms embedded near rail sidings optimize bulk export flows to Richards Bay and Mozambique’s Maputo port, reducing inland logistics costs. Limpopo is the fastest-growing agricultural region in the country, with avocado plantations expanding by 4,200 hectares between 2023 and 2025, and citrus estates increasing by 3,800 hectares. This growth is supported by access to the Olifants River irrigation scheme and the region's proximity to the Port of Durban, which facilitates export logistics. The short distance to Durban harbor reduces transit time to Middle Eastern supermarkets, helping maintain pulp firmness within retailer specifications.
The Western Cape dominates the production of deciduous fruit, table grapes, and premium wine grapes, accounting for 72% of national apple and pear exports and 95% of wine production in 2025. Growers employ netting, drip irrigation, and predictive disease scouting to mitigate the effects of the Cape Doctor wind and shifts in Mediterranean drought. Peri-urban greenhouses surrounding Cape Town and Johannesburg have added 850 hectares of hydroponic lettuce and tomatoes since 2024, reducing reliance on Spanish winter glasshouse vegetables for imports.
KwaZulu-Natal diversifies beyond cane, replacing low-margin fields with macadamia orchards that fetched a USD 12 per kilogram kernel price in 2025. The province’s dual-purpose Noodsberg cogeneration plant now supplies 18 megawatts of bagasse-derived electricity to the national grid, enhancing mill economics. According to the Eastern Cape Rural Development Agency (ECRDA), the Eastern Cape faces challenges such as fragmented land tenure and soil erosion, resulting in maize yields that are 40% below the national average. However, the region's 3.2 million cattle present opportunities in the red meat market, provided veterinary services and feedlot capacities are expanded. Northern Cape growers exploit the Orange River’s regulated flow to irrigate 22,000 hectares of raisins and table grapes, exporting 65 million cartons to European and Asian buyers despite long overland routes to port.
Regulatory Landscape
South Africa's agricultural production and trade operate under a multi-agency framework led by the Department of Agriculture, Land Reform and Rural Development (DALRRD), with market oversight functions anchored by the National Agricultural Marketing Council (NAMC) under the Marketing of Agricultural Products Act (1996). Land-use protection has been tightened through the Preservation and Development of Agricultural Land Act 39 of 2024, which formalizes the evaluation and classification of agricultural land as a food-security safeguard and affects conversion approvals and longer-term farm investment decisions.
Product quality, grading, and export compliance requirements are governed by the Agricultural Product Standards Act 119 of 1990 and the Agricultural Product Standards Amendment Act 12 of 2023, while fertilizer, feed, and pesticide registrations and controls fall under the Fertilizers, Farm Feeds, Agricultural Remedies and Stock Remedies Act 36 of 1947. For plant-based exporters, DALRRD's Directorate of Food Safety and Quality Assurance administers Food Business Operator registration under Regulation 707 (13 May 2005), reinforcing traceability and phytosanitary readiness for horticulture-led export programs supported by the Agriculture and Agro-processing Master Plan (AAMP).
Value Chain Analysis
The value chain starts with input supply (seed, fertilizer, crop-protection chemicals, irrigation, and mechanization) and moves into on-farm production across grains, horticulture, and cash crops. Aggregation follows through cooperatives and traders, with storage in on-farm and commercial silos, and cold-chain intensive packing for export fruit. Grain cooperatives such as Senwes, VKB, and NWK remain central to physical infrastructure and distribution, while horticulture exporters including Westfalia Fruit, Capespan, and Dutoit integrate orchards, packhouses, and overseas marketing to capture margins from farm gate to destination retail.
Downstream pathways split between domestic milling and food manufacturing and export logistics routed through major ports and selected rail corridors. Port bottlenecks, notably at Cape Town and Durban, together with degraded rail infrastructure, increase demurrage and reduce reliability, raising costs for shippers. In parallel, more direct corporate sourcing and localized supply models are expanding: Shoprite and Botselo Mills scaled maize product supply into more than 1,176 Shoprite and Usave outlets, and Tiger Brands expanded smallholder-linked tomato supply through its Hulisani programme to feed its Boksburg manufacturing facility. Investment that strengthens farm-to-processing linkages is also moving forward, including Soufflet Malt's R2 billion Midvaal malting facility, designed for 100,000 tons per year with 100% local barley sourcing.
Competitive Landscape
South Africa's agriculture market is shaped by the presence of cooperatives, multinational subsidiaries, and vertically integrated exporters. Grain cooperatives such as Senwes, VKB, and NWK collectively control 55% of on-farm silo capacity and 40% of fertilizer distribution. This dominance enables them to secure preferential freight rates and pool procurement, effectively reducing input costs. The February 2023 merger between VKB and GWK created a ZAR 18 billion (USD 970 million) entity operating across Free State, North West, and Northern Cape, highlighting ongoing consolidation efforts to achieve economies of scale. Export-focused companies like Westfalia Fruit, Capespan, and Dutoit integrate operations across orchards, packhouses, and overseas subsidiaries, enabling them to capture value throughout the supply chain, from farm gate to retail.
Technology is a discriminator. ZZ2’s internet-of-things greenhouse-control system optimized climate variables and increased tomato yields by 9% while reducing water use by 14% in 2025. Blockchain pilots led by the Lona Group, in collaboration with the University of Pretoria, record citrus harvest data, packhouse handling, and reefer temperatures on a distributed ledger, thereby reducing customs disputes and expediting border inspections. Agri-fintech startups embed invoice discounting and weather-indexed insurance within produce-procurement apps, widening smallholder liquidity and hedging rainfall risk. Regenerative-agriculture specialists monetize soil-carbon credits, selling offsets to retailers that pledge net-zero supply chains.
Value-added niches remain underdeveloped. Pulses, oilseed meals, and indigenous botanicals such as rooibos tea still register less than 5% of global share despite favorable agro-ecology and protected designation of origin status. Proposed investments in extruders, solvent-extraction plants, and herbal-tea processing could diversify export baskets and stabilize farm revenues against commodity cycles. Competitive intensity will likely increase as private-equity ownership grows, fostering managerial discipline and capital access but also heightening pressure on small growers to keep pace with certifications and traceability requirements.
Market Opportunities and Future Outlook
Value-add and market-access opportunities are most visible where policy funding, blended finance, and corporate offtake align with exportable horticulture and domestic staples. The government's blended finance platform has approved ZAR 9.8 billion for 627 black commercial producers in partnership with the IDC, Land Bank, and ABSA, while the 2026/27 Department of Agriculture budget of R7.84 billion includes R3.28 billion for food security and farmer support. This mix creates space for packaged input-credit bundles, extension-linked mechanization services, and irrigation upgrades that can raise farm-gate volumes and quality.
Technology-enabled services and new processing demand are also gaining traction as pull factors. The Department of Science, Technology and Innovation initiated the SASSAM pilot in the Eastern Cape, deploying digital and climate-smart tools across 50 farms, and Limpopo's Department of Agriculture launched AGIS drone services to modernize planning and field support, broadening demand for mapping, pest scouting, and variable-rate applications. On the demand side, UPL's announced R17 billion bioethanol facility investment using maize and sugarcane as feedstock, alongside provincial efforts to expand packhouse capacity (including Limpopo's Moradu Citrus Farm Packhouse inspection tied to post-harvest infrastructure), is creating additional outlets that can absorb primary production while strengthening compliance and traceability for growers supplying formal processors and export channels.
Recent Industry Developments
- June 2026: FirstRand secured a R1.7 billion ($103 million) investment from the International Finance Corporation through FLAC bonds to expand financing for agricultural micro, small, and medium enterprises. The additional risk-absorbing capital supports larger and longer-tenor lending capacity, addressing a persistent constraint on working capital and on-farm modernization.
- June 2026: Bayer and Khula launched a R7.5 million Farmer Accelerator to prepare 50 emerging farmers for production finance and formal market access over 12 months. The program links agronomy support with funding readiness, strengthening the pipeline of bankable growers feeding structured retail and processor supply chains.
- March 2024: Vergelegen Wine Estate partnered with SkyBugs to run drone-delivered biological pest control trials targeting mealybugs and grape leafroll disease using predatory insects. The initiative advances integrated pest management adoption by demonstrating an alternative to chemical treatments and supporting compliance with tightening stewardship and residue expectations in high-value horticulture.


Research Methodology Framework and Report Scope
Market Definition and Coverage
For this study, the market means the farm-gate value created from agricultural production in South Africa. It covers food and industrial crops, horticulture (open-field and protected), and livestock sales at the first point of sale.
Scope exclusions: This sizing does not include downstream agro-processing, forestry, aquaculture, fisheries, or commercial timber plantations.
Segmentation Overview
- By Commodity Type
- Grains and Cereals
- Production Analysis (Volume)
- Overview
- Area Harvested and Yield
- Consumption Analysis (Value and Volume)
- Trade Analysis (Value and Volume)
- Import Market Analysis
- Overview
- Key Supplying Markets
- Export Market Analysis
- Overview
- Key Destinations Markets
- Import Market Analysis
- Wholesale Price Trend Analysis and Forecast
- Seasonality Analysis
- Production Analysis (Volume)
- Pulses and Oilseeds
- Production Analysis (Volume)
- Overview
- Area Harvested and Yield
- Consumption Analysis (Value and Volume)
- Trade Analysis (Value and Volume)
- Import Market Analysis
- Overview
- Key Supplying Markets
- Export Market Analysis
- Overview
- Key Destinations Markets
- Import Market Analysis
- Wholesale Price Trend Analysis and Forecast
- Seasonality Analysis
- Production Analysis (Volume)
- Fruits
- Production Analysis (Volume)
- Overview
- Area Harvested and Yield
- Consumption Analysis (Value and Volume)
- Trade Analysis (Value and Volume)
- Import Market Analysis
- Overview
- Key Supplying Markets
- Export Market Analysis
- Overview
- Key Destinations Markets
- Import Market Analysis
- Wholesale Price Trend Analysis and Forecast
- Seasonality Analysis
- Production Analysis (Volume)
- Vegetables
- Production Analysis (Volume)
- Overview
- Area Harvested and Yield
- Consumption Analysis (Value and Volume)
- Trade Analysis (Value and Volume)
- Import Market Analysis
- Overview
- Key Supplying Markets
- Export Market Analysis
- Overview
- Key Destinations Markets
- Import Market Analysis
- Wholesale Price Trend Analysis and Forecast
- Seasonality Analysis
- Production Analysis (Volume)
- Cash Crops
- Production Analysis (Volume)
- Overview
- Area Harvested and Yield
- Consumption Analysis (Value and Volume)
- Trade Analysis (Value and Volume)
- Import Market Analysis
- Overview
- Key Supplying Markets
- Export Market Analysis
- Overview
- Key Destinations Markets
- Import Market Analysis
- Wholesale Price Trend Analysis and Forecast
- Seasonality Analysis
- Production Analysis (Volume)
- Grains and Cereals
Data Sources, Market Sizing, and Validation
Desk Research
Desk research helped set the base structure of the model and align it with official production realities in South Africa. We mainly used public datasets that show planted area, yields, and output volumes across major crops, and then checked how the output moves through trade and local use.
Typical inputs came from sources such as Statistics South Africa and Department of Agriculture, Land Reform and Rural Development publications, customs and tariff line trade data from SARS, FAOSTAT production series, and peer-reviewed agronomy and climate literature. We also reviewed company annual reports, investor presentations, and credible agriculture press to understand farm-gate price movements and changes in input intensity. For cross-checking, we selectively used paid subscriptions for company financials and intelligence, patent databases, and shipment-level import and export signals where it mattered. These examples are not exhaustive, and many other public and paid sources were also used to collect data, validate assumptions, and clarify open questions.
Primary Interviews and Surveys
Primary work focused on validating the farm-gate scope, selecting the right farm-gate price series, and mapping how production changes convert into revenue changes across crops and livestock. We spoke with a mix of producers, traders, input distributors, and advisors across key producing provinces, then pressure-tested assumptions on yield variability, export pull, and price pass-through before finalizing the model.
Distribution of primary research fieldwork respondents
| Company type | Respondent position | Region |
|---|---|---|
| Top tier: 31% | CXOs: 17% | |
| Mid tier: 50% | Functional/Unit leaders: 29% | |
| Smaller Players: 19% | Managers: 54% |
Market-Sizing & Forecasting
The core sizing uses a top-down build from production and farm-gate price series. Crop and livestock volumes are translated into value using weighted average realized prices, then summed to a national total. To keep the totals realistic, we corroborated the result with selective bottom-up checks, such as sampled commodity volumes multiplied by observed farm-gate price bands, and then we used channel checks with traders and buyers to adjust for leakage and informal movements.
Key model inputs included planted area and harvested volumes for major field crops, average yields and year-to-year weather variability, livestock herd and slaughter indicators, exportable surplus signals versus domestic absorption, and farm-gate price progression, including currency timing when prices are export-linked. When data gaps showed up, we used conservative interpolation across adjacent years and verified the direction with expert feedback, rather than forcing a detailed supplier roll-up.
For forecasting, we leaned on scenario analysis because rainfall patterns, input costs, and export demand can shift the market sharply from one season to the next. The scenarios were anchored to consensus ranges shared by interviewees on yield recovery, planting intentions, and price expectations, then translated into a single central forecast for publication.
Data Validation & Update Cycle
Validation was done through multiple checks so that the model stays tied to real-world signals. Our team compared calculated values against independent indicators such as production bulletins, trade trends for key commodities, and implied value consistency versus agriculture-related macro series, and then investigated large variances before sign-off.
A second analyst review was completed to test assumptions, calculation logic, and sensitivity to key variables such as yields and farm-gate prices. Reports are refreshed annually, and interim updates are triggered when material events occur, such as a major drought cycle, policy shifts affecting exports, or sharp input price shocks. Right before delivery, we do a final pass to ensure the latest publicly released data and any confirmed market changes are reflected.
Mordor Intelligence's South Africa Agriculture Market Size Compared Against Other Published Estimates
Different sources often show different market sizes for South Africa agriculture because they do not always measure the same thing, and they also do not use the same price timing. Differences usually come from whether values are captured at farm gate or later in the value chain, and whether forestry and fisheries are counted inside the total.
In this market, the biggest gap drivers are scope choices and how exports are treated in pricing. Some published figures fold in agro-processing revenue, forestry, and aquaculture, which lifts totals beyond on-farm first-sale value, and some rely on GDP value-added series that are not the same as farm-gate sales. The spread is also affected by how drought-year volumes are smoothed and whether currency conversion is done using annual averages or spot timing, a discipline applied in the market model by Mordor Intelligence.
Benchmark comparison
| Source | Market Size | Gaps in Research Methodology |
|---|---|---|
| Mordor Intelligence | USD 15.40 B (2025) | |
| Regional Consultancy A | USD 17.30 B (2024) | The estimate appears to use a wider definition that can include adjacent activities like aquaculture, forestry, and downstream channels, which makes it less comparable to a farm-gate first-sale scope. |
| Trade Journal B | USD 11.69 B (2024) | This figure aligns with an agriculture, forestry, and fishing value-added series in current USD, which nets out intermediate inputs and reflects GDP accounting rather than farm-gate sales value. |
The table shows that the range mainly comes from mixing farm-gate sales with either value-added accounting or broader value-chain coverage. By keeping the market tied to production volumes and realized farm-gate pricing, and then checking it against trade and output signals, the final total stays traceable to clear inputs and repeatable steps.


Key Questions Answered in the Report
What is the estimated value of the South Africa agriculture market in 2026?
It is USD 16.3 billion with a trajectory to reach USD 21.6 billion by 2031.
Which commodity held the largest share in 2025?
Cereals and grains led with 46% of South Africa agriculture market share.
Which segment is projected to grow fastest through 2031?
Vegetables are forecast to post a 6.9% CAGR, outpacing other commodities.
How will AGOA expiry affect exporters?
A lapse could impose tariffs of 5% to 15% on shipments worth USD 1.1 billion, eroding citrus and wine margins.
Which province is the fastest-growing horticulture hub?
Limpopo records the quickest expansion, adding more than 8,000 hectares of citrus and avocado orchards since 2023.
What role do carbon credits play for farmers?
Verified regenerative practices generated USD 3.2 million in carbon-credit revenue in 2025, bolstering income diversification.
Page last updated on:


