
Agriculture CRO Services Market Size and Share
Market Overview
| Study Period | 2021 - 2031 |
|---|---|
| Market Size (2026) | USD 12.47 Billion |
| Market Size (2031) | USD 21.34 Billion |
| Growth Rate (2026 - 2031) | 11.33 % |
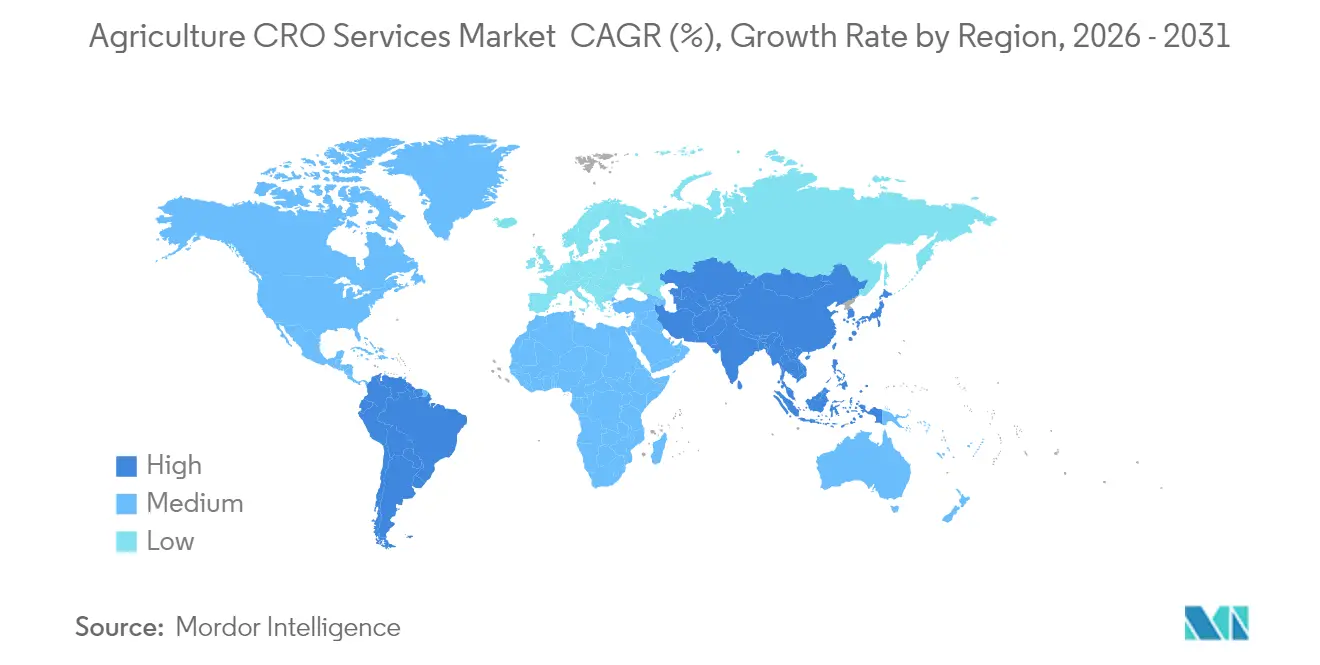
| Fastest Growing Market | Asia Pacific |
| Largest Market | North America |
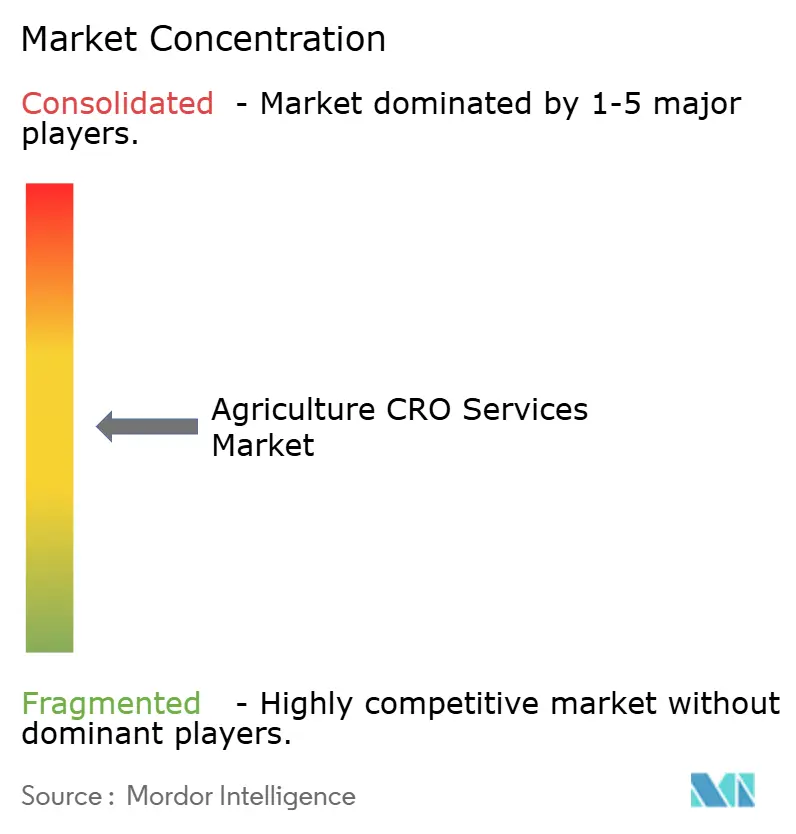
| Market Concentration | Medium |
Major Players *Disclaimer: Major Players sorted in no particular order Image © Mordor Intelligence. Reuse requires attribution under CC BY 4.0. | |
Agriculture CRO Services Market Analysis by Mordor Intelligence
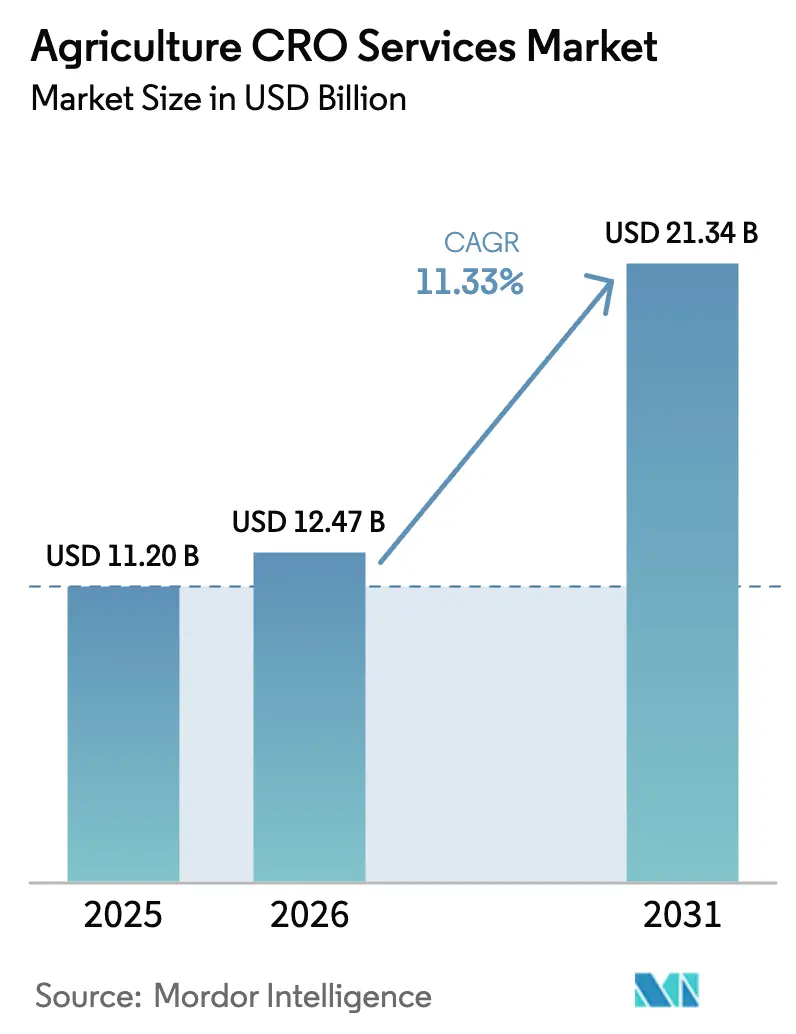
The Agriculture CRO Services market size was valued at USD 11.20 billion in 2025 and estimated to grow from USD 12.47 billion in 2026 to reach USD 21.34 billion by 2031, at a CAGR of 11.33% during the forecast period (2026-2031). This growth is driven by agrochemical manufacturers increasingly outsourcing their research and development operations, as the cost of discovering a single active ingredient now exceeds USD 300 million, making in-house research financially challenging[1]. The implementation of complex regulatory requirements, including the United States Environmental Protection Agency's 2024 biotechnology coordination framework requiring multi-agency data submissions, has increased the demand for specialized compliance services[2]. North America holds the largest market share due to its strict registration requirements, while the Asia-Pacific region shows the highest growth rate, driven by agricultural modernization and expanding export markets. The regulatory services segment demonstrates the strongest growth, as biologicals and gene-edited crops require comprehensive documentation and specialized expertise. The market remains fragmented, with the top five providers accounting for a minority of total revenue. This structure creates opportunities for regional specialists to develop expertise in emerging areas such as carbon credit verification and precision agriculture validation.
Key Report Takeaways
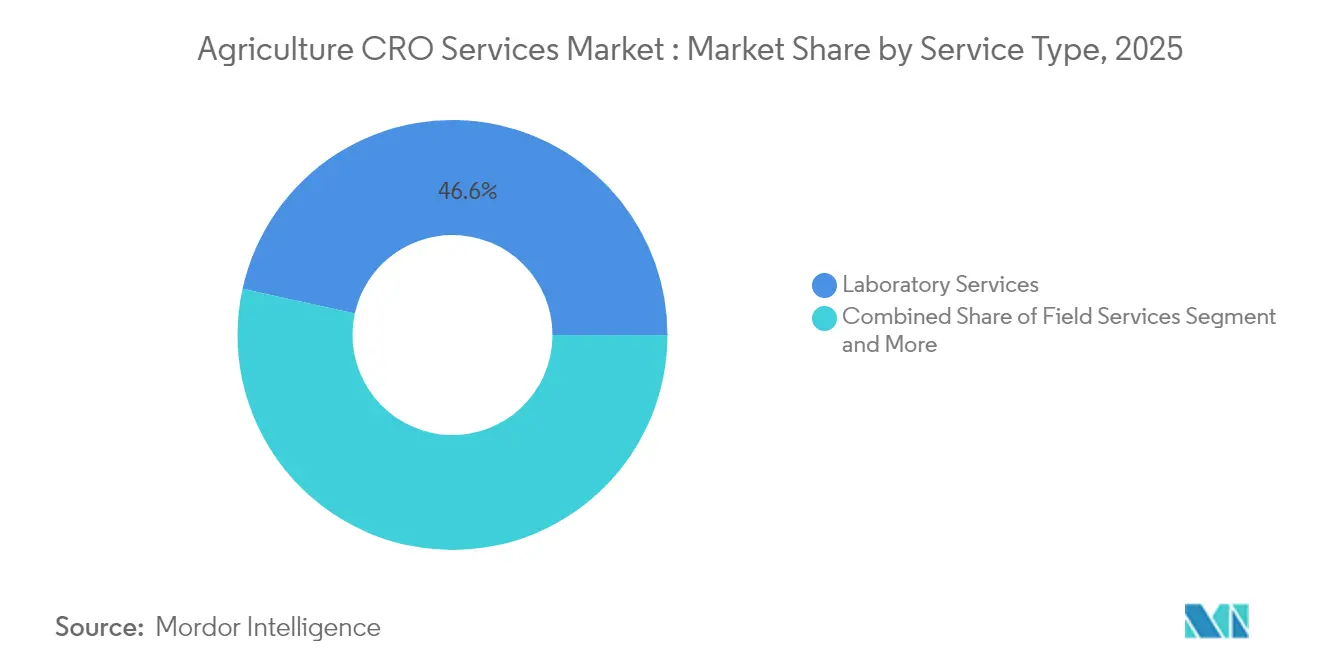
- By service type, laboratory services led with 46.55% of the agriculture CRO services market share in 2025, while regulatory services are projected to register a 12.64% CAGR through 2031.
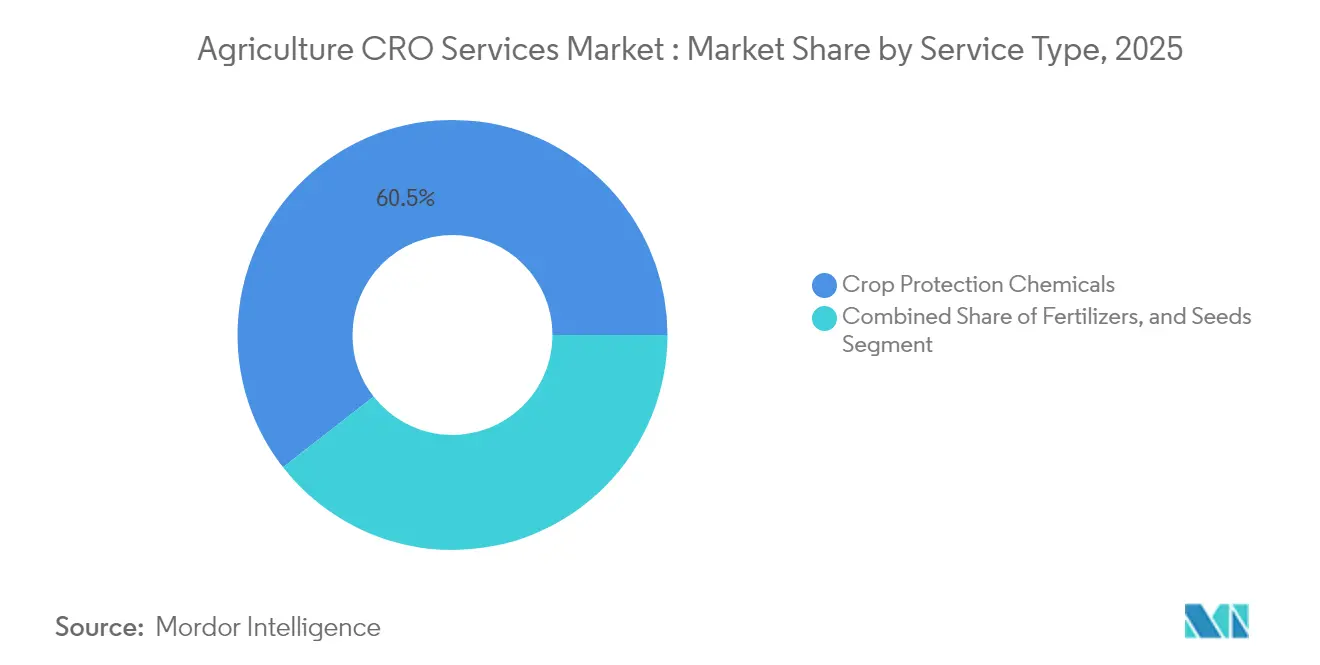
- By sector, crop protection chemicals accounted for 60.55% of the agriculture CRO services market size in 2025 and are projected to expand at a 12.36% CAGR through 2031.
- By geography, North America held a 54.10% revenue share in 2025, while the Asia-Pacific region is forecast to deliver the highest regional CAGR of 12.11% through 2031.
- Eurofins Scientific SE, SGS SA, Charles River Laboratories International Inc., ERM International Group Limited, and Exponent Inc. hold a significant market share in 2024.
Note: Market size and forecast figures in this report are generated using Mordor Intelligence’s proprietary estimation framework, updated with the latest available data and insights as of 2026.
Market Trends and Insights
Drivers Impact Analysis of Agriculture CRO Services Market *
| Driver | (~) % Impact on CAGR Forecast | Geographic Relevance | Impact Timeline |
|---|---|---|---|
| Rising research and development outsourcing to contain soaring discovery costs | +2.2% | Global, concentrated in North America and Europe | Medium term (2-4 years) |
| Regulatory tightening drives demand for third-party compliance expertise | +2.0% | Global, peak in North America and European Union | Short term (≤ 2 years) |
| Growth in biologicals and biosolutions requiring new efficacy trials | +1.9% | Global, led by South America and Asia-Pacific | Medium term (2-4 years) |
| Precision agriculture and digital farming tools need validation studies | +1.5% | North America and Europe, expanding to Asia-Pacific | Long term (≥ 4 years) |
| Shift to data-driven portfolio optimization by agrochemical majors | +1.4% | Global, concentrated in developed markets | Medium term (2-4 years) |
| Venture funding surge for ag-tech start-ups lacking in-house trial capacity | +1.1% | North America and Europe, emerging in Asia-Pacific | Short term (≤ 2 years) |
| Source: Mordor Intelligence | |||
Rising Research and Development Outsourcing to Contain Soaring Discovery Costs
Rising discovery costs are driving agrochemical companies to outsource non-core scientific activities. Bayer's 2024 filings demonstrate this trend, as the Crop Science division faces challenges despite the group's total research expenditure of EUR 5,860 million (USD 6,446 million). Contract Research Organization (CRO) partnerships reduce time-to-market by up to two years, enhancing returns on research investment. Companies depend on external partners for specialized services such as advanced toxicology, multi-site field trials, and predictive modeling, avoiding substantial internal infrastructure costs. Global competition emphasizes the importance of efficient capital allocation, supporting continued outsourcing growth. These dynamics increase the demand for agricultural CRO services, ranging from initial discovery screening to regulatory submission.
Regulatory Tightening Drives Demand for Third-Party Compliance Expertise
The Environmental Protection Agency's 2024 framework requires applicants to incorporate data requirements from the Environmental Protection Agency, the Food and Drug Administration, and the United States Department of Agriculture, thereby increasing dossier complexity and compliance costs. International regulatory changes include Argentina's National Service of Agri-Food Health and Quality (SENASA) Resolution 1081/2024, which updated testing protocols while maintaining strict technical requirements[3]. Companies work with specialized CRO regulatory teams to comply with regulations on formulations, microbials, and gene-edited seeds. The selection of CRO partners now depends heavily on their expertise in Good Laboratory Practice, dossier harmonization, and multi-jurisdiction submissions. As a result, regulatory consulting has become the fastest-growing service segment in the agriculture CRO services market.
Growth in Biologicals and Biosolutions Requiring New Efficacy Trials
Biological products generated USD 827 million in Brazil during the 2022-2023 season, demonstrating increased adoption across South American fruit and specialty crop systems. The evaluation of biological products requires specialized trial designs that assess beneficial insect compatibility, soil microbiome impacts, and product persistence throughout the growing season. Regulatory agencies require comparative studies between biological products and conventional synthetic pesticides, which increases trial complexity. Contract Research Organizations (CROs) with microbial testing laboratories and bioassay capabilities are well-positioned to conduct these studies. The agriculture CRO services market is expanding due to broader trial requirements that evaluate integrated pest management approaches combining chemical and biological solutions.
Shift to Data-Driven Portfolio Optimization by Agrochemical Majors
Agrochemical companies optimize their product pipelines by selecting molecules that offer the best risk-adjusted returns. This approach necessitates extensive screening, toxicology assessment, and data analytics that exceed internal capabilities. Contract Research Organizations (CROs) provide cloud platforms, statistical analysis, and decision frameworks to facilitate go-no-go decisions. Organizations benefit from external expertise and operational flexibility without fixed cost commitments, establishing sustained partnerships throughout the drug development process.
Restraints Impact Analysis of Agriculture CRO Services Market *
| Restraint | (~) % Impact on CAGR Forecast | Geographic Relevance | Impact Timeline |
|---|---|---|---|
| Shortage of good laboratory practice qualified field sites in key geographies | -0.9% | Global, acute in Asia-Pacific and South America | Medium term (2-4 years) |
| Privacy and cyber-security breaches undermining sponsor confidence | -0.7% | Global, concentrated in digitally advanced markets | Short term (≤ 2 years) |
| Rising cost of liability insurance for field-testing live plots | -0.6% | North America and Europe, spreading globally | Medium term (2-4 years) |
| Weather-related trial failures increasing project risk and cost | -0.5% | Global, intensifying in climate-vulnerable regions | Long term (≥ 4 years) |
| Source: Mordor Intelligence | |||
Shortage of Good Laboratory Practice Qualified Field Sites in Key Geographies
The demand for compliant test plots exceeds supply, creating waiting periods for sponsors seeking access to limited testing capacity. Obtaining certifications from organizations such as International Accreditation New Zealand (IANZ) or Australia's National Association of Testing Authorities (NATA) requires a three-year process and substantial investments in data systems, analytical equipment, and personnel training[4]. The restricted availability of certified facilities extends project timelines and increases costs for multi-location trials, constraining the agriculture CRO services market. Biological research faces additional challenges due to requirements for containment facilities and microbial monitoring capabilities, which are absent in most field stations.
Privacy and Cyber-Security Breaches Undermining Sponsor Confidence
CROs manage sensitive data, including genetic sequences, formulation details, and strategic documents with significant commercial value. Recent cybersecurity incidents in the life sciences industry have raised concerns among sponsors about data protection by external partners. To address these concerns, CROs must implement robust security measures such as data encryption, zero-trust security frameworks, and thorough employee screening processes. These security requirements increase operational costs, creating financial challenges for smaller CROs and potentially reducing the number of service providers in the agriculture CRO services market.
*Our forecasts treat driver/restraint impacts as directional, not additive. The impact forecasts reflect baseline growth, mix effects, and variable interactions.
Agriculture CRO Services Market Segment Analysis
By Service Type:
Laboratory Services Dominate and Regulatory Services AccelerateLaboratory testing held 46.55% of the agriculture CRO services market share in 2025, driven by its essential functions in residue analytics, environmental fate modeling, and efficacy confirmation. Sponsors utilize chromatography, mass spectrometry, and molecular diagnostics to meet registration requirements. Eurofins Scientific increased its laboratory capacity by 98,000 square meters in 2024 to address higher throughput demands, despite experiencing a 10% decline in agrosciences revenue due to temporary client budget constraints. The integration of digital informatics and automated sample processing has become standard practice, reducing data processing time and enhancing the operational efficiency of global providers. The concentration of analytical infrastructure reinforces this segment's dominant position in the agriculture CRO services market.
Regulatory consulting services are projected to grow at a 12.64% CAGR through 2031, driven by increasing dossier complexity. The development of biologicals and gene-edited crops requires comprehensive submissions addressing mode of action, microbiome effects, and socio-economic risks. CROs with diverse teams encompassing toxicology, environmental sciences, and legal policy expertise are securing more contracts. SGS's Farm Sustainability Assessment program demonstrates this service integration by combining laboratory analysis with compliance verification and certification audits. Regional specialists maintain strong relationships with local regulators, indicating that expertise remains competitive with scale advantages in this expanding segment of the agriculture CRO services market.

By Sector:
Crop Protection Chemicals Lead with Biologicals ConvergenceCrop protection chemicals account for 60.55% of the agriculture CRO services market size in 2025, driven by stewardship requirements and ongoing discovery of resistance-breaking active ingredients. The segment maintains a 12.36% CAGR through 2031 as manufacturers validate integrated pest management protocols that combine chemical and biological controls. Field trials now focus on evaluating interactions between new active ingredients and microbial inoculants across multiple treatment types and locations. Major CROs, including Eurofins, Charles River Laboratories, and SynTech Research, have expanded their phytotoxicity, residue, and ecotoxicology testing capabilities to address these requirements.
The fertilizer and seed segments show strong growth due to advances in sustainability and trait development. New nutrient formulations, such as those from ICL Group Custom Ag Formulators, require extensive testing for compatibility across soil types and irrigation systems. Seed companies using CRISPR (Clustered Regularly Interspaced Short Palindromic Repeats) technology rely on genotype verification, phenotype evaluation, and environmental interaction studies, frequently conducted by specialized biotechnology CROs. These developments highlight how the agriculture CRO services market increasingly combines chemistry, biology, and genomics expertise in comprehensive testing programs, driving demand across all market segments.
Geography Analysis
North America Agriculture CRO Services Market
North America holds 54.10% of the agriculture CRO services market share in 2025. The region's strength stems from the Environmental Protection Agency's multi-agency biotech framework, United States Department of Agriculture innovation grants, and precision farming implementation across millions of hectares. Canada's regulatory alignment and Mexico's planned glyphosate transition expand the diversity of research projects. The collaboration between Corteva and John Deere for digital agriculture validation strengthens CRO bookings, while carbon sequestration measurement under farm bill incentives creates additional revenue opportunities in sustainability verification.
APAC Agriculture CRO Services Market
Asia-Pacific demonstrates the highest growth rate at 12.11% CAGR. The region's expansion is supported by China's biotechnology regulation updates and India's export compliance requirements. Government modernization initiatives and increased venture funding facilitate early-stage biological testing. While accreditation challenges remain, the implementation of regional Good Laboratory Practices frameworks and drought resilience initiatives, including Australia's USD 40.3 million program, is reducing capacity limitations. The widespread adoption of sensor-based agronomy solutions in Southeast Asia increases the demand for third-party validation services.
Europe and South America Agriculture CRO Services Market
Europe and South America exhibit different but complementary growth trajectories. European growth is driven by the Green Deal and Farm to Fork initiatives, generating demand for biological efficacy testing, carbon footprint verification, and circular nutrient research. South America excels in biological crop protection, with Brazil's biologicals market requiring specialized trials comparing microbial products to chemical alternatives. Argentina's relaxed laboratory selection policies attract international CROs while maintaining rigorous data requirements, demonstrating the market's regulatory evolution.
Regulatory Landscape
Agriculture CRO service demand is shaped by tightening and evolving registration and compliance regimes for pesticides, seeds, fertilizers, and sustainability claims. In the United States, the Environmental Protection Agency (EPA) and related federal agencies have maintained a complex, multi-agency data expectation for biotechnology dossiers. This increases the need for third-party GLP studies and submission support.
In Europe, official control requirements continue to formalize laboratory methods and data expectations. Commission Implementing Regulation (EU) 2026/765, effective 1 April 2026 and applying from 1 January 2027, updates methods for official sampling and analysis of pesticide residues in food and feed. It reinforces the importance of standardized residue analytics and defensible chain-of-custody. In parallel, fertilizer and soil-health regulation is being refit to new conformity assessment structures in some markets, changing how product claims are substantiated and audited. The UK has been developing the UK Fertilising Product Regulations (UK FPR) to replace legacy fertilisers legislation with a conformity-assessment-based system. This raises the role of third-party testing, documentation, and audit-ready quality systems for suppliers selling into the UK. Together, these changes keep regulatory services central within the agriculture CRO services market as sponsors manage multi-jurisdiction registrations and expand into biologicals, microbial inputs, and claims that require structured datasets rather than single-trial evidence.
Competitive Landscape
The agriculture CRO services market demonstrates moderate concentration, with Eurofins Scientific SE, SGS SA, Charles River Laboratories International Inc., ERM International Group Limited, and Exponent Inc. holding a significant market share in 2024. Eurofins Scientific experienced a decline of more than 10% in Q3 2024 Agrosciences revenue, indicating market sensitivity to client spending patterns. SGS reported sales of CHF 6,794 million (USD 7,473 million) in 2024, strengthened by eleven acquisitions that enhanced its analytical capabilities and geographic presence. Charles River Laboratories utilizes its life sciences expertise through biotechnology assays and toxicology packages for seed and biological developers.
Strategic consolidation continues in the market. SynTech Research expanded its European field capacity, while LabAnalysis acquired Ibacon in July 2024 to enhance regulatory toxicology capabilities. Competitive positioning is influenced by technological integration as providers implement digital data capture, remote sensing, and automated analytics to reduce cycle times and improve accuracy. In the agriculture CRO services market, CROs with multi-country Good Laboratory Practice certification, integrated laboratory and regulatory services, and data-science-enhanced insights attract sponsors managing global launch campaigns.
Specialized service segments present growth opportunities. The biological testing segment remains underserved, with demand exceeding supply for microbial identification, fermentation analytics, and entomology bioassays. Precision agriculture validation, combining agronomy with data science, faces capacity constraints, leading to new entrants such as Crop.Zone to collaborate with equipment dealers for on-farm demonstrations. Carbon credit verification is rapidly expanding, with SustainCERT and Agreena securing early projects to certify soil carbon across millions of hectares. These specialized segments demonstrate how focused providers can establish strong positions against larger competitors, contributing to moderate industry concentration.
Agriculture CRO Services Industry Leaders
-
Eurofins Scientific SE
-
SGS SA
-
Charles River Laboratories International, Inc.
-
ERM International Group Limited
-
Exponent, Inc.
- *Disclaimer: Major Players sorted in no particular order
Agriculture CRO Services Market Companies Covered in this Report
- Eurofins Scientific SE
- SGS SA
- Charles River Laboratories International, Inc.
- Syntech Research Group, Inc.
- Knoell Germany GmbH
- ERM International Group Limited
- Exponent, Inc.
- Staphyt Group
- Anadiag Group SAS
- RIFCON GmbH
- Ibacon GmbH (Labanalysis Srl)
- Jai Research Foundation
- Smithers Group Inc.
- Laus GmbH
- Ag Metrics Group LLC
Market Opportunities and Future Outlook
Opportunities are concentrated where regulation, sustainability measurement, and technical specialization intersect, especially residue methods, soil and nutrient compliance, and biologicals. The EU update to official pesticide residue sampling and analysis methods under Implementing Regulation (EU) 2026/765 (effective 1 April 2026, applying from 1 January 2027) creates room for laboratories and data-management providers to deliver method-aligned testing, quality documentation, and multi-country comparability.
Capacity developments point to where clients are building demand. Eurofins actions in 2026 signal expansion around soil and seed testing needs, including the acquisition of CSR Laboratorio in Spain (April 2026) to expand soil, water, plant, and fertiliser analysis, and the launch of an expanded European seed testing service cluster across Italy, France, and the Netherlands (March 2026) to support phytosanitary and GSPP-compliant testing for seed trade and varietal movement. Field-trial and risk-assessment capacity expansion also highlights near-term service gaps, particularly in Central Europe and in GLP ecotoxicology for higher-tier assessments. SGS opened a GLP-certified field station in Ostrava, Czech Republic (July 2026), strengthening regional field testing coverage for crop protection and related agronomy work, while Eurofins Agroscience Services Brazil expanded environmental risk assessment to include GLP-accredited ecotoxicological studies for birds and mammals (July 2026), aligning with more demanding environmental datasets for registrations. As sponsors pursue faster, more standardized cross-border dossiers, providers that combine GLP field execution, advanced analytics, and regulatory submission support into integrated packages are better positioned for biologicals and seed systems where protocols and acceptance criteria vary by jurisdiction.
Recent Industry Developments in Agriculture CRO Services Market
- June 2026: Charles River Laboratories International, Inc. unveils expansion plans for a primate-breeding and research facility in Kampong Thom, Cambodia, backed by up to 500 million USD. The project integrates with local agricultural input suppliers to coordinate feed crop supply. The move expands regional CRO and agri input collaboration, extending on site capabilities and potentially accelerating regulatory and product development collaboration in agriculture CRO services.
- September 2025: Eurofins Scientific SE acquires the agroscience research division of Cawood Scientific, integrating ecotoxicology, residue analysis, and field studies into its portfolio. The expansion broadens agroscience testing capabilities and regulatory service depth. It enhances competitive position in agrochemical and biotech CRO services with expanded geographic and service coverage.
- February 2025: SGS SA is awarded a 38 month contract by the European Commission to conduct laboratory analyses on soil health across the European Union. The contract expands regulatory testing in soil health analytics. It strengthens SGS's footprint in EU soil quality verification and regulatory services.
Agriculture CRO Services Market Report Scope and Research Methodology
Market Definition and Coverage
This market covers third-party contract research and related support services that agriculture input companies use to design, run, and document R&D work for crop products, from planning through reporting.
Scope exclusions: Routine farming services and on-farm production activities are excluded when they are not delivered as contracted R&D or regulatory support.
Segments Covered in This Report
- By Service Type
- Field Services
- Laboratory Services
- Regulatory Services
- Other Services (Product Development Services, Precision Agriculture Services, Seed Services, etc.)
- By Sector
- Crop Protection Chemicals
- Fertilizers
- Seeds
- By Geography
- North America
- United States
- Canada
- Mexico
- Rest of North America
- Europe
- Germany
- United Kingdom
- France
- Spain
- Rest of Europe
- Asia-Pacific
- China
- India
- Japan
- Australia
- Rest of Asia-Pacific
- South America
- Brazil
- Argentina
- Chile
- Rest of South America
- Middle East
- Saudi Arabia
- United Arab Emirates
- Rest of Middle East
- Africa
- South Africa
- Kenya
- Rest of Africa
- North America
Data Sources, Market Sizing, and Validation
Desk Research
Desk work starts with building a clean view of demand signals that sit behind outsourced agriculture research. We mainly review public regulatory guidance and testing requirements, along with agriculture production and crop protection usage context, because these shape what types of trials and studies must be run.
Common inputs include sources such as FAO statistics, USDA publications, the US EPA pesticide and biotechnology coordination updates, the European Commission and EFSA regulatory pages, and OECD test guidelines for chemicals. We also review annual reports, investor decks, association websites, and credible press coverage to understand service mix shifts and outsourcing behavior. For company and patent context, we use paid subscriptions for company financial intelligence, news and financials, and patent databases, followed by import-export shipment level checks where relevant for lab material flows. The sources listed here are illustrative only, and additional public documents and references were used to collect, cross-check, and clarify data.
Primary Interviews and Surveys
Primary work is used to pressure-test what we saw in public sources and to convert it into usable modeling assumptions. We interview and survey CRO executives, lab and field operations leaders, regulatory affairs specialists, and procurement teams from agriculture input companies across major geographies, so pricing, capacity, and outsourcing shares can be validated with operating feedback. Where gaps remain (for example, typical study bundles or turnaround times), follow-up calls are done to align definitions and avoid mixing adjacent services into the market.
Distribution of primary research fieldwork respondents
| Company type | Respondent position | Region |
|---|---|---|
| Top tier: 33% | CXOs: 14% | APAC: 39% |
| Mid tier: 48% | Functional/Unit leaders: 31% | EMEA: 35% |
| Smaller Players: 19% | Managers: 55% | Americas: 26% |
Market-Sizing & Forecasting
The core model uses a top-down build where outsourced agriculture R&D demand is reconstructed from the required trial and study workload implied by regulatory pathways, crop protection and seed innovation activity, and regional registration intensity. Once the demand pool is set, it is converted into market value using service mix splits and typical pricing ranges for field trials, lab studies, and regulatory documentation support.
To keep totals realistic, results are checked using selective bottom-up approximations, such as sampled study volume times average selling prices, channel checks with labs and field networks, and sanity checks against reported R&D spending direction in agriculture inputs. Key inputs that move the model include the number and complexity of field trials, lab test throughput and utilization patterns, regulatory submission requirements by region, outsourcing penetration by service type, and observed price progression for multi-site studies. When direct datapoints are missing for smaller countries, we use proxy ratios tied to cropped area, intensity of high value crops, and known regulatory timelines, and then adjust using interview feedback.
For forecasting, scenario analysis is used alongside a simple multivariate regression, where demand growth is linked to R&D intensity, regulatory complexity, and innovation cadence in crop protection and seeds. Final growth rates are then aligned to what interviewees consider practical over the cycle, before the forecast is locked.
Data Validation & Update Cycle
Validation is done in layers so a single dataset does not drive the result. Model outputs are compared against independent signals, such as shifts in registration activity, lab and field capacity commentary, and changes in outsourcing behavior reported by participants, and then variances are investigated until the cause is understood.
Before sign-off, the work is reviewed across multiple analyst steps, including checks for unit consistency, currency conversion timing, and service boundary alignment. If a number looks out of pattern (for example, a sudden pricing jump or a region share swing), respondents are re-contacted and assumptions are recalibrated. Reports are refreshed annually, with interim updates when material events occur, and a final fresh pass is completed right before delivery so clients receive the latest view.
Mordor Intelligence's Agriculture Cro Services Market Sizing Compared With Other Published Estimates
It is normal to see different market sizes for agriculture CRO services because publishers do not always count the same services, years, or pricing basis. Differences also show up when one study starts from regulatory workload and another starts from company revenue claims, which can lead to gaps in what is included.
By tracking regulatory driven study demand and refreshing pricing assumptions through fieldwork, Mordor Intelligence keeps the estimate centered on outsourced R&D activities and avoids counting adjacent farm services or purely internal research costs. Some published numbers also use different base years, apply aggressive uptake for precision agriculture add-ons, or rely on currency conversions taken from a single point in time, which can widen the spread.
Benchmark comparison
| Source | Market Size | Gaps in Research Methodology |
|---|---|---|
| Mordor Intelligence | USD 11.20 B (2025) | |
| Industry Publisher A | USD 7.09 B (2024) | Uses an earlier base year and appears to apply a narrower service boundary that undercounts multi-year regulatory documentation and bundled lab work attached to field trials. |
| Industry Publisher B | USD 13.50 B (2024) | Seems to fold in a wider set of agritech and precision support services and may use higher assumed price escalation, which lifts the value beyond contract research and compliance-led scope. |
The comparison shows that the biggest drivers are year selection, what is treated as true contract research versus adjacent services, and how pricing is moved forward over time. Our approach stays traceable to clear demand indicators, service mix logic, and interview-tested assumptions, which makes the market total easier to repeat and explain.
Key Questions Answered in the Report
What is the projected value of the agriculture CRO services market by 2031?
The market is forecast to reach USD 21.34 billion by 2031, reflecting an 11.33% CAGR during 2026-2031.
Why is Asia-Pacific considered the fastest-growing region?
Agricultural modernization, export-oriented compliance needs, and rising biologicals adoption lift the region at a 12.11% CAGR through 2031.
What factors are driving increased demand for regulatory consulting services?
Complex multi-agency frameworks for biologicals, gene-edited crops, and evolving formulation rules require expert dossier preparation and regulatory strategy.
Which emerging niche offers growth opportunities beyond traditional field and laboratory studies?
Carbon credit verification and precision agriculture validation present promising high-margin opportunities as sustainability and data-driven farming expand.