
Market Overview
| Study Period | 2021 - 2031 |
|---|---|
| Forecast Data Period | 2026 - 2031 |
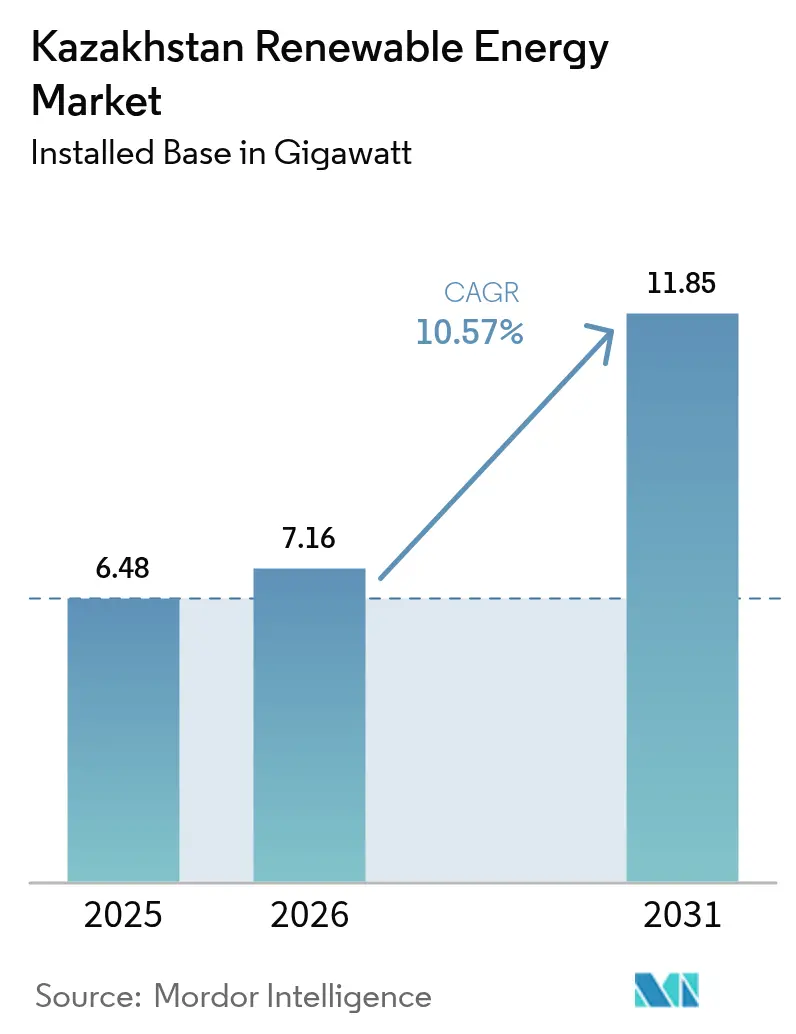
| Base Year Market Size (2025) | 6.48 gigawatt |
| Market Volume (2026) | 7.16 gigawatt |
| Market Volume (2031) | 11.85 gigawatt |
| Growth Rate (2026 - 2031) | 10.57 % |
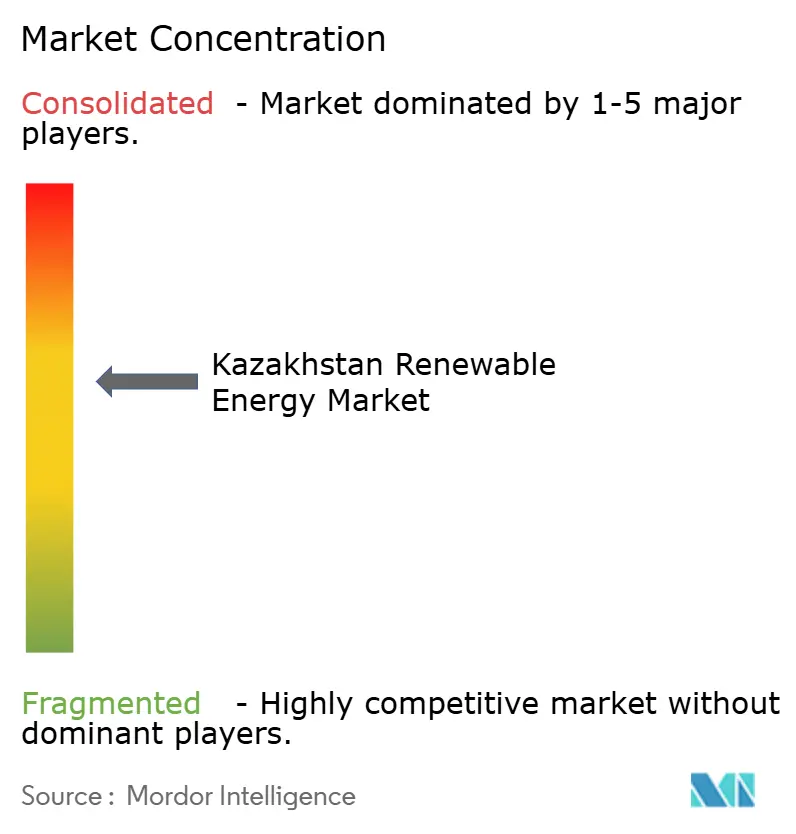
| Market Concentration | Medium |
Major Players *Disclaimer: Major Players sorted in no particular order Image © Mordor Intelligence. Reuse requires attribution under CC BY 4.0. | |
Kazakhstan Renewable Energy Market Analysis by Mordor Intelligence
The Kazakhstan Renewable Energy Market size is expected to grow from 6.48 gigawatt in 2025 to 7.16 gigawatt in 2026 and is forecast to reach 11.85 gigawatt by 2031 at 10.57% CAGR over 2026-2031.
Rising foreign direct investment, declining technology costs, and government targets that mandate a 12.5% share of renewables by 2029 are accelerating capacity additions. Large-scale auction reforms now require 30% storage integration, which has improved grid reliability prospects and enhanced the economics of hybrid projects. Utility-scale projects currently dominate deployment; however, rapid growth in residential rooftop installations signals a shift in consumption patterns and opens up new revenue streams for installers and service providers. Investor confidence remains strong, underscored by Masdar’s 1 GW wind project and a collective 2.6 GW of Chinese-backed capacity commitments, while state-owned Samruk-Energy continues to anchor domestic generation assets.
Key Report Takeaways
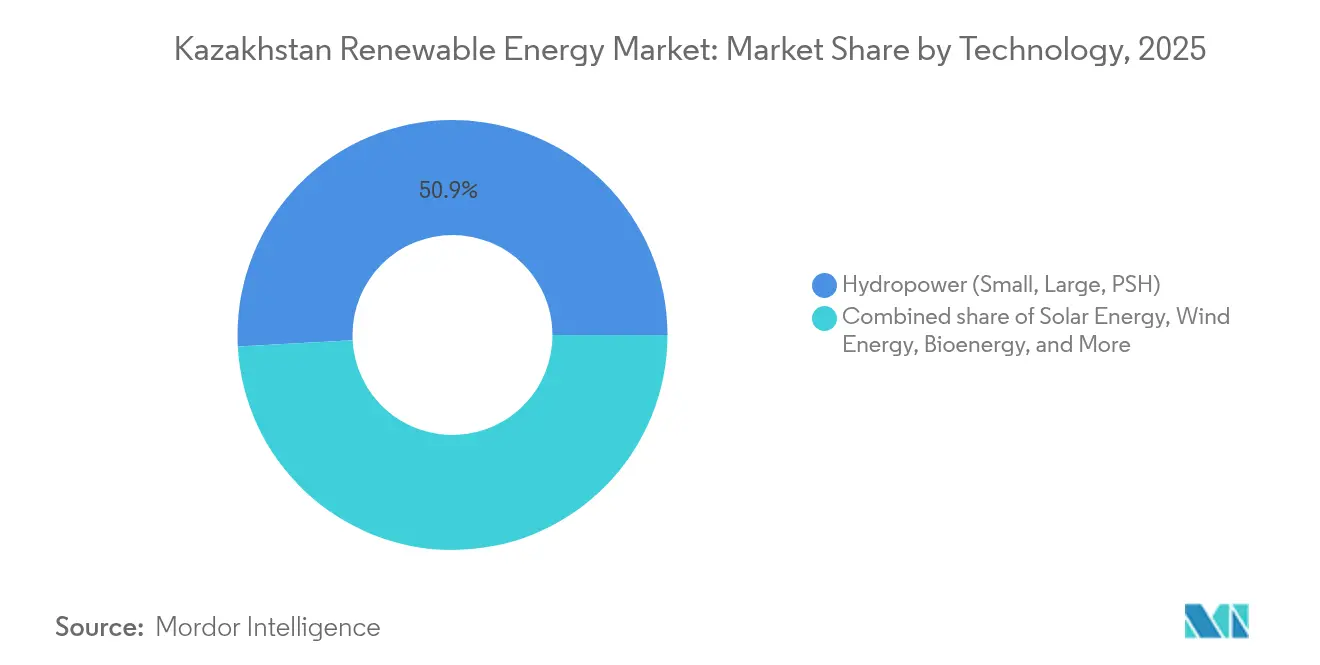
- By technology, hydropower led the Kazakhstan renewable energy market with 50.85% of the market share in 2025; bioenergy is forecast to advance at a 63.55% CAGR through 2031.
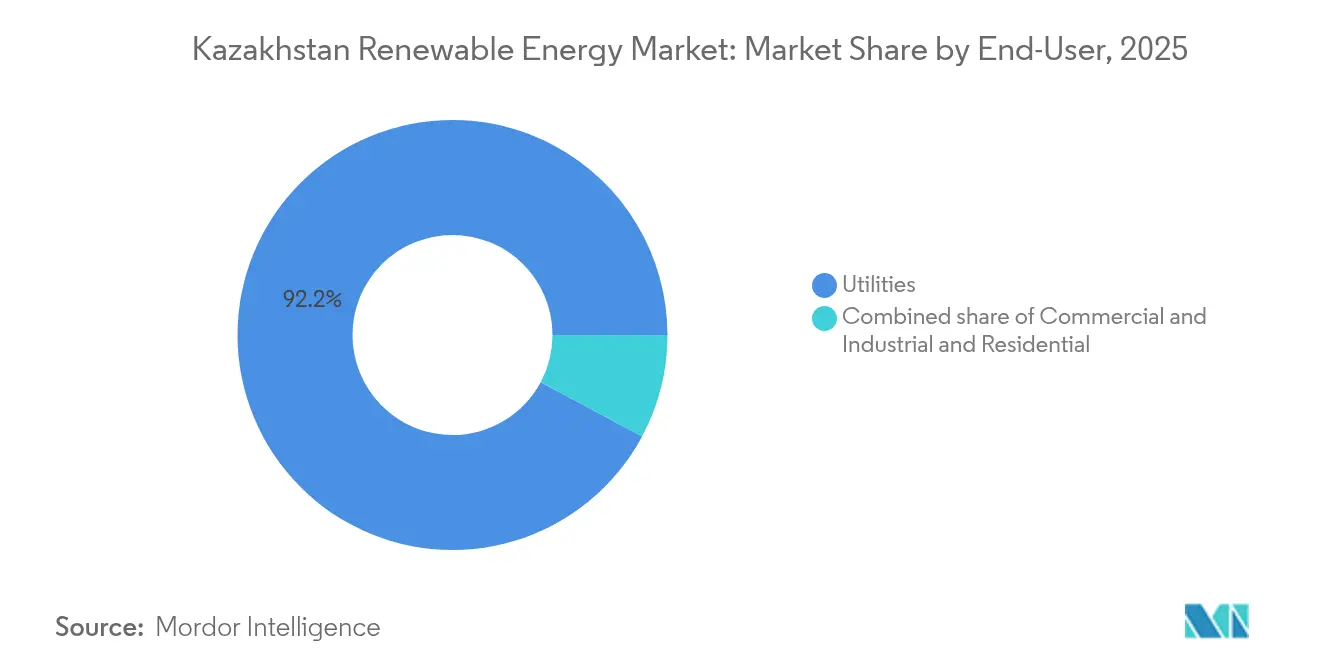
- By end-user, utilities commanded 92.18% revenue share of the Kazakhstan renewable energy market size in 2025, while the residential segment is projected to grow at a 16.1% CAGR to 2031.
- By geography, the Zhambyl region attracted over 3 GW of committed capacity and is expanding at a 13.89% CAGR, the fastest among all provinces.
- Samruk-Energy JSC, Masdar, and ACWA Power collectively accounted for nearly 30% of the installed capacity in 2024, shaping the competitive landscape.
Note: Market size and forecast figures in this report are generated using Mordor Intelligence’s proprietary estimation framework, updated with the latest available data and insights as of 2026.
Market Trends and Insights
Drivers Impact Analysis of Kazakhstan Renewable Energy Market*
| Driver | (~) % Impact on CAGR Forecast | Geographic Relevance | Impact Timeline |
|---|---|---|---|
| Large-scale foreign direct investment deals | +3.20% | Zhambyl, Zhetysu, Mangystau, and Turkestan | Medium term (2-4 years) |
| Auction reforms mandate 30% storage | +2.50% | National focus with early pilots in Zhambyl and Almaty | Short term (≤ 2 years) |
| National Infrastructure Plan 2024-2029 | +2.00% | Southern and western high-resource provinces | Medium term (2-4 years) |
| Fossil-fuel-subsidy phase-out | +1.50% | Nationwide with pilots in Almaty and Astana | Long term (≥ 4 years) |
| Green-hydrogen export strategy | +1.20% | Mangystau and western desert corridors where wind-solar hybrids feed electrolyzers | Long term (≥ 4 years) |
| Local turbine and module manufacturing push | +0.80% | Industrial zones in Zhambyl and Karaganda, export back-routes into Central Asia | Medium term (2-4 years) |
| Source: Mordor Intelligence | |||
Large-scale Foreign Direct Investment Transforms Market Dynamics
Substantial capital inflows have significantly shifted Kazakhstan’s renewable energy trajectory. Masdar’s 1 GW wind project in Jambyl, paired with a 600 MWh battery system, stands as Central Asia’s largest single renewable energy commitment.[1] Simultaneously, Chinese developers have pledged 2.6 GW of additional wind and solar projects through agreements with Samruk-Energy, clustering new capacity around Zhambyl and Karaganda. These deals accelerate technology transfer, anchor regional supply chains, and signal that sovereign wealth capital views renewables as strategic rather than speculative. Shared transmission corridors lower interconnection costs, while local manufacturing accords meet rising content requirements and reduce currency-exchange exposure for foreign partners.
Auction Reforms Drive Storage Integration and Hybrid Development
Amended 2025 auction rules require storage capacity equal to 30% of contracted renewable output and a minimum two-hour dispatch duration. The framework forces developers to internalize the costs of intermittency, stimulating demand for battery energy storage systems and hybrid plants that co-locate wind, solar, and storage. Early pilots in the Almaty and Shymkent industrial zones have shown reduced curtailment and improved peak-shaving performance. Grid operator KEGOC plans EUR 6 million in efficiency upgrades that complement the storage rule. The policy aligns economic incentives with reliability outcomes, making storage a mainstream cost component rather than an optional add-on.
National Infrastructure Plan Establishes Clear Renewable Trajectory
The 2024-2029 National Infrastructure Plan outlines a target of 12.5% renewable energy share by 2029, up from 5.92% in 2023. The roadmap requires 150,000 additional jobs and targets South Kazakhstan and Zhambyl for priority execution, ensuring grid-ready corridors and straightforward land acquisition. Public-private consortia, including TotalEnergies, ACWA Power, and local partners, streamline permitting and financing. The integration of renewables into broader industrial modernization policies elevates clean power from an environmental objective to a core economic infrastructure, shielding the program from election-cycle policy swings.
Fossil-Fuel Subsidy Phase-out Encourages Tariff Reform
Coal subsidies accounted for 6% of GDP in 2021, distorting power prices and extending the payback periods of renewable projects. A progressive rollback of subsidies, combined with incentive-based tariffs, now narrows the price gap between renewables and coal. Urban centers such as Almaty and Nur-Sultan are most affected by higher retail rates and carbon-constrained export markets. Phased implementation protects social welfare, yet forward certainty improves bankability for renewable developers and lowers their cost of capital.
Restraints Impact Analysis of Kazakhstan Renewable Energy Market*
| Restraint | (~) % Impact on CAGR Forecast | Geographic Relevance | Impact Timeline |
|---|---|---|---|
| Ageing transmission grid & congestion | −2.0% | Zhambyl, Mangystau, and Almaty | Short term (≤ 2 years) |
| 51% local-ownership rule for >499 MW projects | −1.5% | Nationwide | Medium term (2-4 years) |
| Low retail tariffs dampen rooftop solar economics | −1.0% | National, acute in rural households with high upfront-cost sensitivity | Short term (≤ 2 years) |
| Nuclear focus diverts budget and policy attention | −0.7% | National planning and sovereign borrowing capacity | Medium term (2-4 years) |
| Source: Mordor Intelligence | |||
Ageing Transmission Grid Constrains Integration
More than 66% of Kazakhstan’s transmission assets were classed as deteriorated in 2023.[2] Grid segmentation into three islands prevents surplus southern solar from easing northern shortages, resulting in curtailment and lost revenue. KEGOC’s multi-year reinforcement plan will not fully close the deficit before 2027. East Kazakhstan and Pavlodar, with high industrial load, suffer most, forcing developers to relocate projects or add costly private lines.
Coal-Subsidised Tariffs Undermine Project Economics
Below-market electricity prices compress renewable margins. Although coal subsidies are scheduled for gradual removal, political resistance in northern regions delays reforms and prolongs policy risk for investors.[3] Independent power producers face payback horizons that exceed loan tenors unless incentive tariffs materialize quickly. Distributed solar developers are most exposed because residential consumers benchmark their savings against static grid rates.
*Our forecasts treat driver/restraint impacts as directional, not additive. The impact forecasts reflect baseline growth, mix effects, and variable interactions.
Kazakhstan Renewable Energy Market Segment Analysis
By Technology:
Hydro Dominance Faces Bioenergy DisruptionHydropower represented 50.85% of renewable capacity in 2025, led by Bukhtarma’s 675 MW and Shardara’s 126 MW dams, which provide a seasonally aligned baseload. Continued uprating of turbines added nearly 28 MW of net capacity between 2024 and 2025, illustrating a pivot toward efficiency gains rather than greenfield expansion, given the limited availability of untapped basins. The Kazakhstan renewable energy market size for hydro is forecast to increase modestly through 2031, as small run-of-river facilities come online; however, its share will decline as faster-growing segments scale. Bioenergy’s negligible 2025 base belies its explosive 63.55% CAGR potential: a Turkish-backed biogas plant announced in March 2025 will process 300,000 tons of manure and agricultural waste annually in Turkestan, while KazMunayGas is piloting agricultural-residue-derived sustainable aviation fuel that blends with Jet A-1 at its Pavlodar refinery. Wind captured 23.65% in 2025 and enjoys the largest absolute addition pipeline, with Masdar’s 1 GW flagship and ACWA Power’s 1 GW Zhetysu project already secured under 25-year PPAs. Solar, sitting at 20.75%, has a steady queue of 300-500 MW annual builds, such as China Energy Engineering’s 300 MW Turkestan PV due in 2026
Pumped-storage hydro remains a long-cycle dream: feasibility studies for 800 MW of reversible units in the Irtysh-Zaisan basin received lukewarm lender feedback because of 12-year payback projections. Still, run-of-river micro-plants totaling 20.7 MW cleared the June 2024 auction, exploiting simplified permits that bypass reservoir-related environmental objections. The Kazakhstan renewable energy market share for bioenergy is expected to surpass 5% by 2031, provided all announced anaerobic digestion and biomass gasification projects are realized. Geothermal and tidal energy outlooks remain negligible due to the country’s landlocked geography and absence of high-enthalpy resources, although district-heating pilots in East Kazakhstan are exploring shallow geothermal loops for school buildings.

By End-User:
Utilities Dominate, Residential AwakensUtilities purchased 92.18% of renewable electrons in 2025 under the single-buyer Financial Settlement Center model that staples 20-year PPAs to sovereign backing. Independent power producers prefer the framework because it minimizes merchant risk and qualifies for export-credit guarantees. Commercial and industrial demand is the fastest-growing subsegment by absolute megawatt additions. A hyperscale data center in Zhetysu is rolling out a 110 MW solar-plus-storage system that co-locates generation with its server farm, beating grid tariffs by 18% on a levelized basis. Oil major KazMunayGas is building a 77 MW wind and 50 MW solar hybrid plant in Mangystau to power extraction pumps, reinforcing its corporate decarbonization commitments and reducing carbon-price exposure under future EU CBAM extensions. The Kazakhstan renewable energy market size for self-generation by corporates could hit 2 GW by 2031 once wheeling rules permit virtual PPAs, although regulators have yet to finalize tariff methodologies.
Residential capacity is currently small, yet it is projected to grow at a 16.1% CAGR as rooftop economics improve in tandem with the removal of subsidies and concessional EBRD loans. The Kazakhstan renewable energy market share for utilities is expected to taper to roughly 87.65% by 2031, as households and firms increase their participation. Electric-vehicle registrations rose 150% in 2024 to 7,500 units, introducing a new nighttime load that rooftop PV and behind-the-meter batteries can arbitrage. Still, the absence of smart metering and demand-response protocols limits dynamic-pricing benefits that normally complement distributed generation. Widespread adoption of rooftop solar hinges on local banks gaining confidence in homeowner repayment capacity, a hurdle that may soften as EBRD credit guarantees expand beyond current pilots.
Geography Analysis
The southern and western provinces host the bulk of newbuilds because they combine wind speeds of 7-9 m/s with solar irradiation above 1,600 kWh/m²/year. Zhambyl alone secured more than 3 GW of announced capacity, including TotalEnergies' USD 1.4 billion Mirny wind farm, China Power's 1 GW cluster, and SANY's manufacturing-linked project. Zhetysu follows as a storage hub, after ACWA Power's 1 GW plant incorporated a 30% battery slice in line with auction rules, and a hyperscale data center setup integrates 20 MW of lithium-ion storage. Mangystau anchors Hyrasia One's USD 50 billion green-hydrogen scheme, which will utilize 40 GW of wind and solar energy to export 2 million tons of H2 annually by 2032, positioning the province as a future hydrogen corridor.
Northern territories, such as Akmola and Pavlodar, offer inferior irradiation; however, the Asian Development Bank's backing for China Power's 220 MW wind portfolio indicates a growing appetite to spread resource risk and tap grid headroom that is currently unused by hydro assets in that region. Eastern Kazakhstan emphasizes run-of-river micro projects to harness mountain rivers, although protracted environmental hearings delay bankability assessments. The National Infrastructure Plan allocates 60% of the additional capacity to Zhambyl, Zhetysu, Turkestan, and Mangystau, raising concerns about regional inequality in electricity access and reinforcing the need for cross-provincial transmission upgrades to relay surplus power to Almaty and Astana load centers.. Curtailment episodes that shaved 20% off wind farm revenue in 2024 make capacity-evacuation lines and synchronous condensers urgent budget items for KEGOC.
Regulatory Landscape
Kazakhstan supports renewables under the Law of the Republic of Kazakhstan No. 165-IV dated 4 July 2009 (as amended through January 2026), with the Ministry of Energy setting policy, issuing implementing orders, and publishing annual auction schedules. The renewable offtake model is anchored by the Settlement and Financial Center (RFC), which operates as the single purchaser for electricity from renewable energy sources and administers standardized PPA settlement.
Competitive auctions are the core procurement route, with ministerial orders defining fixed tariffs and limiting auction prices (including Order No. 423 dated 27 November 2024). The 2026 auction program cited 915 MW of capacity, providing a defined pipeline by technology and location. Developers also need to align bid structures and project configurations with the latest auction documentation and RFC contracting requirements.
Competitive Landscape
The Kazakhstan renewable energy market is moderately concentrated. Samruk-Energy holds 31.3% of the generation, anchors grid planning, and frequently partners with foreign developers for large-scale auctions. Masdar, ACWA Power, TotalEnergies, and Eni utilize their global portfolios and concessional finance to secure competitive tenders. Chinese state-owned enterprises, backed by Belt and Road financing, offer low-cost EPC services and equipment bundles, often securing state-credit guarantees to mitigate currency risk.
Competitive advantage revolves around integrated solutions. Firms that bundle development, storage technology, and long-term service contracts gain tender scoring points. Storage know-how differentiates bids since the 30% battery rule became mandatory. Local content compliance remains pivotal; joint ventures with domestic entities satisfy the 51% ownership criterion for projects above 499 MW, allowing foreign sponsors to retain management control while unlocking incentives.
Emerging niches include distributed solar installers, energy-as-a-service providers, and hydrogen technology integrators. Early movers in these segments secure first-mover advantages and influence the evolution of technical standards. Corporate power purchase agreements are nascent but attract exporters that must meet EU Carbon Border Adjustment Mechanism thresholds. Equipment manufacturers view Kazakhstan as a gateway to the wider Central Asia region, setting up assembly lines that serve not only local demand but also Uzbekistan and Kyrgyzstan.
Kazakhstan Renewable Energy Industry Leaders
-
Samruk-Energy JSC
-
Eni SpA
-
Masdar
-
TotalEnergies
-
China Energy Engineering Corp.
- *Disclaimer: Major Players sorted in no particular order
Kazakhstan Renewable Energy Market Companies Covered in this Report
- Samruk-Energy JSC
- Eni SpA
- General Electric Co.
- TotalEnergies / Total Eren SA
- Andritz AG
- KazHydro Operating LLP
- CATEK Green Energy LLP
- Masdar
- ACWA Power
- China Energy Engineering Corp.
- Goldwind Science & Technology Co.
- Siemens Gamesa Renewable Energy SA
- Vestas Wind Systems A/S
- PowerChina
- Visor Kazakhstan BV
- ArmWind LLP (Eni)
- KP Starwind LLP
- Uranus Wind LLP
- Qazaq Green Power
- Burnoye Solar-1 LLP
Market Opportunities and Future Outlook
Grid-firming renewables and hybridization represent a clear growth avenue, supported by auction requirements that drive battery energy storage integration into new utility-scale builds. This shows up in project decisions and starts in 2026, including TotalEnergies taking a final investment decision on the 1 GW Mirny wind project with a 600 MWh BESS, and Masdar starting construction of a 1 GW wind project in Zhambyl with a 300 MW/600 MWh BESS in partnership with Samruk-Kazyna. Together, these commitments steer the market toward dispatchable renewable capacity rather than energy-only additions.
Geographic diversification beyond the established southern wind-solar clusters is also creating additional development corridors where auctions meet industrial loads. Government-sanctioned 2026 auction awards such as a 250 MW wind project in Atyrau (with at least 30% BESS) and a 100 MW wind project in the Northern Zone indicate wind procurement spreading into new zones, while the single-buyer RFC structure continues to provide bankable offtake for utility-scale projects. Corporate decarbonization and self-supply are further translating into larger behind-the-meter projects, supporting near-term demand for EPCs, integrators, and service providers that can package generation, storage, and grid-connection solutions around Kazakhstan's auction and settlement rules.
Recent Industry Developments in Kazakhstan Renewable Energy Market
- June 2026: Masdar commenced construction of its inaugural 1 GW wind farm in Kazakhstan in the Zhambyl region, integrating a 300 MW/600 MWh battery energy storage system. The project structure reinforces the shift toward wind-plus-storage as a bankable template for delivering firm capacity under Kazakhstan's evolving auction and grid-reliability needs.
- April 2026: TotalEnergies announced final investment decision for the 1 GW Mirny onshore wind project in Kazakhstan, designed with a 600 MWh battery energy storage system and backed by a large capital commitment. The build strengthens the large-project pipeline and deepens collaboration with national partners for delivery and offtake.
- July 2024: KazMunayGas and Eni broke ground on a 250 MW hybrid renewables-gas power plant in Zhanaozen, Mangystau Region. The project links renewable generation with flexible thermal capability, creating a pathway for industrial power reliability while lowering emissions intensity in an oil-producing region.
Kazakhstan Renewable Energy Market Report Scope and Research Methodology
Market Definition and Coverage
For this study, the Kazakhstan renewable energy market is defined as the country-level installed renewable power capacity added and operating, measured in gigawatts, across grid-connected renewable generation technologies.
Scope exclusions: We exclude conventional thermal generation and upstream fuel activities, and we do not count off-grid captive sets unless they are formally recorded in national capacity statistics.
Segments Covered in This Report
- By Technology
- Solar Energy (PV and CSP)
- Wind Energy (Onshore and Offshore)
- Hydropower (Small, Large, PSH)
- Bioenergy
- Geothermal
- Ocean Energy (Tidal and Wave)
- By End-User
- Utilities
- Commercial and Industrial
- Residential
Data Sources, Market Sizing, and Validation
Desk Research
We start with desk research to map the Kazakhstan power system and to pin down the renewable capacity base by technology. Public sources such as the International Renewable Energy Agency (IRENA), the International Energy Agency (IEA), World Bank energy indicators, and UN Comtrade are used to cross-check installation trends and equipment trade flows that typically follow build cycles.
To keep assumptions realistic, we also review Kazakhstan energy ministry and regulator publications (where available), national statistics releases, grid and system operator updates, and reputable press coverage of commissioning and auction outcomes. Company annual reports, investor presentations, and a paid subscription focused on company financials and news are then used to confirm project timing, ownership changes, and major capacity milestones. The sources listed here are illustrative, and many other references were used for data collection, validation, and clarification during the work.
Primary Interviews and Surveys
Interviews and surveys with Kazakhstan-based developers, utilities, financiers, engineering advisers, and policy specialists test auction prices, capacity factors, curtailment, commissioning dates, and expected additions. We use these findings to resolve gaps in official registers, adjust delayed project timing, and check local operating assumptions before final analysis.
Distribution of primary research fieldwork respondents
| Company type | Respondent position |
|---|---|
| Top tier: 28% | CXOs: 15% |
| Mid tier: 52% | Functional/Unit leaders: 34% |
| Smaller Players: 20% | Managers: 51% |
Market-Sizing & Forecasting
The core model is built using top-down reconstruction, where national installed capacity series and technology-wise additions are used to build the year-by-year gigawatt totals for renewables in Kazakhstan. Once the country totals are built, the numbers are corroborated with selective bottom-up checks, such as sampling known project capacities and commissioning dates, followed by simple roll-ups to see if the direction and step-changes match.
A few practical inputs are tracked consistently, because they explain most of the movement in this market. These include renewable auction schedules and awarded volumes, grid connection readiness and curtailment signals, project commissioning lead times, the share of wind and solar in annual additions, and the expected retirement or repowering pattern for older assets where relevant. For forecasting, scenario analysis is used to translate pipeline confidence into additions, and then an exponential smoothing layer is applied to avoid unrealistic year-to-year spikes unless primary inputs clearly support them. Where project-level detail is missing, capacity is only added when multiple signals line up, such as a recorded award plus progress toward construction and grid access confirmation from interviews.
Data Validation & Update Cycle
Results are validated through multiple checks that compare the model output with independent signals like published capacity snapshots, major commissioning announcements, and technology mix trends for Kazakhstan, and then variances are reviewed before sign-off. When a number looks out of pattern, the assumption behind it is revisited, and the analyst may re-contact relevant stakeholders to confirm what changed.
The report is refreshed annually, and interim updates are made when material events occur, such as new auction rounds, major grid policy changes, or a shift in commissioning schedules. Before delivery, a final review pass is completed to ensure the latest public updates and primary feedback have been reflected consistently across the series.
Mordor Intelligence's Kazakhstan Renewable Energy Market Size Versus Other Published Estimates
It is normal to see published market sizes differ for Kazakhstan renewable energy, since the studies often measure different things, choose different base years, and apply different rules for what counts as part of the market. Some estimates describe installed capacity, while others describe electricity generation value, which can produce a very different number even for the same country and year.
By tracking commissioning cutoffs, capacity re-statements, and technology-wise additions year by year, Mordor Intelligence keeps the estimate anchored to installed renewable capacity in gigawatts, while some sources blend generation value and wholesale pricing or treat planned projects as already counted. The biggest gaps typically come from mixing capacity with production metrics, using different conversion steps, and refreshing assumptions at different points in the year, which then changes what is considered the latest installed base.
Benchmark comparison
| Source | Market Size | Gaps in Research Methodology |
|---|---|---|
| Mordor Intelligence | USD 6.48 B (2025) | |
| Industry Data Publisher A | USD 0.07 B (2024) | This estimate expresses renewable electricity generation as a value proxy (net production multiplied by wholesale price), so it is not comparable to an installed-capacity market size and will appear much smaller in USD terms. |
| Academic Source B | USD 7.58 B (2024) | The underlying data point reflects total renewable electricity production rather than installed capacity, and the unit treatment is not consistently stated, which can cause conversion-driven inflation when mapped into a USD market size. |
The spread mainly reflects what is being measured and when it is counted, not just a math difference. When the boundary is kept tight around installed gigawatts and checked against commissioning signals, the resulting series is easier to replicate and to use for planning, especially for capacity-led investment decisions.
Key Questions Answered in the Report
What is Kazakhstan’s installed renewable generation capacity today and its forecast for 2031?
The country reached 7.16 GW in 2026 and is projected to climb to 11.85 GW by 2031, reflecting a 10.57% CAGR.
Which technology contributes the largest share of clean-power capacity in Kazakhstan?
Hydropower accounts for 50.85% of installed renewables, anchored by large dams such as Bukhtarma and Shardara.
How does the 30% storage requirement in 2025 auctions influence project returns?
Batteries add 15-20% to upfront costs yet unlock premium tariffs and future capacity payments that improve internal rates of return.
What ownership rules must foreign developers observe for projects above 499 MW?
They must structure joint ventures that keep at least 51% equity in Kazakh hands, extending deal timelines and diluting control.
Which regions currently attract the most utility-scale solar and wind commitments?
Zhambyl, Zhetysu, Turkestan, and Mangystau lead because they combine high irradiation or strong wind speeds with existing grid nodes.
Could the approved nuclear program slow renewable additions after 2026?
Budget and policy focus may pivot to the USD 10-12 billion reactor plan, potentially moderating auction cadence and grid-upgrade funding.