ELISA Analyzer Market Size and Share
Market Overview
| Study Period | 2020 - 2031 |
|---|---|
| Market Size (2026) | USD 734.73 Million |
| Market Size (2031) | USD 888.52 Million |
| Growth Rate (2026 - 2031) | 3.87% CAGR |
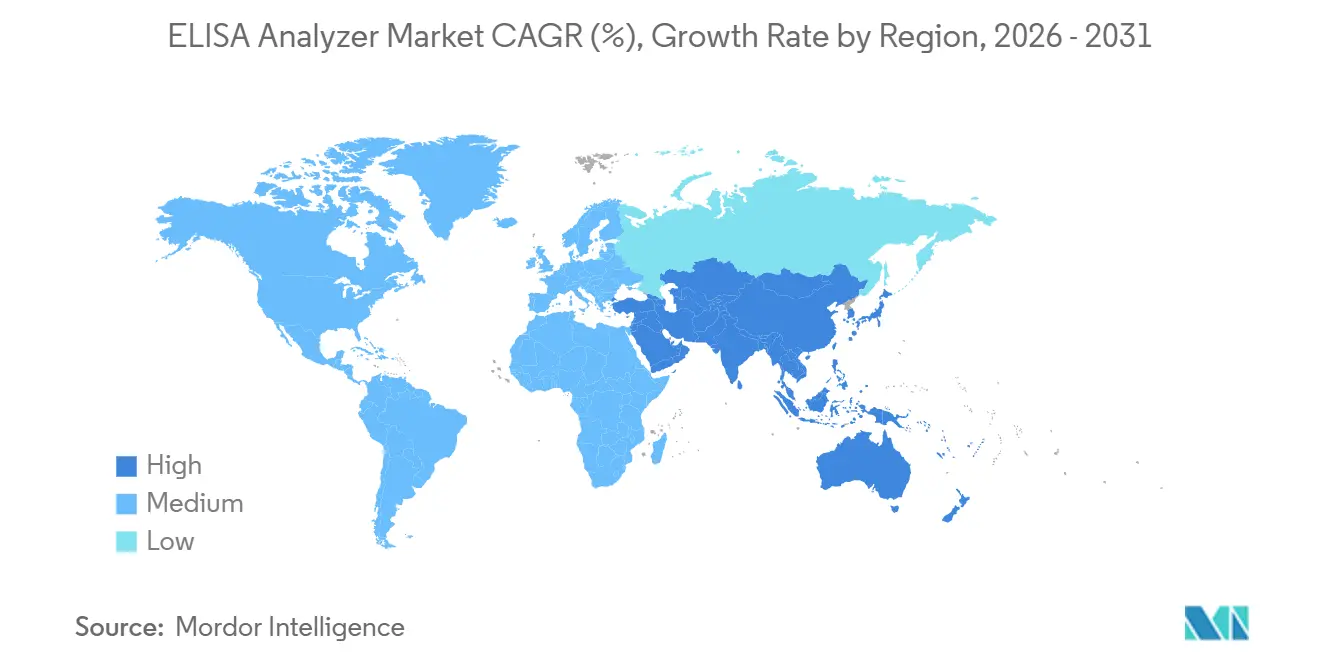
| Fastest Growing Market | Asia-Pacific |
| Largest Market | North America |
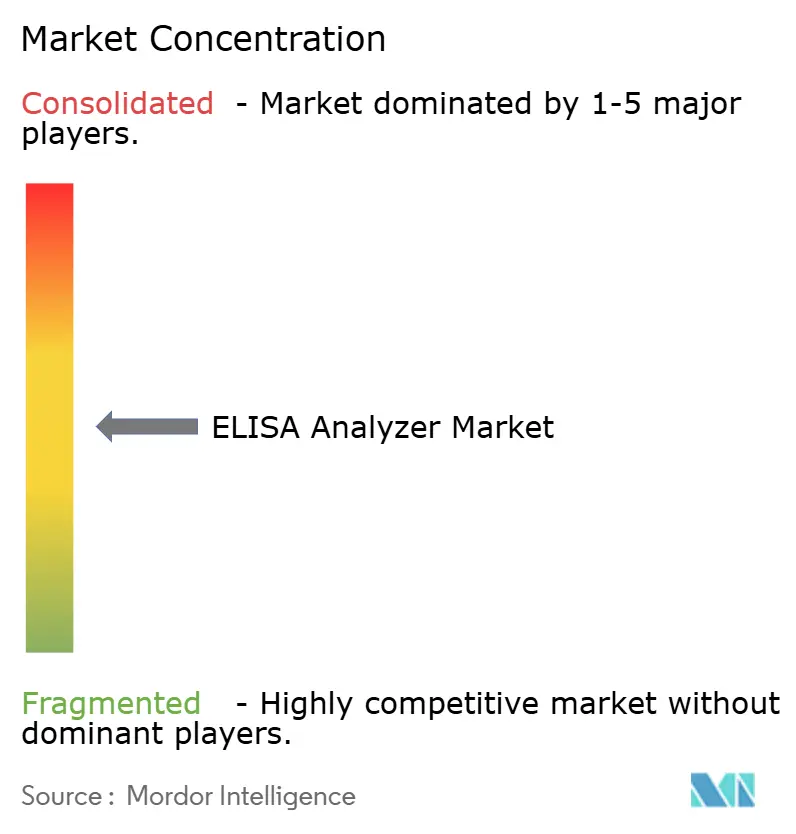
| Market Concentration | Medium |
Major Players *Disclaimer: Major Players sorted in no particular order Image © Mordor Intelligence. Reuse requires attribution under CC BY 4.0. | |
ELISA Analyzer Market Analysis by Mordor Intelligence
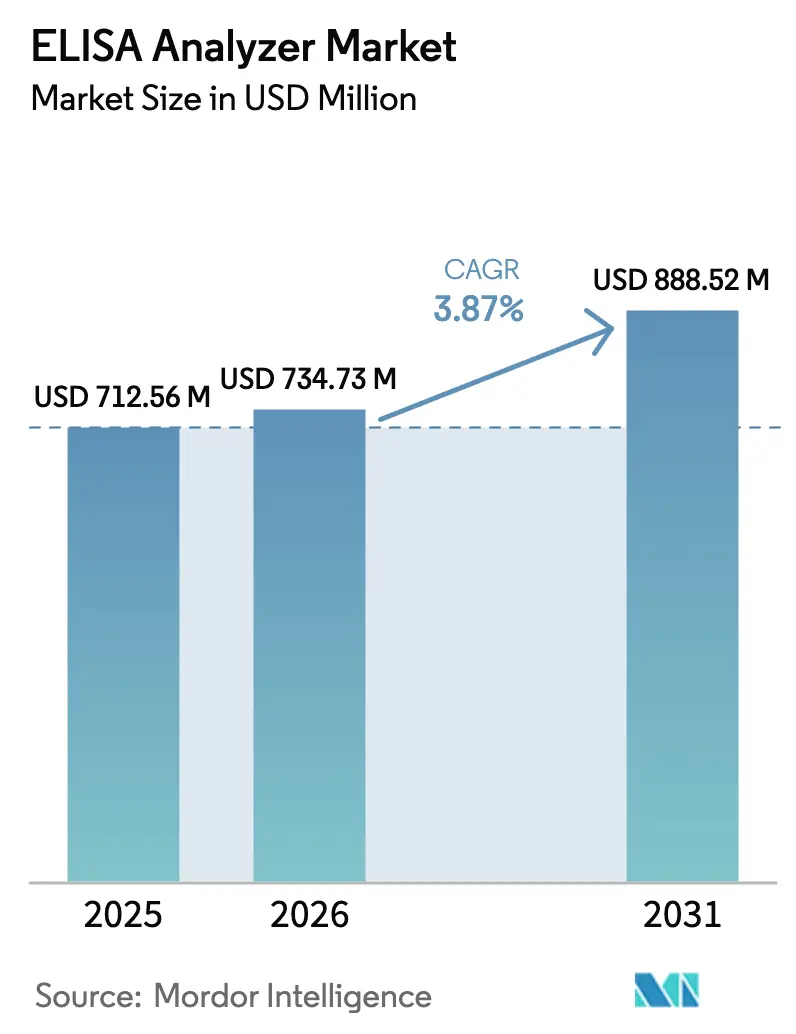
The ELISA Analyzer Market size is expected to increase from USD 712.56 million in 2025 to USD 734.73 million in 2026 and reach USD 888.52 million by 2031, growing at a CAGR of 3.87% over 2026-2031.
Installed bases in North America and Europe are maturing, yet Asia-Pacific laboratories, vaccine developers, and pharmaceutical quality-control facilities are driving fresh demand for automated, network-ready platforms. Bench-top systems still dominate high-complexity reference sites, but portable units are gaining momentum as decentralized testing models take root in rural health centers and investigator-site clinical trials. Chemiluminescence platforms continue to displace legacy colorimetric detection for applications that demand femtogram-level sensitivity, while AI-enabled firmware upgrades are beginning to shrink downtime, flag reagent-lot variability, and automate result interpretation. Competitive intensity remains moderate; the five largest suppliers capture roughly 55%-60% of revenue through vertically integrated reagent-instrument bundles that lock in multi-year service contracts. Price-sensitive markets, supply-chain re-shoring, and synchronized regulatory deadlines in the United States, Europe, and China are shaping the purchasing calendar for 2025-2026.
Key Report Takeaways
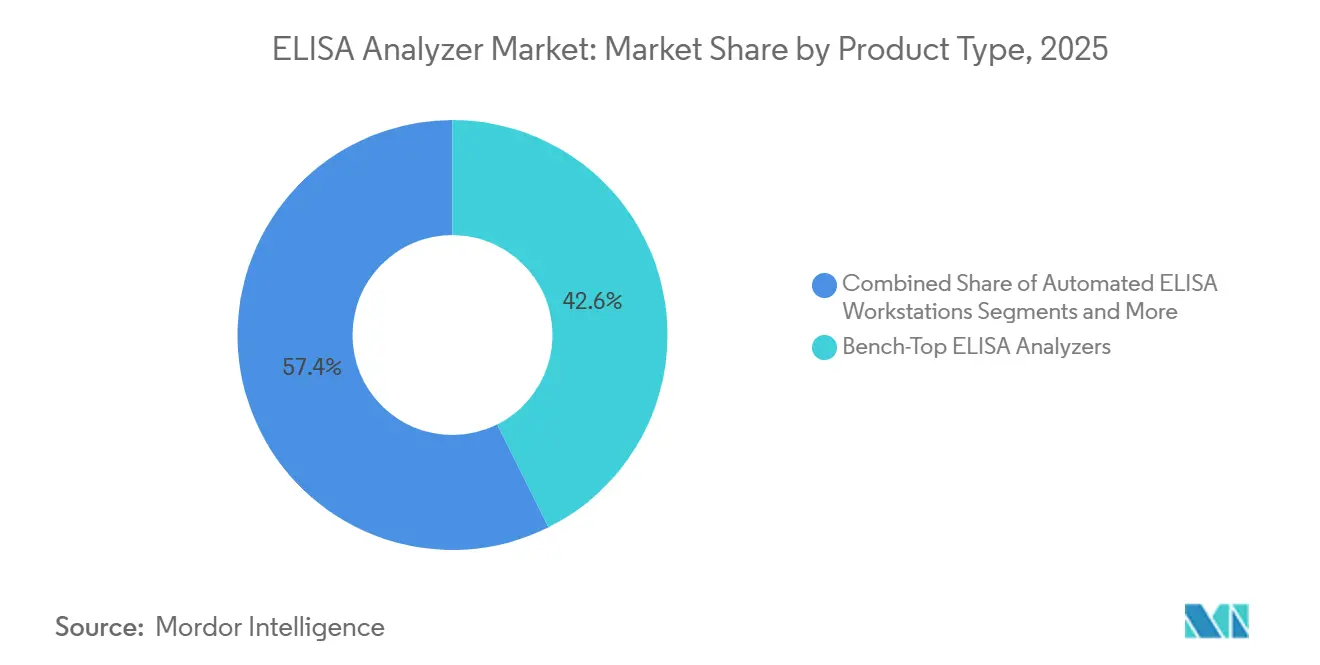
- By product type, bench-top analyzers held 42.63% of ELISA analyzer market share in 2025, while portable and handheld systems are forecast to expand at a 7.24% CAGR through 2031.
- By automation level, fully automated platforms captured 51.75% of the ELISA analyzer market size in 2025 and are projected to grow at 6.14% over 2026-2031.
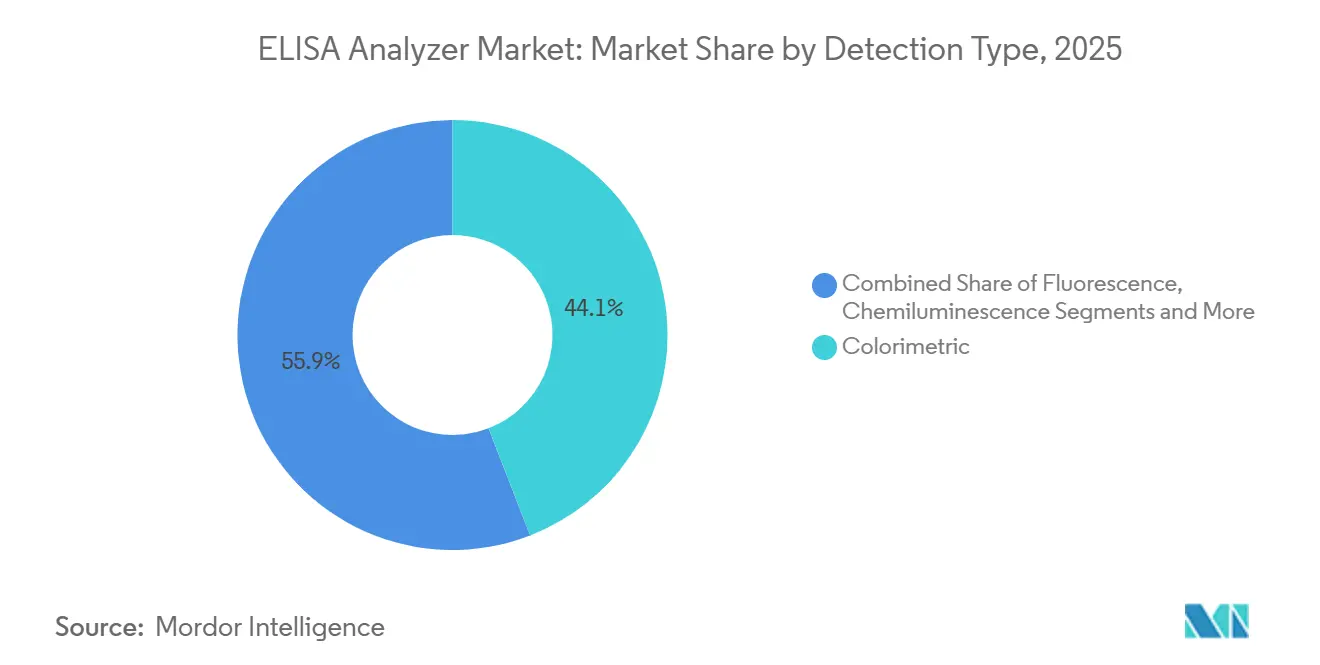
- By detection technology, colorimetric instruments accounted for 44.12% of 2025 revenue, whereas chemiluminescence systems are advancing at a 7.23% CAGR through 2031.
- By application, clinical diagnostics led with 56.42% of 2025 revenue, and vaccine development is set to grow at a 7.92% CAGR between 2026-2031.
- By end user, hospitals and clinics generated 36.77% of 2025 revenue, while pharmaceutical and biotechnology companies are rising at a 5.35% CAGR to 2031.
- By geography, North America captured 34.23% of 2025 revenue, whereas Asia-Pacific is forecast to expand at a 6.31% CAGR through 2031.
Note: Market size and forecast figures in this report are generated using Mordor Intelligence’s proprietary estimation framework, updated with the latest available data and insights as of 2026.
Global ELISA Analyzer Market Trends and Insights
Driver Impact Analysis*
| Driver | (~) % Impact on CAGR Forecast | Geographic Relevance | Impact Timeline |
|---|---|---|---|
| Rising burden of chronic & infectious diseases driving high-throughput serology demand | 0.8% | Global, with acute pressure in APAC and Sub-Saharan Africa | Medium term (2-4 years) |
| Automation uptake improving lab productivity & turnaround time | 0.7% | North America & Europe core, spill-over to urban APAC hubs | Short term (≤ 2 years) |
| Regulatory push for traceability in diagnostic labs | 0.5% | North America (FDA LDT rule), Europe (IVDR), China (NMPA) | Short term (≤ 2 years) |
| Expansion of decentralized & point-of-care platforms in emerging markets | 0.6% | APAC (India, Indonesia, Philippines), MEA, South America | Medium term (2-4 years) |
| AI-driven analytics enabling predictive maintenance & result interpretation | 0.4% | North America, Western Europe, select APAC metros | Long term (≥ 4 years) |
| Geo-political trade shifts spurring local manufacturing & equipment refresh | 0.3% | China, India, Mexico, Eastern Europe | Medium term (2-4 years) |
| Source: Mordor Intelligence | |||
Rising Burden of Chronic & Infectious Diseases Driving High-Throughput Serology Demand
Cardiovascular and diabetes screening programs are pushing serology test volumes up 12%-15% per year in India and Indonesia, while the World Health Organization logged 249 million malaria cases in 2024.[1]World Health Organization, “World Malaria Report 2024,” WHO, who.int Vaccine-preventable disease surveillance now requires platforms that can process 200-400 samples in a standard shift, a throughput manual workflows cannot match. Aging Western populations need routine autoimmune and tumor-marker monitoring, compounding demand in wealthier regions. China’s National Health Commission has ordered every county hospital to establish clinical immunology departments by 2025, fueling chemiluminescence purchases that replace labor-intensive manual protocols.[2]National Health Commission of China, “14th Five-Year Plan for Healthcare Development,” NHC, nhc.gov.cn
Automation Uptake Improving Lab Productivity & Turnaround Time
A 2025 Journal of Clinical Microbiology study showed fully automated ELISA workstations cut technologist hands-on time six- to ten-fold versus semi-automated pipetting systems. Same-day reporting for therapeutic drug levels is now routine in North American hospitals where onboard washers and incubators compress total assay time from four hours to 90 minutes. Labor savings can exceed USD 100,000 per full-time equivalent, an attractive proposition where technologist salaries top USD 60,000. Automation also lowers operator-dependent variability, a cornerstone of ISO 15189:2022 accreditation.[3]International Organization for Standardization, “ISO 13485:2016 Medical Devices — Quality Management Systems,” ISO, iso.org
Regulatory Push for Traceability in Diagnostic Labs
The FDA’s May 2024 final rule ends enforcement discretion for laboratory-developed tests and mandates electronic audit trails for every calibration event. Europe’s In Vitro Diagnostic Regulation (IVDR) imposes similar obligations and took full effect in May 2025. China requires Class III devices to integrate with the National Health Information Platform, favoring cloud-connected analyzers. Together, these timelines are triggering a synchronized equipment refresh across the three largest markets.
Expansion of Decentralized & Point-of-Care Platforms in Emerging Markets
India’s Ayushman Bharat Digital Mission is equipping 10,000 primary health centers with Bluetooth-enabled portable devices. Indonesia procured 1,200 handheld immunoassay readers for its maternal health program in 2025. Portable analyzers are now common in vaccine clinical trials, eliminating cold-chain specimen transport and trimming logistics costs by up to 50%. The FDA cleared three portable ELISA platforms in 2025, confirming laboratory-grade performance in point-of-care settings.
Restraints Impact Analysis*
| Restraint | (~) % Impact on CAGR Forecast | Geographic Relevance | Impact Timeline |
|---|---|---|---|
| High capex & maintenance costs of fully automated systems | -0.4% | Global, acute in price-sensitive emerging markets | Short term (≤ 2 years) |
| Shortage of skilled personnel to validate complex immunoassays | -0.3% | North America, Europe, urban APAC | Medium term (2-4 years) |
| Competition from multiplex molecular platforms with faster turnaround time | -0.5% | North America, Western Europe | Short term (≤ 2 years) |
| Regulatory variability & lengthy approvals for software-driven upgrades | -0.2% | Global, particularly EU and China | Medium term (2-4 years) |
| Source: Mordor Intelligence | |||
High Capex & Maintenance Costs of Fully Automated Systems
Turnkey analyzers list for USD 150,000-350,000, well above annual equipment budgets for most public laboratories in Asia-Pacific and South America. Five-year operating leases exist, yet uptake remains under 15% because IFRS 16 forces lease liabilities onto balance sheets. Proprietary reagent lock-in can inflate per-test costs 20%-25%, a barrier for budget-constrained facilities.
Shortage of Skilled Personnel to Validate Complex Immunoassays
The American Society for Clinical Laboratory Science logged a 12% vacancy rate for medical laboratory scientists in 2025. ISO 15189 validation demands 20-40 hours of assay characterization, straining thin staffing rosters. Even after installation, many automated systems run under 50% capacity in their first year because technologists lack the certification hours required for full utilization.
*Our forecasts treat driver/restraint impacts as directional, not additive. The impact forecasts reflect baseline growth, mix effects, and variable interactions.
Segment Analysis
By Product Type: Portable Growth Outpaces Bench-Top Dominance
Bench-top analyzers contributed 42.63% to ELISA analyzer market share in 2025. Their integrated washers and incubators make them indispensable in reference centers processing 500-2,000 samples daily. Yet portable systems are registering a 7.24% CAGR, reflecting robust demand from India’s primary health clinics, Indonesian maternal-care sites, and sub-Saharan Africa’s malaria-monitoring outposts. Pharmaceutical sponsors now ship handheld units directly to investigator clinics, cutting per-trial logistics costs by up to 50% and accelerating sample-to-result workflows.
The ELISA analyzer market size for portable systems is poised to widen as FDA 510(k) clearances validate analytical parity with laboratory-based readers. Portable adoption also dovetails with supply-chain re-shoring; locally assembled battery-powered analyzers reach customers in under eight weeks, compared with the 20-week lead times typical for imported bench-top units. Bench-top platforms will retain primacy where high-throughput and ISO accreditation dictate closed workflows, but decentralized programs are structurally changing procurement hierarchies.


By Automation Level: Fully Automated Platforms Anchor High-Volume Sites
Fully automated platforms accounted for 51.75% of ELISA analyzer market size in 2025 and are set to grow 6.14% through 2031. Their robotic sample handlers and barcode-driven tracking slash hands-on labor and make 200-400 samples per shift routine. Semi-automated systems still fit mid-tier hospitals that aim to improve throughput without the USD 150,000-300,000 capex of full automation. Manual readers are now confined to low-volume research labs.
Cost-benefit math drives uptake where technologist wages exceed USD 60,000, delivering payback in two-to-three years. Emerging-market buyers continue to view semi-automation as a stepping stone—vendors now offer modular add-ons that convert pipetting stations into fully robotic lines, protecting the original investment and smoothing upgrade paths.
By Detection Technology: Chemiluminescence Extends Reach in Pharma Labs
Colorimetric detection held 44.12% of 2025 revenue because legacy assays and lower capital costs keep entry barriers low. Chemiluminescence is advancing 7.23% annually on the back of femtogram-level sensitivity demanded by therapeutic antibody quantification and mRNA vaccine analytics. Fluorescence occupies a niche in multiplex cytokine panels, while electrochemical detection is gaining modest traction in battery-powered field units.
ELISA analyzer market share for chemiluminescence is climbing in pharmaceutical quality-control suites, where a recent Clinical Chemistry study showed coefficients of variation below 5% across a 4-log range. The performance premium offsets higher instrument and reagent costs when precision directly influences regulatory submissions.
By Application: Vaccine Development Becomes the Fastest-Growing Use-Case
Clinical diagnostics generated 56.42% of 2025 revenue, a testament to ELISA’s four-decade entrenchment in hospital labs. Vaccine development, however, is accelerating at a 7.92% CAGR to 2031 as mRNA platforms require high-throughput immunogenicity endpoints. Drug discovery and monitoring represent 18% of the pie, while food-allergen testing benefits from January 2026 FSMA Section 204 traceability mandates.
ELISA analyzer market size for vaccine applications is expanding alongside CRO investments; the top 10 providers poured more than USD 400 million into automation in 2025. As global clinical-trial volume rises, labs touting 400-sample shifts gain competitive advantage.
By End User: Pharma & Biotech Labs Narrow the Gap With Hospitals
Hospitals and clinics delivered 36.77% of 2025 revenue, relying on analyzers integrated with hospital information systems to release same-day therapeutic drug levels. Diagnostic lab networks follow close behind at roughly 28%. Pharmaceutical and biotechnology firms are rising at a 5.35% CAGR, fueled by bioanalytical demands from accelerated regulatory pathways.
ELISA analyzer market share trends reveal CROs as pivotal buyers; capacity utilization now ranks as a bid-evaluation metric when sponsors place multi-year assay contracts. Research institutions and the food sector round out demand, the latter leveraging ELISA’s quantitative accuracy for allergen compliance.

Geography Analysis
North America generated 34.23% of 2025 revenue, buoyed by FDA traceability mandates and per-capita health spending above USD 12,000. Canada and Mexico provide additional lift; the latter became a manufacturing hub once Chinese suppliers opened assembly facilities in Monterrey and Tijuana to dodge U.S. tariffs. Forecast growth hovers around 3.2%-3.5% through 2031, tempered by saturation but supported by cell-therapy monitoring and next-wave mRNA vaccine pipelines.
Asia-Pacific is expanding 6.31% annually, led by China’s county-hospital modernization and India’s digital health mission. Domestic champions Mindray and Snibe control more than half of China’s market by pricing 30%-40% below Western incumbents. Japan and South Korea show slower growth near 3%, while Australia’s path-lab upgrades linked to ISO 15189 adoption lift regional demand.
In Europe, Germany, France, and the United Kingdom dominate regional buying, with laboratories racing to replace non-compliant hardware ahead of IVDR enforcement. The Middle East & and Africa is anchored by Saudi Arabia’s SAR 12 billion laboratory-modernization plan. South America grows, although currency swings and import duties inflate capital costs by up to 35%.

Competitive Landscape
Thermo Fisher Scientific, Danaher, Bio-Rad, Abbott, and DiaSorin together hold large share of 2026 revenue, leveraging bundled reagent-instrument contracts that embed multi-year service obligations. Danaher’s 2024 Abcam acquisition exemplifies the vertical-integration playbook, marrying vast antibody catalogs with automation hardware. Chinese suppliers Mindray and Snibe win share in cost-sensitive regions but face cybersecurity and tariff headwinds in high-income markets.
White-space opportunities center on portable analyzers that deliver laboratory-grade quantitation at the point of care, displacing qualitative lateral-flow immunoassays. Automation specialists Hamilton Robotics and Tecan are promoting open-architecture liquid-handling lines that retrofit into existing readers, giving research labs reagent flexibility. Vendors race to embed AI-powered quality controls; early adopters report downtime cuts of roughly one-third and faster root-cause investigations when reagent lots drift out of tolerance.
ELISA Analyzer Industry Leaders
Thermo Fisher Scientific Inc.
Abbott Laboratories
Danaher Corp.
Bio-Rad Laboratories, Inc.
Revvity Inc.
- *Disclaimer: Major Players sorted in no particular order

Recent Industry Developments
- September 2025: Cerillo introduced Rayo, a compact multi-wavelength microplate reader showcased at Analytica USA.
- July 2025: Quansys Biosciences launched the Q-View Imager Plus with upgraded imaging and analysis software.
- June 2025: The FDA cleared Randox Laboratories’ ConcizuTrace ELISA as a companion diagnostic for concizumab dose adjustment.


Global ELISA Analyzer Market Report Scope
As per the scope of the report, ELISA analyzers are analytical instruments that perform a basic function needed to process an ELISA. These functions include reagent dispensing, microplate washing, incubation, and absorbance measurement.
The ELISA Analyzer Market Report is segmented by Product Type, Automation Level, Detection Technology, Application, End User, and Geography. By Product Type, the market is segmented into Bench‑Top, Portable, Automated Workstations, and Microplate Readers. By Automation Level, the market is segmented into Fully Automated, Semi‑Automated, and Manual systems. By Detection Technology, the market is segmented into Colorimetric, Fluorescence, Chemiluminescence, and Electrochemical. By Application, the market is segmented into Clinical Diagnostics, Vaccine Development, Drug Discovery, Food Testing, and Environmental applications. By End User, the market is segmented into Hospitals, Diagnostic Labs, Research Institutions, Pharma & Biotech companies, and the Food Industry. By Geography, the market is segmented into North America, Europe, Asia‑Pacific, MEA, and South America. The market report also covers the estimated market sizes and trends for 17 countries across major regions globally. Market Forecasts are Provided in Terms of Value (USD).
| Bench-Top ELISA Analyzers |
| Portable / Handheld ELISA Analyzers |
| Automated ELISA Workstations |
| Microplate Readers |
| Fully Automated Systems |
| Semi-Automated Systems |
| Manual Systems |
| Colorimetric |
| Fluorescence |
| Chemiluminescence |
| Electrochemical |
| Clinical Diagnostics |
| Vaccine Development |
| Drug Discovery & Monitoring |
| Food & Beverage Testing |
| Environmental & Other Applications |
| Hospitals & Clinics |
| Diagnostic Laboratories |
| Research & Academic Institutions |
| Pharmaceutical & Biotechnology Companies |
| Food & Beverage Industry |
| North America | United States |
| Canada | |
| Mexico | |
| Europe | Germany |
| France | |
| United Kingdom | |
| Italy | |
| Spain | |
| Rest of Europe | |
| Asia-Pacific | China |
| Japan | |
| India | |
| South Korea | |
| Australia | |
| Rest of Asia-Pacific | |
| Middle East & Africa | GCC |
| South Africa | |
| Rest of Middle East & Africa | |
| South America | Brazil |
| Argentina | |
| Rest of South America |
| By Product Type | Bench-Top ELISA Analyzers | |
| Portable / Handheld ELISA Analyzers | ||
| Automated ELISA Workstations | ||
| Microplate Readers | ||
| By Automation Level | Fully Automated Systems | |
| Semi-Automated Systems | ||
| Manual Systems | ||
| By Detection Technology | Colorimetric | |
| Fluorescence | ||
| Chemiluminescence | ||
| Electrochemical | ||
| By Application | Clinical Diagnostics | |
| Vaccine Development | ||
| Drug Discovery & Monitoring | ||
| Food & Beverage Testing | ||
| Environmental & Other Applications | ||
| By End User | Hospitals & Clinics | |
| Diagnostic Laboratories | ||
| Research & Academic Institutions | ||
| Pharmaceutical & Biotechnology Companies | ||
| Food & Beverage Industry | ||
| By Geography | North America | United States |
| Canada | ||
| Mexico | ||
| Europe | Germany | |
| France | ||
| United Kingdom | ||
| Italy | ||
| Spain | ||
| Rest of Europe | ||
| Asia-Pacific | China | |
| Japan | ||
| India | ||
| South Korea | ||
| Australia | ||
| Rest of Asia-Pacific | ||
| Middle East & Africa | GCC | |
| South Africa | ||
| Rest of Middle East & Africa | ||
| South America | Brazil | |
| Argentina | ||
| Rest of South America | ||


Key Questions Answered in the Report
How large is the ELISA analyzer market in 2026?
It stood at USD 734.73 million in 2026 and is projected to reach USD 888.52 million by 2031.
What CAGR is forecast for ELISA analyzers through 2031?
A CAGR of 3.87% is expected for the period 2026-2031.
Which product category is growing fastest?
Portable and handheld analyzers are expanding at a 7.24% CAGR as decentralized testing gains favor.
Why are chemiluminescence platforms gaining share?
Pharmaceutical and vaccine developers need femtogram-level sensitivity that chemiluminescence delivers, driving a 7.23% CAGR.
Which region shows the highest growth potential?
Asia-Pacific leads with a 6.31% CAGR, propelled by China’s and India’s laboratory-modernization programs.
Page last updated on:


