Market Overview
| Study Period | 2021 - 2031 |
|---|---|
| Forecast Data Period | 2026 - 2031 |
| Historical Data Period | 2021 - 2024 |
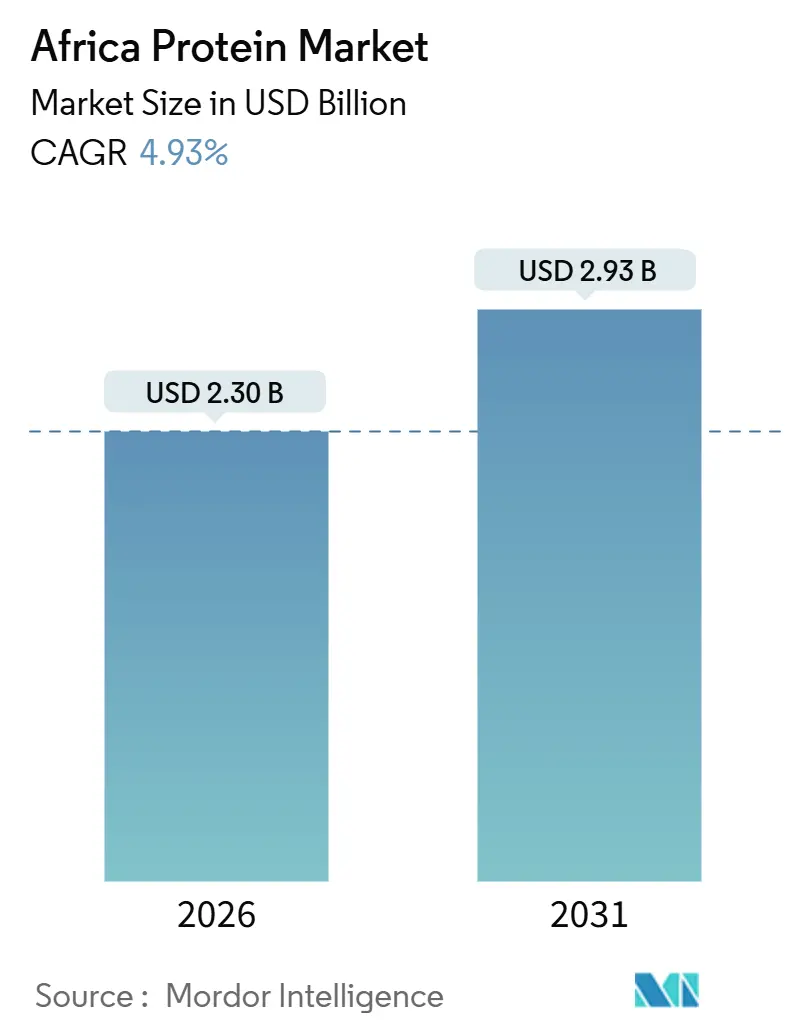
| Market Size (2026) | USD 2.30 Billion |
| Market Size (2031) | USD 2.93 Billion |
| Growth Rate (2026 - 2031) | 4.93% CAGR |
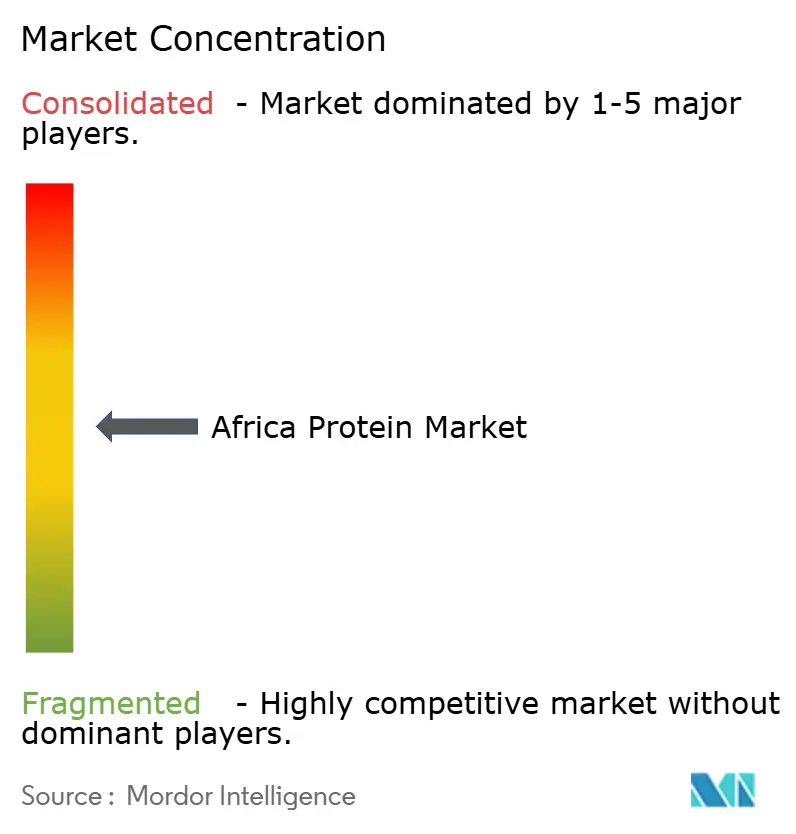
| Market Concentration | Medium |
Major Players*Disclaimer: Major Players sorted in no particular order Image © Mordor Intelligence. Reuse requires attribution under CC BY 4.0. |
|
Africa Protein Market Analysis by Mordor Intelligence
The Africa protein market size is estimated at USD 2.30 billion in 2026, and is expected to reach USD 2.93 billion by 2031, at a CAGR of 4.93% during the forecast period (2026-2031). Faster urbanization, a growing middle class, and government nutrition programs are steering consumers toward higher-protein diets, while technology upgrades in extraction and fermentation continue to widen local supply options. Animal-derived ingredients still dominate volumes, but microbial and insect alternatives are advancing as producers look to sidestep feed, land, and water constraints. Hydrolysates outpace other forms because infant-formula and sports-recovery brands value rapid absorption and hypoallergenic traits. Food and beverage manufacturers absorb most demand, yet dietary supplements and sports nutrition are expanding quickest as gym culture spreads from Johannesburg to Nairobi. Competitive intensity remains moderate, with multinationals clustering around South Africa and Nigeria, and regional startups filling niche gaps in microbial and insect proteins.
Key Report Takeaways
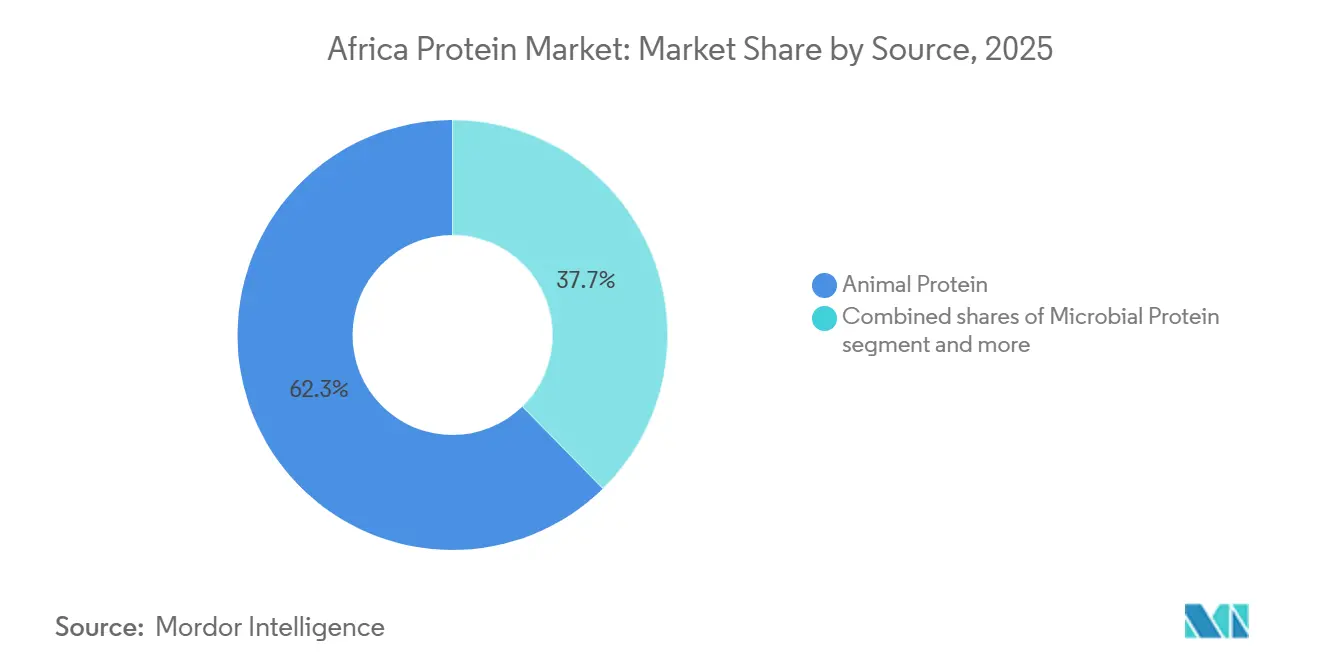
- By source, animal proteins led with 62.34% revenue share in 2025; microbial proteins are the fastest growing, advancing at a 5.03% CAGR through 2031.
- By form, hydrolysates captured 58.67% of the African protein market share in 2025 and are forecast to expand at a 5.67% CAGR to 2031.
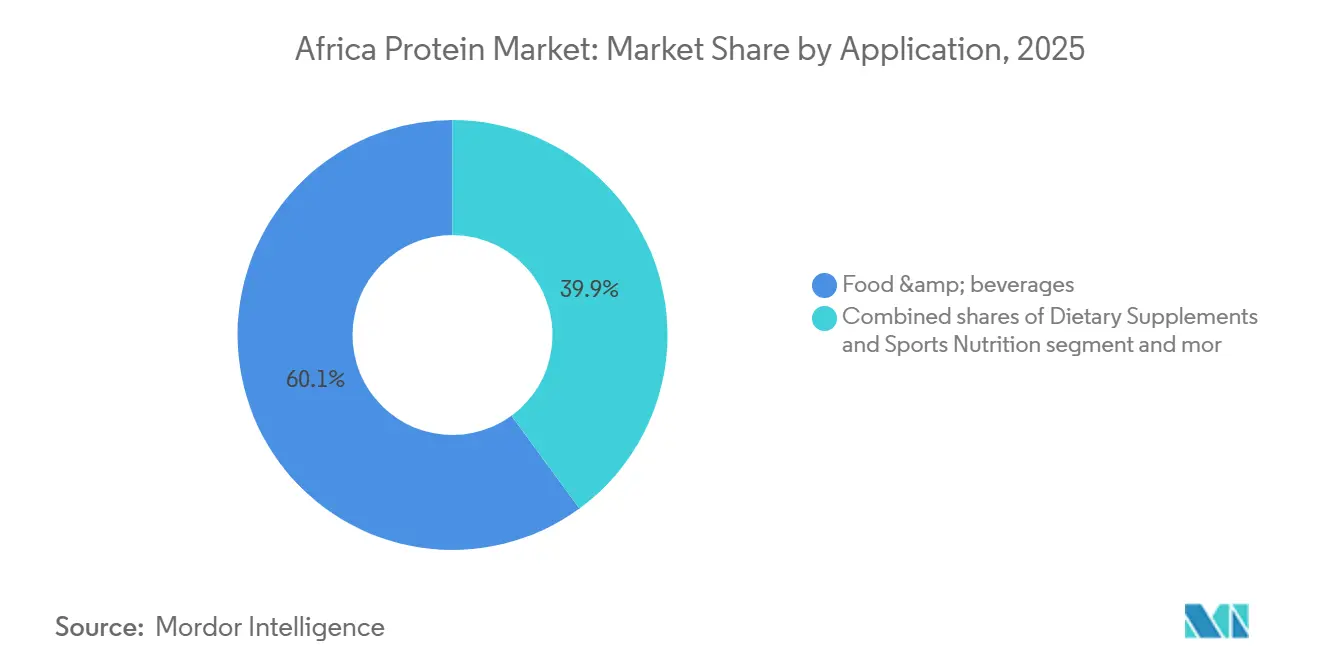
- By application, food and beverages accounted for 60.03% of 2025 consumption, while dietary supplements and sports nutrition recorded the highest CAGR at 6.32% through 2031.
Note: Market size and forecast figures in this report are generated using Mordor Intelligence’s proprietary estimation framework, updated with the latest available data and insights as of January 2026.
Africa Protein Market Trends and Insights
Drivers Impact Analysis*
| Driver | (~) % Impact on CAGR Forecast | Geographic Relevance | Impact Timeline |
|---|---|---|---|
| Growing health consciousness among African consumers | +1.2% | Pan-African, strongest in South Africa, Kenya, and Nigeria urban centers | Medium term (2-4 years) |
| Increasing fitness and sports nutrition trend uptake | +0.8% | South Africa, Kenya, Nigeria, and Egypt metro areas with spillover to secondary cities | Medium term (2-4 years) |
| Expansion of the food and beverage industry usage | +1.5% | Nigeria, South Africa, Egypt, Kenya; emerging in Ghana, Côte d'Ivoire | Short term (≤ 2 years) |
| Technological improvements in protein extraction processes | +0.6% | South Africa and Kenya are production hubs; technology transfer across East and Southern Africa | Long term (≥ 4 years) |
| Demand for clean-label and natural protein ingredients | +0.5% | Urban South Africa, Kenya, Nigeria; gradual adoption in North Africa | Medium term (2-4 years) |
| Increased retail penetration for protein-rich foods | +0.7% | South Africa, Kenya, modern trade; traditional channels in West Africa | Short term (≤ 2 years) |
| Source: Mordor Intelligence | |||
Growing health consciousness among african consumers
Urbanization reached 43% of Africa's population in 2025, creating concentrated markets where nutrition messaging spreads rapidly through digital channels and government health campaigns[1]Source: World Bank, "Global Economy Shows Resilience Amid Historic Uncertainty", worldbank.org . Non-communicable diseases now account for 37% of mortality, prompting ministries in Kenya, South Africa, and Egypt to mandate protein-fortification standards for school feeding programs and subsidized staples[2]Source: WHO (World Health Organization), "Non-Communicable Diseases", who.int. This regulatory push coincides with a consumer shift documented by the Food and Agriculture Organization: households earning above USD 5,000 annually increased protein expenditure by 18% between 2024 and 2025, favoring dairy, eggs, and plant-based alternatives over traditional grain-heavy diets, according to FAO (Food and Agriculture Organization). The insight lies in the velocity of change; urban Nigerians and Kenyans are adopting high-protein breakfast cereals and fortified beverages at rates comparable to Southeast Asian markets a decade earlier, compressing the adoption curve and rewarding first movers with brand loyalty before competition intensifies.
Expansion of the food and beverage industry usage
Multinational and regional food manufacturers allocated billions toward African processing capacity during 2024 and 2025, with protein ingredients playing a key role in product reformulation strategies. Tiger Brands committed ZAR 300 million to establish a peanut butter plant and ZAR 746 million to expand PepsiCo's snack-food operations. Both initiatives incorporated protein-enriched variants to align with retailer shelf requirements for functional nutrition and cater to evolving consumer preferences for health-focused products. This approach aims to secure a stable supply chain and capture additional margins. As a result, spot-market liquidity is expected to decline, with a shift toward long-term offtake agreements replacing transactional procurement practices. This trend reflects a strategic move to mitigate supply chain risks and ensure consistent ingredient availability in a competitive market environment.
Increasing fitness and sports nutrition trend uptake
Gym memberships in South Africa, Kenya, and Nigeria grew year-on-year in 2025, while participation in endurance events such as Hyrox and CrossFit competitions doubled across major cities. This cultural shift is monetized through sports-nutrition retail, where whey protein isolates and ready-to-drink shakes command prominent margins. Myprotein expanded its South African e-commerce and retail footprint in 2024, capitalizing on a segment where brand trust and formulation transparency override price sensitivity among urban millennials. Regulatory frameworks for sports supplements remain nascent. Kenya's Bureau of Standards issued labeling guidelines in 2025, but enforcement is inconsistent, allowing importers and local blenders to operate with minimal compliance costs, a window that will narrow as consumer-protection agencies gain capacity[3]Source: Kenya Bureau of Standards, "Regulatory Frameworks", kebs.org.
Technological improvements in protein extraction processes
Enzymatic hydrolysis and membrane filtration technologies deployed in South African and Kenyan facilities during 2024 and 2025 raised protein yields and reduced water consumption, addressing both cost and sustainability pressures, according to the Journal of Food Science. Precision fermentation pilots in Nairobi and Cape Town are producing microbial proteins with amino-acid profiles comparable to casein, targeting infant-formula and medical-nutrition applications where regulatory barriers favor novel ingredients over animal-derived alternatives in markets with halal or kosher certification requirements. Insect-protein processors such as InsectiPro in Kenya and AgriProtein in South Africa scaled black soldier fly operations to produce protein-content meal at costs below imported fishmeal, capturing aquaculture and poultry-feed segments where price elasticity is high and traceability concerns are lower than in human-food applications.
Restraints Impact Analysis*
| Restraint | (~) % Impact on CAGR Forecast | Geographic Relevance | Impact Timeline |
|---|---|---|---|
| Regulatory hurdles in product registration and labeling | -0.9% | Pan-African, acute in West and Central Africa; improving in South Africa, Kenya | Medium term (2-4 years) |
| Taste and texture concerns in protein products | -0.6% | Consumer markets across Africa, particularly for plant-based and microbial proteins | Short term (≤ 2 years) |
| Weak regulatory standardization across African markets | -0.5% | All regions; fragmentation is highest in West Africa, lowest in Southern Africa | Long term (≥ 4 years) |
| Limited cold storage and transport infrastructure | -0.8% | West Africa, Central Africa, rural areas across all regions | Medium term (2-4 years) |
| Source: Mordor Intelligence | |||
Regulatory hurdles in product registration and labelling
Fragmented approval processes across 54 national jurisdictions impose 12-month to 24-month delays on novel protein ingredients, deterring investment in microbial and plant-based production, according to the African Union. Egypt's National Food Safety Authority requires separate dossiers for each protein source and form, while Nigeria's NAFDAC (National Agency for Food and Drug Administration and Control) applies pharmaceutical-grade scrutiny to dietary supplements, creating compliance costs that exceed USD 200,000 per SKU (Stock-Keeping Unit) for multinationals and are prohibitive for regional startups. This patchwork penalizes scale players who must navigate multiple regimes and rewards nimble local blenders who operate below enforcement thresholds, distorting competitive dynamics and slowing the diffusion of advanced formulations.
Limited cold storage and transport infrastructure
Africa loses a significant portion of food production to post-harvest spoilage, with protein-rich commodities such as dairy, eggs, and fish suffering disproportionate waste due to inadequate refrigeration, according to the World Bank. Nigeria, despite being Africa's largest economy, has cold-storage capacity for less perishable output, forcing processors to over-invest in on-site facilities or accept shrinkage between farm gate and factory. Solar-powered micro-cold-rooms, deployed by ColdHubs in Nigeria and similar ventures in Ghana, reduce losses but require 18-month payback periods that deter smallholder adoption without subsidy. The strategic consequence is geographic concentration: protein-ingredient production clusters near ports and urban centers, widening rural-urban price differentials and limiting the addressable market for premium isolates and hydrolysates that cannot tolerate temperature excursions during last-mile distribution.
*Our forecasts treat driver/restraint impacts as directional, not additive. The impact forecasts reflect baseline growth, mix effects, and variable interactions.
Segment Analysis
By Source: Animal Leads, Microbial Surges
Animal proteins supplied 62.34% of the value in 2025, anchored by whey, casein, and collagen streams from South African, Nigerian, and Egyptian dairy plants. Whey yielded from South African cheese operations reached 180,000 metric tons of liquid in 2025, with converted into concentrates for domestic sports-nutrition brands and exports. Insect meal from black soldier fly larvae is scaling in Kenya and South Africa, reaching maximum protein and selling below fishmeal. Plant proteins occupy a middle ground with soy concentrates feeding meat-alternative and bakery applications, while pea and chickpea isolates stay niche due to import dependence and consumer unfamiliarity.
Microbial proteins still under-index at below the lowest volume, yet they post the highest growth at a 5.03% CAGR, thanks to precision fermentation pilots that circumvent land and water limits. The regulatory climate favors well-established animal proteins under universal CODEX (Codex Alimentarius) rules, while microbial and insect products navigate case-by-case approvals. Kenya’s 2025 insect-protein guideline gave East African players a first-mover advantage, but West Africa remains unregulated, fragmenting opportunities. Animal streams will likely dominate commodity applications on cost and certainty, while microbial and insect categories target premium infant-formula and sustainability-focused brands where price uplifts justify additional regulatory burden.


By Form: Hydrolysates Set the Pace
Hydrolysates held 58.67% share in 2025 and are expanding at 5.67% CAGR, driven by hypoallergenic infant-formula rules and athletes’ demand for rapid absorption. South African and Kenyan enzymatic lines opened in 2025 produce whey and casein hydrolysates through hydrolysis, balancing solubility and bitterness for ready-to-drink beverages. Isolates and concentrates still serve high-volume bakery, meat, and dairy-alternative users who weigh cost over advanced functionality.
Textured proteins and crisps remain minor due to equipment costs and consumer hesitation toward heavily processed formats. Hydrolysate production needs reactors and chromatography columns priced at millions, tilting control toward well-capitalized multinationals, while concentrates can be made with filtration kits in lesser amounts, leaving room for local competitors. This dual structure funnels premium hydrolysates through pharmacies and modern trade at margins, with concentrates flowing via traditional distributors at basic margins.
By Application: Sports Nutrition Accelerates
Food and beverages absorbed 60.03% in 2025, spanning bakery fortification, protein snacks, meat processing, and dairy alternatives. Infant nutrition, though a smaller slice by tonnage, contributed a prominent portion of revenue because hydrolysate-based formulas fetch premiums. Direct-to-consumer channels captured sports-nutrition sales in 2025, up from two years earlier, compressing middle-man margins and favoring digitally native brands. Animal feed, personal care, and cosmetics collectively remain lower, but insect protein in aquaculture is expanding due to competitive pricing.
Dietary supplements and sports nutrition are the fastest application, rising at a 6.32% CAGR, propelled by expanding gym culture and e-commerce that bypasses legacy distribution. Margins are migrating. Food-and-beverage users wrestle with annual price erosion as supermarket chains consolidate bargaining power, while sports nutrition and infant formula sustain double-digit price increases buoyed by functional claims and brand loyalty. Producers are consequently diverting capacity toward higher-margin streams, a trend underscored by Kerry’s Rwanda hydrolysate plant that targets infant-formula clients first.
Competitive Landscape
The Africa protein market exhibits moderate fragmentation. Multinationals like Fonterra, Kerry Group, Cargill, and Lactalis dominate hydrolysates and specialty isolates through established technology and distribution, while regional dairy cooperatives such as Clover, Juhayna, and FrieslandCampina WAMCO capture commodity whey by leveraging local milk pools. Investment themes center on vertical integration and geographic clustering: JBS’s Nigerian complex and Kerry’s South African hub illustrate moves to co-locate extraction with downstream manufacturing, cutting transport times and inventory cycles.
Disruptors include InsectiPro and AgriProtein, which deliver animal-feed protein below fishmeal prices, winning aquaculture and poultry clients sensitive to raw-material costs. Precision-fermentation and enzymatic-hydrolysis patents filed with ARIPO jumped high between 2024 and 2025, with South African and Kenyan innovators focusing on water- and energy-efficient processes. West African processors, constrained by capital and technical skills, mainly import concentrates for blending, leaving functionality and margin advantages to Southern and East African rivals.
The Africa protein market benefits from reduced intra-continental tariffs, averaging low by 2025 after the Continental Free Trade Area launch, but non-tariff barriers still add to landed costs via port delays, divergent labelling, and duplicate tests. Production therefore organizes into hub-and-spoke: South Africa and Egypt serve as primary hydrolysate and isolate nodes, while Nigeria, Kenya, and Ghana focus on concentrates and blends suited to longer lead-times and less stringent cold-chain needs. Emerging territories such as Ethiopia, Tanzania, and Zambia attract pilot investments in chickpea and bambara-groundnut proteins but lack scale infrastructure to exceed volumes before 2028.
Africa Protein Industry Leaders
-
Fonterra Co-operative Group Limited
-
Hilmar Cheese Company Inc.
-
International Flavors & Fragrances, Inc.
-
Kerry Group plc
-
Cargill, Incorporated
- *Disclaimer: Major Players sorted in no particular order

Recent Industry Developments
- August 2024: Global dairy co-operative Fonterra and natural ingredient manufacturer Superbrewed Food have teamed up to boost sustainable food production. The partnership combines Superbrewed’s biomass protein platform with Fonterra’s dairy processing, ingredients, and application expertise to develop additional nutrient-rich, functional biomass protein.
- February 2024: Cargill has signed a commercial agreement that enables it to use and market ENOUGH's proprietary ABUNDA Protein and is also investing in the firm's series C Funding.
- February 2024: Cargill has signed a commercial agreement that enables it to use and market ENOUGH's proprietary ABUNDA Protein and is also investing in the firm's series C Funding.


Africa Protein Market Report Scope
Animal protein is a high-quality, complete protein from sources like meat, fish, eggs, and dairy, meaning it provides all essential amino acids the body needs but can't produce, supporting growth, repair, and overall body function. The Africa protein market is segmented by source (animal, microbial, plant), form (concentrates, isolates, hydrolysates, and other forms), application (animal feed, food and beverages, personal care and cosmetics, and more). The market forecasts are provided in terms of value (USD) and volume (tons).
Source
| Animal | Casein and Caseinates |
| Collagen | |
| Egg Protein | |
| Gelatin | |
| Insect Protein | |
| Milk Protein | |
| Whey Protein | |
| Other Animal Proteins | |
| Microbial | Algae Protein |
| Mycoprotein | |
| Plant | Hemp Protein |
| Pea Protein | |
| Potato Protein | |
| Rice Protein | |
| Soy Protein | |
| Wheat Protein | |
| Other Plant Proteins |
Form
| Concentrates |
| Isolates |
| Hydrolysates |
| Other Forms |
Application
| Food and Beverages | Bakery |
| Beverages | |
| Breakfast Cereals | |
| Condiments/Sauces | |
| Confectionery | |
| Dairy and Dairy Alternative Products | |
| Meat/Poultry/Seafood and Meat Alternative Products | |
| RTE/RTC Food Products | |
| Snacks | |
| Infant Nutrition | |
| Other Food and Beverage Applications | |
| Personal Care and Cosmetics | |
| Animal Feed | |
| Dietary Supplements and Sports Nutrition |
| Source | Animal | Casein and Caseinates |
| Collagen | ||
| Egg Protein | ||
| Gelatin | ||
| Insect Protein | ||
| Milk Protein | ||
| Whey Protein | ||
| Other Animal Proteins | ||
| Microbial | Algae Protein | |
| Mycoprotein | ||
| Plant | Hemp Protein | |
| Pea Protein | ||
| Potato Protein | ||
| Rice Protein | ||
| Soy Protein | ||
| Wheat Protein | ||
| Other Plant Proteins | ||
| Form | Concentrates | |
| Isolates | ||
| Hydrolysates | ||
| Other Forms | ||
| Application | Food and Beverages | Bakery |
| Beverages | ||
| Breakfast Cereals | ||
| Condiments/Sauces | ||
| Confectionery | ||
| Dairy and Dairy Alternative Products | ||
| Meat/Poultry/Seafood and Meat Alternative Products | ||
| RTE/RTC Food Products | ||
| Snacks | ||
| Infant Nutrition | ||
| Other Food and Beverage Applications | ||
| Personal Care and Cosmetics | ||
| Animal Feed | ||
| Dietary Supplements and Sports Nutrition | ||


Market Definition
- End User - The Protein Ingredients Market operates on a B2B basis. Food, Beverages, Supplements, Animal Feed, and Personal Care & Cosmetic manufacturers are considered to be end-consumers in the market studied. The scope excludes manufacturers buying liquid/dry whey to be used for application as a binding agent or thickener or other non-protein applications.
- Penetration Rate - Penetration Rate is defined as the percentage of Protein-Fortified End User Market Volume in the Overall End User Market Volume.
- Average Protein Content - Average protein content is the average protein content present per 100 g of product manufactured by all end-user companies considered under the scope of this report.
- End User Market Volume - End-user market volume is the consolidated volume of all types and forms of end-user products in the country or region.
| Keyword | Definition |
|---|---|
| Alpha-lactalbumin (α-Lactalbumin) | It is a protein that regulates the production of lactose in the milk of almost all mammalian species. |
| Amino acid | It is an organic compound that contains both amino and carboxylic acid functional groups, which are required for the synthesis of body protein and other important nitrogen-containing compounds, such as creatine, peptide hormones, and some neurotransmitters. |
| Blanching | It is the process of briefly heating vegetables with steam or boiling water. |
| BRC | British Retail Consortium |
| Bread improver | It is a flour-based blend of several components with specific functional properties designed to modify dough characteristics and give quality attributes to bread. |
| BSF | Black Soldier Fly |
| Caseinate | It is a substance produced by adding an alkali to acid casein, a derivative of casein. |
| Celiac disease | Celiac disease is an immune reaction to eating gluten, a protein found in wheat, barley, and rye. |
| Colostrum | It is a milky fluid that’s released by mammals that have recently given birth before breast milk production begins. |
| Concentrate | It is the least processed form of protein and has a protein content ranging from 40-90% by weight. |
| Dry protein basis | It refers to the percentage of "pure protein" present in a supplement after the water in it is completely removed through heat. |
| Dry whey | It is the product resulting from drying fresh whey which has been pasteurized and to which nothing has been added as a preservative. |
| Egg protein | It is a mixture of individual proteins, including ovalbumin, ovomucoid, ovoglobulin, conalbumin, vitellin, and vitellenin. |
| Emulsifier | It is a food additive that facilitates the blending of foods that are immiscible with one another, such as oil and water. |
| Enrichment | It is the process of addition of micronutrients that are lost during the processing of the product. |
| ERS | Economic Research Service of the USDA |
| Extrusion | It is the process of forcing soft mixed ingredients through an opening in a perforated plate or die designed to produce the required shape. The extruded food is then cut to a specific size by blades. |
| Fava | Also known as Faba, it is another word for yellow split beans. |
| FDA | Food and Drug Administration |
| Flaking | It is a process in which typically a cereal grain (like corn, wheat, or rice) is broken down into grits, cooked with flavors and syrups, and then pressed into flakes between cooled rollers. |
| Foaming agent | It is a food ingredient that makes it possible to form or maintain a uniform dispersion of a gaseous phase in a liquid or solid food. |
| Foodservice | It refers to the part of the food industry which includes businesses, institutions, and companies which prepare meals outside the home. It includes restaurants, school and hospital cafeterias, catering operations, and many other formats. |
| Fortification | It is the deliberate addition of micronutrients that are not found in them naturally or which are lost during processing, to improve a food product's nutritional value. |
| FSANZ | Food Standards Australia New Zealand |
| FSIS | Food Safety and Inspection Service |
| FSSAI | Food Safety and Standards Authority of India |
| Gelling agent | It is an ingredient that functions as a stabilizer and thickener to provide thickening without stiffness through the formation of gel. |
| GHG | Greenhouse Gas |
| Gluten | It is a family of proteins found in grains, including wheat, rye, spelt, and barley. |
| Hemp | It is a botanical class of Cannabis sativa cultivars grown specifically for industrial or medicinal use. |
| Hydrolysate | It is a form of protein manufactured by exposing the protein to enzymes that can partially break the bonds between the protein's amino acids and break down large, complicated proteins into smaller pieces. Its processing makes it easier and quicker to digest. |
| Hypoallergenic | It refers to a substance that causes fewer allergic reactions. |
| Isolate | It is the purest and most processed form of protein which has undergone separation to obtain a pure protein fraction. It typically contains ≥ 90% of protein by weight. |
| Keratin | It is a protein that helps form hair, nails, and the outer layer of skin. |
| Lactalbumin | It is the albumin contained in milk and obtained from whey. |
| Lactoferrin | It is an iron‑binding glycoprotein that is present in the milk of most mammals. |
| Lupin | It is the yellow legume seeds of the genus Lupinus. |
| Millenial | Also known as Generation Y or Gen Y, it refers to the people born from 1981 to 1996. |
| Monogastric | It refers to an animal with a single-compartmented stomach. Examples of monogastric include humans, poultry, pigs, horses, rabbits, dogs, and cats. Most monogastric are generally unable to digest much cellulose food materials such as grasses. |
| MPC | Milk protein concentrate |
| MPI | Milk protein isolate |
| MSPI | Methylated soy protein isolate |
| Mycoprotein | Mycoprotein is a form of single-cell protein, also known as fungal protein, derived from fungi for human consumption. |
| Nutricosmetics | It is a category of products and ingredients that act as nutritional supplements to care for skin, nails, and hair natural beauty. |
| Osteoporosis | It is a medical condition in which the bones become brittle and fragile from loss of tissue, typically as a result of hormonal changes, or deficiency of calcium or vitamin D. |
| PDCAAS | Protein digestibility-corrected amino acid score (PDCAAS) is a method of evaluating the quality of a protein based on both the amino acid requirements of humans and their ability to digest it. |
| Per-capita consumption of animal protein | It is the average amount of animal protein (such as milk, whey, gelatin, collagen, and egg proteins) that is readily available for consumption by each person in an actual population. |
| Per-capita consumption of plant protein | It is the average amount of plant protein (such as soy, wheat, pea, oat, and hemp proteins) that is readily available for consumption by each person in an actual population. |
| Quorn | It is a microbial protein manufactured using mycoprotein as an ingredient, in which the fungus culture is dried and mixed with egg albumen or potato protein, which acts as a binder, and then is adjusted in texture and pressed into various forms. |
| Ready-to-Cook (RTC) | It refers to food products that include all of the ingredients, where some preparation or cooking is required through a process that is given on the package. |
| Ready-to-Eat (RTE) | It refers to a food product prepared or cooked in advance, with no further cooking or preparation required before being eaten. |
| RTD | Ready-to-Drink |
| RTS | Ready-to-Serve |
| Saturated fat | It is a type of fat in which the fatty acid chains have all single bonds. It is generally considered unhealthy. |
| Sausage | It is a meat product made of finely chopped and seasoned meat, which may be fresh, smoked, or pickled and which is then usually stuffed into a casing. |
| Seitan | It is a plant-based meat substitute made out of wheat gluten. |
| Softgel | It is a gelatin-based capsule with a liquid fill. |
| SPC | Soy protein concentrate |
| SPI | Soy protein isolate |
| Spirulina | It is a biomass of cyanobacteria that can be consumed by humans and animals. |
| Stabilizer | It is an ingredient added to food products to help maintain or enhance their original texture, and physical and chemical characteristics. |
| Supplementation | It is the consumption or provision of concentrated sources of nutrients or other substances that are intended to supplement nutrients in the diet and is intended to correct nutritional deficiencies. |
| Texturant | It is a specific type of food ingredient that is used to control and alter the mouthfeel and texture of food and beverage products. |
| Thickener | It is an ingredient that is used to increase the viscosity of a liquid or dough and make it thicker, without substantially changing its other properties. |
| Trans fat | Also called trans-unsaturated fatty acids or trans fatty acids, it is a type of unsaturated fat that naturally occurs in small amounts in meat. |
| TSP | Textured soy protein |
| TVP | Textured vegetable protein |
| WPC | Whey protein concentrate |
| WPI | Whey protein isolate |


Research Methodology
Mordor Intelligence follows a four-step methodology in all our reports.
- Step-1: Identify Key Variables: The quantifiable key variables (industry and extraneous) pertaining to the specific product segment and country are selected from a group of relevant variables & factors based on desk research & literature review; along with primary expert inputs. These variables are further confirmed through regression modeling (wherever required).
- Step-2: Build a Market Model: In order to build a robust forecasting methodology, the variables and factors identified in Step-1 are tested against available historical market numbers. Through an iterative process, the variables required for market forecast are set and the model is built on the basis of these variables.
- Step-3: Validate and Finalize: In this important step, all market numbers, variables and analyst calls are validated through an extensive network of primary research experts from the market studied. The respondents are selected across levels and functions to generate a holistic picture of the market studied.
- Step-4: Research Outputs: Syndicated Reports, Custom Consulting Assignments, Databases & Subscription Platforms


