
Market Overview
| Study Period | 2020 - 2031 |
|---|---|
| Forecast Data Period | 2026 - 2031 |
| Base Year Market Size (2025) | USD 2.04 Billion |
| Market Size (2026) | USD 2.29 Billion |
| Market Size (2031) | USD 4.1 Billion |
| Growth Rate (2026 - 2031) | 12.32 % |
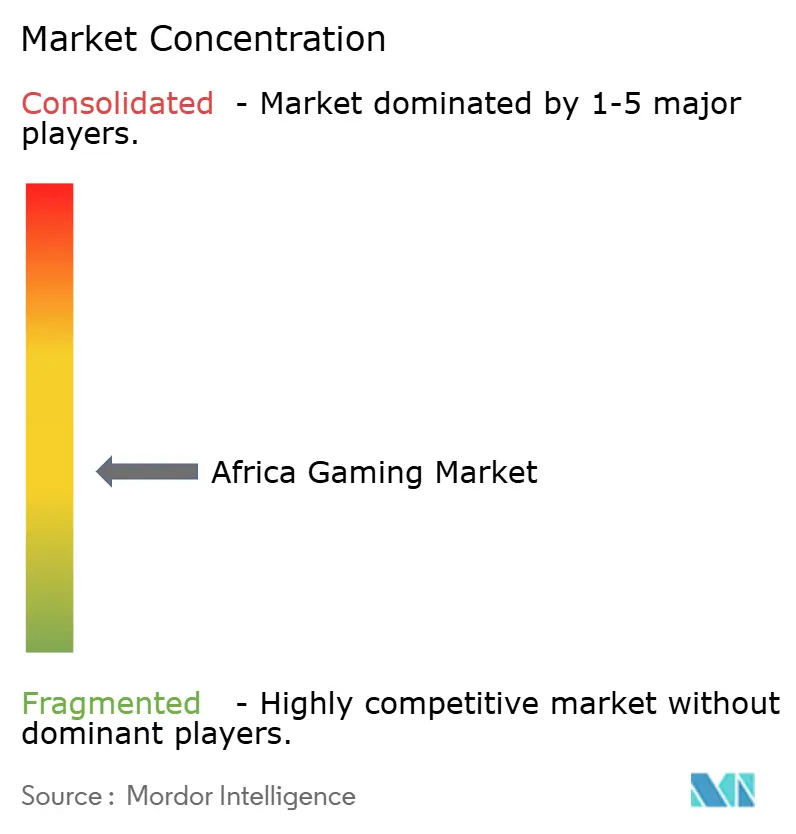
| Market Concentration | Medium |
Major Players
*Disclaimer: Major Players sorted in no particular order Image © Mordor Intelligence. Reuse requires attribution under CC BY 4.0. |
|
Africa Gaming Market Analysis by Mordor Intelligence
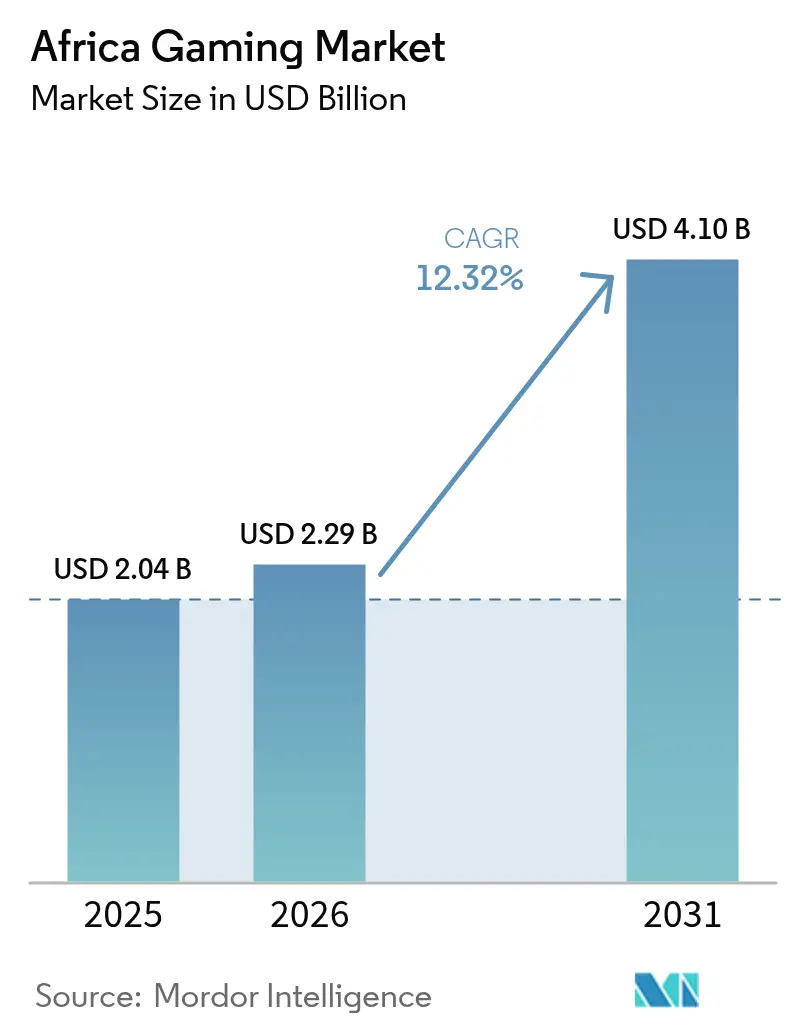
Africa Gaming Market size in 2026 is estimated at USD 2.29 billion, growing from 2025 value of USD 2.04 billion with 2031 projections showing USD 4.10 billion, growing at 12.32% CAGR over 2026-2031.
The ecosystem’s upward curve rests on smartphone ubiquity, fintech-enabled micro-transactions, and expanding edge-data-center capacity that shortens latency for cloud services. Mobile titles already supply nearly 90% of revenue, but cloud delivery is poised to reshape platform dynamics as infrastructure investments from Microsoft, Sony, and regional telcos come online. Local studios capitalize on cultural storytelling to engage first-time gamers, and international publishers reinforce that content pipeline through equity stakes and co-development deals. Regulatory decisions such as South Africa’s decision to drop the 9% excise duty on low-cost handsets underscore policy momentum toward digital inclusion. [1]Paula Gilbert, “South Africa Plans to Stop Import Tax on Low-Cost Smartphones,” connectingafrica.com Headwinds persist in the form of inconsistent power supply, hardware tariffs, and fragmented intellectual-property enforcement, yet momentum in e-sports leagues and fintech innovation offsets many structural risks.
Key Report Takeaways
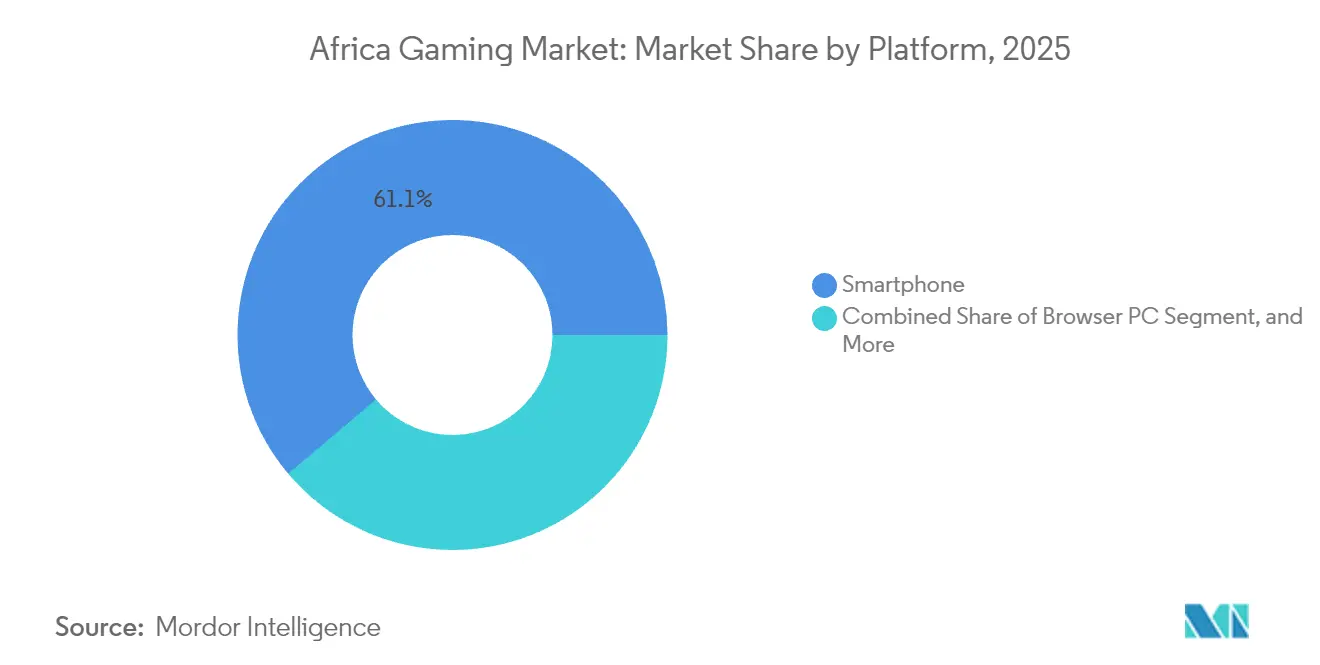
- By platform, smartphones led with 61.15% revenue share of the Africa gaming market in 2025, while cloud gaming is forecast to expand at a 13.72% CAGR through 2031.
- By game genre, action/adventure commanded 33.05% of the Africa gaming market share in 2025, whereas MOBA titles are advancing at a 13.28% CAGR to 2031.
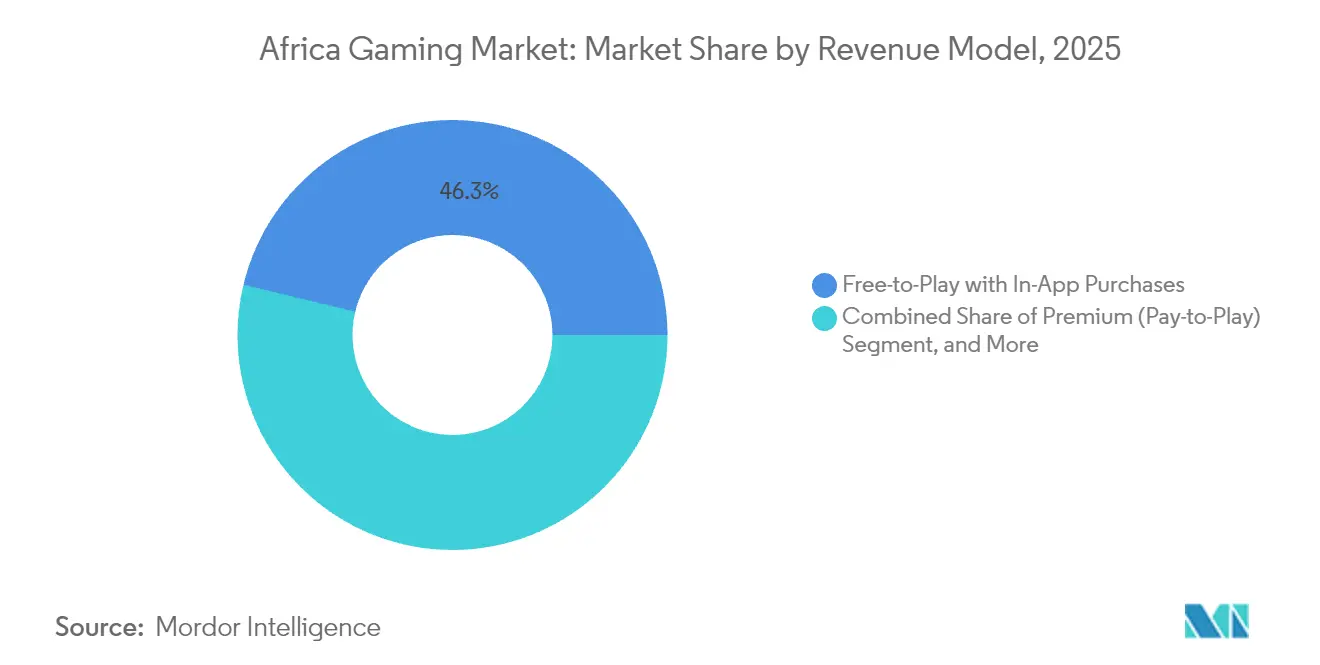
- By revenue model, free-to-play with in-app purchases accounted for 46.25% of the Africa gaming market size in 2025; subscription services are projected to grow at a 13.52% CAGR.
- By gamer demographics, the 18-35 cohort represented 51.85% of gamers of the Africa gaming market in 2025, while the under-18 segment is set to grow at a 13.01% CAGR.
- By country, Nigeria held 27.10% of the 2025 revenue of the Africa gaming market, but Kenya is pacing the region with a 12.96% CAGR outlook.
Note: Market size and forecast figures in this report are generated using Mordor Intelligence’s proprietary estimation framework, updated with the latest available data and insights as of 2026.
Africa Gaming Market Trends and Insights
Drivers Impact Analysis*
| Driver | (~) % Impact on CAGR Forecast | Geographic Relevance | Impact Timeline |
|---|---|---|---|
| Surging smartphone penetration and affordable data plans | +3.2% | Global, with strongest impact in Nigeria, Kenya, Egypt | Medium term (2-4 years) |
| Increasing localisation of content and language support | +1.8% | Nigeria, South Africa, Kenya, Ghana | Long term (≥ 4 years) |
| Expansion of mobile-money and fintech micro-transactions | +2.5% | Kenya, Tanzania, Uganda, Nigeria | Short term (≤ 2 years) |
| Government e-sports initiatives and national leagues | +1.4% | Rwanda, Ghana, Nigeria, South Africa | Medium term (2-4 years) |
| Cloud-gaming infrastructure roll-outs (edge data centres) | +2.1% | South Africa, Nigeria, Kenya, Egypt | Long term (≥ 4 years) |
| Africa-specific ad-tech platforms boosting F2P monetisation | +1.5% | Nigeria, South Africa, Egypt | Short term (≤ 2 years) |
| Source: Mordor Intelligence | |||


Surging Smartphone Penetration and Affordable Data Plans
Shipments climbed 6% year-on-year to 19.4 million units in Q1 2025, with North Africa recording 34% growth. [2]TelecomLead Editors, “Africa's Smartphone Market in Q1-2025 Shows Tentative Optimism,” telecomlead.com TRANSSION continues to command a 47% share, reflecting its mastery of entry-level pricing that aligns with local income levels. More than 95% of the continent’s 349 million gamers play on mobile, reinforcing the platform’s primacy. The proliferation of 4G-enabled phones, 85% of total shipments, elevates user readiness for data-heavy titles. A median age below 20 ensures a pipeline of digital natives that treat mobile gaming as a primary entertainment outlet rather than an occasional pastime.
Increasing Localisation of Content and Language Support
Disney’s “Iwájú” partnership with Nigeria’s Maliyo Games marks a watershed as global IP leans on African storytelling for authenticity. Localization studies show 76% of consumers prefer experiences in their native language, and the continent’s 3,000 cultures make cultural resonance a decisive retention lever. Kiro’o Games’ milestone Xbox launch illustrates the pay-off: culturally grounded titles enjoy longer session times and higher conversion rates. French, Arabic, and Swahili versions widen addressable audiences, while vernacular voice-overs enrich narrative immersion. Studios that master cultural nuance secure stronger monetization metrics and attract cross-media licensing.
Expansion of Mobile-Money and Fintech Micro-Transactions
M-Pesa processed USD 314 billion in annual value for 51 million clients, establishing a continental payment backbone for one-click in-game purchases. Micro-transaction baskets averaging USD 0.25 fit local buying power and vault conversion rates relative to credit-card gateways. M-Pesa’s China link via Thunes unlocks cross-border potential that can extend African IP to Asian gamers. Subscription models benefit too, as consumers become comfortable with recurring mobile debits. Fintech integrations accelerate market entry for overseas publishers, who can launch without traditional banking partnerships.
Government E-Sports Initiatives and National Leagues
Seventeen African federations now belong to the Global Esports Federation, mainstreaming competitive gaming. Ghana’s 2024 federation pact and Rwanda’s dedicated organization offer structured pathways for talent development. Carry1st’s management of Call of Duty: Mobile qualifiers, spanning seven regions with a USD 15,000 purse, signals alignment between local organizers and global circuits. The March 2025 launch of Africa’s dedicated League of Legends server slashes ping times, bolstering spectator appeal. National leagues attract sponsorship from telcos and consumer brands, converting viewership into diversified revenue.
Restraints Impact Analysis*
| Restraint | (~) % Impact on CAGR Forecast | Geographic Relevance | Impact Timeline |
|---|---|---|---|
| High import tariffs on consoles and PC hardware | -2.1% | Kenya, Nigeria, Ghana, with varying impact across markets | Medium term (2-4 years) |
| Persistent electricity reliability issues | -1.8% | South Africa, Nigeria, Ghana, Kenya | Short term (≤ 2 years) |
| Limited local venture funding for studios | -1.3% | Continental, with acute impact in Nigeria, Kenya, Ghana | Long term (≥ 4 years) |
| Patchy enforcement of digital-IP protection laws | -0.9% | Nigeria, Kenya, South Africa, Egypt | Medium term (2-4 years) |
| Source: Mordor Intelligence | |||
High Import Tariffs on Consoles and PC Hardware
Kenya’s 25% duty plus 16% VAT inflates console prices to multiples of the monthly median income, discouraging adoption. [3]Dutify Insights, “Duty and Tax Rates for Video Game Console,” dutify.com South Africa’s zero-duty console policy, but 15% VAT, highlights regional disparities that fragment addressable demand. Tariffs curtail gaming-café rollouts, limiting community hubs for e-sports qualification events. Hardware cost barriers push consumers toward mobile or cloud alternatives, unintentionally accelerating the Africa gaming market’s post-console trajectory. Government leniency on low-cost handsets hints at potential tariff reconsideration for gaming devices, but timelines remain uncertain.
Persistent Electricity Reliability Issues
Load-shedding schedules routinely interrupt gameplay in South Africa, undermining multiplayer retention metrics. Nigerian home users confront generator costs that erode disposable income for in-game purchases. Data-center investors deploy renewable microgrids to mitigate grid instability, yet capital intensity keeps rack rates elevated. Satellite internet providers like Starlink circumvent terrestrial bottlenecks, offering consistent ping but at premium subscription levels. Studio workflows shift to cloud-based development to reduce on-site compute dependency, but outages still extend build cycles and limit release cadence.
*Our forecasts treat driver/restraint impacts as directional, not additive. The impact forecasts reflect baseline growth, mix effects, and variable interactions.
Segment Analysis
By Platform: Mobile Dominance Drives Cloud Transition
Smartphones generated 61.15% of 2025 revenue, underscoring that the Africa gaming market size leans heavily on mobile-first engagement. The Africa gaming market share of smartphones benefits from affordable entry-level devices and zero-rated gaming data offers from telcos. Cloud gaming, however, is scaling fastest at a 13.72% CAGR on the back of hyperscale data-center investment, promising console-grade experiences without hardware imports. Tablets remain niche, catering to educational titles consumed by families. Console uptake lags owing to tariff drag, positioning cloud services as a viable detour around customs costs.
Growth vectors align with telco-OTT bundles that package gaming subscriptions, edge caching that compresses latency, and pay-as-you-go micro-payments that democratize access. Browser PC titles retain traction among urban professionals who game during work breaks, while downloaded PC games confront bandwidth ceilings. As infrastructure matures, cloud platforms may cannibalize high-end PC and console segments, but smartphones will continue to anchor user-acquisition funnels for the Africa gaming market.


By Game Genre: Action Leads, MOBA Accelerates
Action/adventure titles held a 33.05% share in 2025, buoyed by casual control schemes and relatable story arcs drawn from African folklore. MOBA’s projected 13.28% CAGR rides on the March 2025 League of Legends server that removed latency penalties for competitive play. Sports franchises, especially football, sustain consistent monetization through annual roster updates. Shooter/FPS adoption is slower because of high data loads and sociocultural sensitivities to violent themes. Casual puzzle apps excel at onboarding, while simulation games attract mature demographics with strategic depth.
The genre mix illustrates the Africa gaming industry’s maturation: early adopters gravitate to short-session casual play, and rising infrastructure capacity ushers in skill-based competitive formats. Local studios localize mythic narratives, nudging conversion by resonating with cultural archetypes. As competitive gaming prize pools rise, MOBA may overtake action titles in revenue, but action’s evergreen appeal ensures steady floor demand.
By Revenue Model: F2P Dominance, Subscription Growth
Free-to-play with in-app purchases captured 46.25% of the 2025 Africa gaming market size, confirming micro-transaction compatibility with mobile-money wallets. Subscriptions, although only 8.5% of spend, are scaling at 13.52% CAGR, aided by Xbox Game Pass mobile bundles via carrier billing. Premium pay-to-download models face friction from limited card penetration, while in-game advertising fills monetization gaps for non-spenders. E-sports media rights, though nascent, are set to rise as league infrastructures mature.
Developers optimize for lifetime value over upfront sales, segmenting spenders into micro-, mid-, and whale tiers anchored to mobile-money transaction histories. Africa-specific ad-tech unlocks CPM uplift by serving culturally relevant creatives in local languages. As cloud services scale, hybrid models combining subscription access with cosmetic micro-transactions could emerge as the revenue sweet spot for the Africa gaming market.
By Gamer Demographic: Youth Drives, Gen Z Accelerates
The 18-35 cohort provided 51.85% of users and most discretionary spend in 2025, converting cultural nostalgia and competitive pride into sustained ARPDAU. Under-18 gamers, expanding at a 13.01% CAGR, will swell the onboarding pipeline for the next decade, accelerated by smartphone penetration in secondary-school populations. Gamers aged 36-50 favor casual and strategy titles that accommodate intermittent play, while the 50-plus segment remains small but reachable through hyper-casual puzzle apps with large fonts and simple mechanics.
Gender parity trends surface in mature markets such as South Africa, where women now account for 46% of gamers. As younger cohorts age into higher income brackets, their ingrained gaming habits will compound revenue growth. Esports scholarships and STEM-aligned serious games further normalize gaming among parents and educators, opening additional demographic slices.
Geography Analysis
Nigeria delivered USD 553 million in 2025 revenue on the strength of its 220 million-person population and fintech prowess that eases micro-transaction flows. Telecommunications operators bundle zero-rated gaming traffic, deepening engagement even during inflationary cycles. The Nigeria Copyright Commission’s stepped-up IP enforcement foreshadows a friendlier climate for premium launches.
South Africa houses 26.5 million players, a 44% penetration rate that reflects robust broadband and a developer base of roughly 60 studios. Mobile games account for 91% of spend, yet console and PC niches flourish amid higher disposable incomes. Elimination of the 9% handset excise duty in April 2025 further broadens the funnel for entry-level consumers.
Kenya’s 12.96% CAGR stems from the world’s most sophisticated mobile-money network, M-Pesa, and impending hyperscale cloud capacity under the Microsoft-G42 USD 1 billion plan. Regulatory clarity from the Betting Control and Licensing Board enhances investor confidence in game launches. Egypt, leveraging its 111 million residents and cross-regional cultural influence, dominated the USD 0.61 billion 2025 market tally. Algeria and Ghana round out the next cohort, supported by telco fiber roll-outs and nascent e-sports programs. Rest-of-Africa markets such as Rwanda and Tanzania combine youth demographics with policy enthusiasm for digital skilling, setting the stage for second-wave adoption across the Africa gaming market.
Regulatory Landscape
Gaming demand in the Central African Republic is shaped more by telecom and media rules than by gaming-specific legislation. ARCEP (Autorite de Regulation des Communications Electroniques et de la Poste), established under Law 17.020 (2017) and operating within the 2018 Electronic Communications Act, oversees licensing, spectrum, and service-quality compliance. In April 2024, ARCEP deployed new digital monitoring infrastructure to track network performance and internet speeds in real time, which improves enforceability of QoS obligations relevant to latency-sensitive mobile and cloud gaming.
Content and communications oversight falls under the Haut Conseil de la Communication (HCC), with a mandate grounded in Law No 17.006 (2017) and the 2020 Law on Freedom of Communication. Across 2026, the country does not have a specialized authority or a comprehensive licensing framework for gambling (including online), which limits the ability of regulated real-money gaming operators to enter with clear consumer protections and defined compliance pathways. Broader digital inclusion policies still affect device affordability and connectivity expansion.
Value Chain Analysis
The Central African Republic gaming value chain starts with connectivity and access devices, since usage is predominantly mobile-led and depends on operator coverage and data affordability. International bandwidth and domestic backhaul are increasingly linked to fiber projects such as the Central African Backbone (CAB-RCA), launched in 2024 with cross-border fiber links to Cameroon and the Republic of Congo. With internet penetration of about 12.0% by late 2025 (around 670,000 users) and 2.07 million active cellular connections at the start of 2025, distribution is concentrated in urban corridors, while rural reach is limited by infrastructure gaps.
On the supply side, content creation includes local entertainment creators and studios leveraging global engines and platforms. Monetization flows primarily through mobile payments and platform billing rather than card rails. Distribution is routed through app stores and social platforms, and creators also use channels such as YouTube and TikTok to reach audiences where local media infrastructure remains thin. Key constraints include power reliability, network resilience, and regulatory uncertainty around media operations, which can raise operating costs for live-service titles, esports activations, and always-on community management.
Competitive Landscape
The Africa gaming market hosts a mix of bootstrapped studios and multinational heavyweights in a moderately fragmented setting. Carry1st’s USD 27 million Series C, anchored by Sony, demonstrates an appetite for platform publishers that marry fintech integration with culturally tuned hits. Disney’s co-development pact with Maliyo Games underscores global IP’s reliance on local narrative expertise. [4]Jeffrey Rousseau, “Carry1st Receives Investment From Sony,” gamesindustry.biz
International entrants prefer partnership and investment approaches over direct greenfield competition, hedging against regulatory complexity while tapping ready-made cultural insights. Telcos strike content-plus-data bundles with publishers, and satellite providers like Starlink position connectivity as a competitive moat for premium live-service experiences.
Meanwhile, regional independents like Nyamakop and Kiro’o Games leverage government grants and cross-platform engines such as Unity to ship globally viable IP. Competitive advantage pivots on mobile-money integration, localization depth, and community management rather than photorealistic graphics. Overall, the top five revenue-generating companies command roughly 35% combined share, keeping acquisition chatter active but leaving runway for newcomers.
Africa Gaming Industry Leaders
-
Carry1st (Pty) Ltd.
-
Maliyo Games Ltd.
-
Leti Arts Ltd.
-
Kucheza Gaming Ltd.
-
Gamesole Ltd.
- *Disclaimer: Major Players sorted in no particular order

Market Opportunities and Future Outlook
A near-term opportunity centers on expanding the addressable base through connectivity programs and infrastructure upgrades that lower friction for downloading and updating games. ARCEP earmarked a 2026 budget of CFA 6.2 billion (about USD 11.2 million) to operationalize a universal service fund for nationwide telecom access expansion, and the National Development Plan (PND 2024-2028) explicitly prioritizes digital economy promotion and infrastructure resilience. For publishers and platforms, that creates whitespace for lightweight mobile titles, offline-first progression systems, and patching strategies designed for low and intermittent bandwidth environments.
Public-sector digitalization efforts also support adoption by improving access to digital identities, payments, and citizen-facing services. The Ministry of Economy, Planning and International Cooperation launched the Duni a digital platform in February 2026 to unify government project data, pointing to continued institutional focus on digital transformation. At the same time, fiber sabotage incidents reported in March 2026 on the Bangui-Boali and Carnot-Berberati segments highlight the operational need for redundancy and caching, which supports partnerships among telcos, CDNs, and cloud gaming providers around edge distribution, resilience planning, and localized content delivery in the Central African Republic.
Recent Industry Developments
- March 2026: Central African authorities reported sabotage incidents on key fiber-optic segments (including Bangui-Boali and Carnot-Berberati), disrupting telecom and internet services. The event highlighted operational risk for latency-sensitive gaming and always-on live-service models, increasing the importance of redundancy, edge caching, and resilient routing in country-level rollout plans.
- July 2025: NIP Group created a Digital Computing Division through a crypto-mining hardware acquisition to help finance its esports ecosystem. The move signaled a push toward vertically aligned compute and competitive-gaming operations, which can influence tournament hosting capacity and regional esports content production economics.
- February 2024: Masseka Game Studio launched The Legend of Mulu on The Sandbox, positioning it as an African-themed experience on the creator platform. The release showed how African studios can use global UGC ecosystems for distribution and discovery, supporting monetization of culturally rooted IP beyond local infrastructure constraints.


Research Methodology Framework and Report Scope
Market Definition and Coverage
This market covers money earned from video games across Africa, counted in USD, across consumer play on mobile devices, PCs, consoles, and cloud gaming. Revenues reflect what gamers and advertisers pay through common game monetization routes.
Scope exclusions: Gambling and betting, gaming hardware sales, and live streaming creator income are not counted in this market value.
Segmentation Overview
-
By Platform
- Browser PC
- Downloaded/Box PC
- Gaming Console
- Smartphone
- Tablet
- Cloud Gaming
-
By Game Genre
- Action/Adventure
- Sports
- Shooter/FPS
- MOBA
- Casual/Puzzle
- Simulation/Strategy
-
By Revenue Model
- Premium (Pay-to-Play)
- Free-to-Play with In-App Purchases
- Subscription (Game Pass, Apple Arcade etc.)
- In-Game Advertising
- Esports Media and Sponsorship
-
By Gamer Demographics
- Age <18
- Age 18-35
- Age 36-50
- Age >50
-
By Country
- Nigeria
- South Africa
- Egypt
- Kenya
- Algeria
- Rest of Africa
Data Sources, Market Sizing, and Validation
Desk Research
Desk research starts by building a fact base on connectivity, payments, and the gamer pool, since those variables drive gaming spend in Africa. We typically rely on public sources such as ITU connectivity indicators, World Bank population and income series, GSMA Mobile Economy releases, IMF exchange rate time series, and regulator or ministry updates on digital payments and telecom licensing.
After the core indicators are set, we review secondary materials to refine which revenue streams matter most and how quickly they are shifting. This includes app store policy pages, public developer ecosystem notes, company annual reports and investor decks for listed publishers and telecom groups active in the region, and reputable press coverage of game launches and pricing changes. For cross-checks on company scale and patent activity, we also use paid subscriptions for company financials and patent databases where they add clarity. These examples are illustrative only, and other public sources were reviewed to collect data, validate assumptions, and clarify open questions.
Primary Interviews and Surveys
Primary work is used to pressure test the desk assumptions on gamer spending behavior, ad monetization, and payment success rates, which can vary significantly by country. We speak with regional ecosystem participants such as game studios, publishers, payment enablers, telecom-linked distribution partners, and advertising buyers, and then we re-check the findings with experienced country-level operators across Africa before locking the model.
Distribution of primary research fieldwork respondents
| Company type | Respondent position |
|---|---|
| Top tier: 34% | CXOs: 15% |
| Mid tier: 50% | Functional/Unit leaders: 36% |
| Smaller Players: 16% | Managers: 49% |
Market-Sizing & Forecasting
Sizing is anchored in a top-down build where the demand pool is reconstructed from the active gamer base and expected monetization, then adjusted country by country for affordability and payment access. In practice, we connect population and smartphone penetration with internet coverage, apply platform-mix assumptions, and estimate how much revenue can be generated in each covered year based on the paying share.
To keep totals realistic, we corroborate the output using selective bottom-up checks, such as sampled app store revenue signals, publisher revenue disclosures tied to Africa, and channel checks on typical spending per payer. Where company reporting is not detailed for Africa, gaps are handled using regional splits validated in interviews and conservative allocation rules across the covered countries.
For forecasting, scenario analysis is used so the range is tied to variables that experts can explain and track. Key inputs include smartphone adoption trends, 4G and 5G rollout pace, mobile money and card payment success rates, ad load and CPM direction for mobile games, and shifts in platform mix between mobile, PC, console, and cloud. We also monitor policy signals that can change pricing or access, for example, digital tax changes or updates in payment regulation, and then we update scenarios accordingly.
Data Validation & Update Cycle
Validation is done in layers so single-source bias does not creep into the final numbers. The team compares model outputs with independent signals such as gamer population growth, connectivity and payment adoption trends, and the implied revenue per paying user, which helps flag totals that look too high or too low.
When outliers show up, assumptions are revisited, and targeted follow-ups are triggered to re-check country mixes, pricing, and monetization rates. Before sign-off, a separate analyst reviews the spreadsheet logic and key inputs, followed by a final pass that checks currency conversion timing and year labeling. Reports are refreshed annually, and interim updates are made when major market events materially change demand signals or monetization conditions.
Mordor Intelligence's Africa Gaming Market Size Compared With Other Published Estimates
Published market values for Africa gaming can differ widely, even when analysts are discussing the same region. Differences usually come from what revenue streams are counted, which countries are emphasized, and how mobile-led monetization is converted into USD across a changing currency environment.
Gambling and betting revenues sit outside Mordor Intelligence's scope, and that exclusion can materially change the total in a region where wagering apps are sometimes discussed alongside games. Other gaps come from how mobile advertising is treated (gross versus net), whether cloud gaming is counted as part of gaming revenue, and whether a single year is reported as an actual value or as an estimate built from partial platform signals.
Benchmark comparison
| Source | Market Size | Gaps in Research Methodology |
|---|---|---|
| Mordor Intelligence | USD 2.04 B (2025) | |
| Trade Journal A | USD 1.80 B (2024) | Often presented as a headline Africa total tied to mobile led reporting and selective country examples, with limited visibility on whether figures are net of platform fees, ad revenue treatment, or platform coverage beyond mobile. |
| Industry Report B | USD 1.00 B (2024) | May skew toward mobile app economy revenue signals and in-app purchase style measures, which can undercount console and PC revenues and can also miss cloud gaming where it is still early. |
The spread in the table mainly reflects scope choices and how incomplete revenue signals are scaled to a full continent view. By anchoring the model to clear demand indicators and then checking the results with country-level interviews and platform-mix logic, we keep the estimate repeatable and easier to audit when inputs change year to year.


Key Questions Answered in the Report
How large is the Africa gaming market in 2026?
The Africa gaming market size stands at USD 2.29 billion in 2026 and is projected to reach USD 4.10 billion by 2031.
Which platform generates most gaming revenue across Africa?
Smartphones contribute 61.15% of total 2025 revenue, reflecting Africa’s mobile-first digital landscape.
What factors drive cloud-gaming adoption on the continent?
Hyperscale data-center investment, edge nodes that cut latency, and tariff-free access to premium content fuel a 13.72% CAGR for cloud gaming.
Which country represents the fastest-growing opportunity?
Kenya leads growth with a 12.96% CAGR forecast through 2031, supported by advanced mobile-money ecosystems and new cloud infrastructure.
Which revenue model is scaling most quickly?
Subscription services are growing at 13.52% CAGR, propelled by carrier-billed bundles that remove payment friction.
What is the main regulatory challenge for publishers?
Divergent import tariffs and inconsistent IP enforcement remain significant hurdles, trimming the sector’s CAGR by an estimated 2.1 percentage points.
Page last updated on:




