Market Overview
| Study Period | 2017 - 2030 |
|---|---|
| Forecast Data Period | 2025 - 2030 |
| Historical Data Period | 2017 - 2023 |
| Market Size (2025) | USD 1.85 Billion |
| Market Size (2030) | USD 2.15 Billion |
| Growth Rate (2025 - 2030) | 3.20% CAGR |
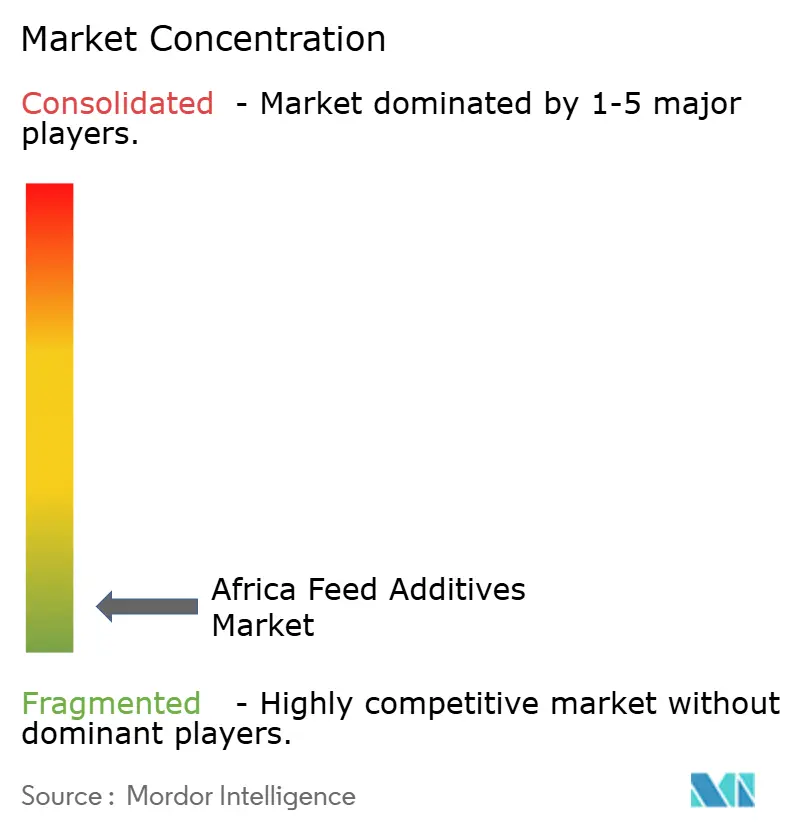
| Market Concentration | Low |
Major Players*Disclaimer: Major Players sorted in no particular order Image © Mordor Intelligence. Reuse requires attribution under CC BY 4.0. | |

Africa Feed Additives Market Analysis by Mordor Intelligence
The Africa feed additives market size stands at USD 1.85 billion in 2025 and is forecast to reach USD 2.15 billion by 2030, translating into a 3.2% CAGR across the period. The measured pace reflects an industry balancing traditional husbandry with modern feed-mill investments, widening access to formulated rations, and stricter health standards. Demand concentrates in South Africa, yet East and West Africa increasingly shape growth through new compound-feed facilities, expanded poultry output, and rising aquaculture ventures. Consolidation among the players remains limited, where the largest five suppliers hold less than 20% of the market, so distribution reach, technical service, and local manufacturing continue to outweigh sheer scale when capturing share. Gains also hinge on toxin-binder uptake after the 2024 aflatoxin crisis, plus regulatory pressure that pushes producers toward probiotic and enzyme alternatives to antibiotics.
Key Report Takeaways
- By additive, amino acids led with 24.8% of the Africa feed additives market share in 2024, while antioxidants are projected to register the fastest 3.5% CAGR through 2030.
- By animal, poultry accounted for 55.2% of the Africa feed additives market size in 2024, whereas swine consumption is poised to expand at 3.8% CAGR between 2025 and 2030.
- By geography, South Africa commanded 46.3% revenue share in 2024, and is projected to post the highest regional CAGR of 3.7% through 2030.
Africa Feed Additives Market Trends and Insights
Drivers Impact Analysis*
| Driver | (~) % Impact on CAGR Forecast | Geographic Relevance | Impact Timeline |
|---|---|---|---|
| Surge in compound-feed mills across East and West Africa | +0.8% | East Africa, West Africa, Nigeria, Kenya | Medium term (2-4 years) |
| Tightening antibiotic-usage regulations propel demand for alternatives | +0.6% | Global, with strongest impact in South Africa, Kenya | Short term (≤ 2 years) |
| Rapid growth of quick-service-restaurant poultry chains | +0.4% | Urban centers across Africa, Nigeria, South Africa, Kenya | Medium term (2-4 years) |
| Mycotoxin outbreaks intensify adoption of toxin-binders | +0.5% | West Africa, East Africa, maize-growing regions | Short term (≤ 2 years) |
| AfCFTA-driven cross-border livestock trade | +0.3% | SADC, ECOWAS, EAC regions | Long term (≥ 4 years) |
| Venture-capital funding for insect-protein and precision-fermented additives | +0.2% | Kenya, South Africa, Ghana, Nigeria | Long term (≥ 4 years) |
| Source: Mordor Intelligence | |||
Surge in Compound-Feed Mills Across East and West Africa
The proliferation of mid-scale compound feed mills represents a structural shift from traditional grain-based feeding toward formulated nutrition, creating sustained demand for specialized additives. De Heus commissioned a 200,000 metric tons capacity facility in Kenya's Athi River with operations beginning in H2 2025, while simultaneously opening a 100,000 metric tons aquafeed plant in Uganda's Njeru district. This infrastructure buildout reduces unit production costs through economies of scale while expanding geographic reach for additive suppliers previously constrained by import logistics. Noutchogouin Group's CFA 5 billion (USD 8.3 million) automated facility in Cameroon targets regional export markets, including Chad and the Central African Republic, and exemplifies the shift to modern multi-species feed production. The expansion creates predictable, high-volume offtake channels for premix suppliers and specialized additives, fundamentally altering market access dynamics across the continent. Premier Feed Mills' 370,000 metric tons Eastern facility in Calabar demonstrates the scale potential, with capacity to produce three different feed types simultaneously while sourcing from over 150,000 Nigerian farmers.
Tightening Antibiotic-Usage Regulations Propel Demand for Alternatives
Post-2024 regulatory frameworks increasingly restrict prophylactic antibiotic use in livestock production, creating immediate substitution demand for probiotics, prebiotics, organic acids, and enzyme-based growth promoters. South Africa's implementation of stricter veterinary medicine protocols through the SADC Zazibona Initiative establishes joint assessment pathways for alternative products, reducing registration timelines to 12 months maximum across participating countries including Botswana, Tanzania, Zambia, and Zimbabwe. This regulatory harmonization accelerates market access for manufacturers of antibiotic alternatives while creating larger addressable markets through mutual recognition agreements. Kenya's feed cost policy analysis reveals growing acceptance of enzyme supplementation to improve nutrient utilization efficiency, offsetting higher additive costs through enhanced feed conversion ratios. The regulatory shift coincides with consumer pressure for antibiotic-free animal protein, particularly in export-oriented poultry and aquaculture operations serving European and Middle Eastern markets. Morocco's August 2024 notification to the WTO regarding new animal feed additive registration processes signals broader continental alignment with international food safety standards.
Rapid Growth of Quick-Service-Restaurant Poultry Chains
The expansion of international and regional quick-service restaurant chains drives standardized broiler production requirements, necessitating consistent feed quality and performance additives to meet uniform meat specifications. KFC's aggressive African expansion strategy requires reliable poultry supply chains with predictable growth rates, feed conversion efficiency, and meat quality parameters achievable only through specialized additive programs. Eclosia's cross-regional poultry operations expansion shows that industrial-scale production creates concentrated demand for performance-enhancing additives, including amino acid balancers, enzyme complexes, and gut health promoters. This demand concentration enables additive suppliers to justify dedicated production lines and technical service investments previously uneconomical for fragmented smallholder markets. The QSR-driven standardization extends beyond nutrition to encompass food safety protocols, creating opportunities for mycotoxin binders, pathogen control additives, and traceability-enabled premix systems. Regional QSR chains like Chicken Inn leverage local supply advantages while maintaining international quality standards, creating hybrid demand patterns that favor both global additive brands and locally-adapted formulations.
Mycotoxin Outbreaks Intensify Adoption of Toxin-Binders
The 2024 aflatoxin crisis in West and East African maize harvests triggered widespread adoption of mycotoxin detoxification technologies, transforming binder additives from optional to essential feed components. Nigeria's record aflatoxin contamination levels in stored maize forced feed mills to implement systematic testing and mitigation protocols, driving demand for clay-based binders, yeast cell wall derivatives, and enzymatic detoxification products. The FAO's Codex Alimentarius guidance on feed hazard prioritization specifically emphasizes mycotoxin monitoring and mitigation, providing regulatory framework for mandatory binder inclusion in high-risk regions. Kemin Industries' mycotoxin management solutions gained significant traction in Nigerian poultry operations, where producers experienced measurable performance improvements following binder implementation in contaminated feed batches. The crisis demonstrated the economic value proposition of preventive mycotoxin management, with producers calculating that binder costs represent minimal insurance against potentially devastating flock losses. Climate change projections indicate increasing mycotoxin risk across traditional maize-growing regions, suggesting sustained structural demand for detoxification additives rather than cyclical crisis response.
Restraints Impact Analysis*
| Restraint | (~) % Impact on CAGR Forecast | Geographic Relevance | Impact Timeline |
|---|---|---|---|
| Volatile maize and soy prices squeeze feed margins | -0.7% | Global, with highest impact in import-dependent regions | Short term (≤ 2 years) |
| Under-developed cold-chain logistics for liquid additives | -0.4% | Rural areas across Africa, particularly East and West Africa | Medium term (2-4 years) |
| Counterfeit and sub-standard premixes in informal markets | -0.3% | Nigeria, Kenya, informal trading networks | Medium term (2-4 years) |
| High import tariffs on specialty enzymes | -0.2% | Countries with protective trade policies | Short term (≤ 2 years) |
| Source: Mordor Intelligence | |||
Volatile Maize and Soy Prices Squeeze Feed Margins
Feed ingredient price volatility creates margin compression that forces producers to delay or eliminate additive purchases, particularly for performance-enhancing rather than essential nutritional components. The South African rand's depreciation of over 60% against the USD over the past decade amplifies import cost volatility for soybean meal and specialized amino acids, creating unpredictable input costs that constrain additive budgets. Mintec's global feed additive pricing analysis reveals methionine price fluctuations exceeding 40% annually, driven by supply disruptions and freight cost variations that directly impact African importers dependent on Asian and European suppliers. Feed mills respond to margin pressure by reformulating with cheaper alternatives or reducing additive inclusion rates, compromising animal performance and creating negative feedback loops that undermine additive value propositions. The price volatility particularly affects smaller feed producers lacking hedging capabilities or bulk purchasing power, creating market segmentation where only larger operations maintain consistent additive programs during price spikes.[2]Source: Journal of Transport and Supply Chain Management, “Feed Industry Disruptions,” jtscm.co.za
Under-developed Cold-Chain Logistics for Liquid Additives
The absence of reliable refrigerated transport and storage infrastructure limits market penetration for temperature-sensitive liquid enzymes, probiotics, and organic acid blends that offer superior bioavailability compared to dry alternatives. Rural feed mills and farms lack cold storage facilities necessary for liquid additive inventory management, forcing reliance on less effective but shelf-stable powder formulations. The logistics constraint is particularly acute for aquaculture operations in remote locations where liquid enzyme systems could significantly improve feed conversion efficiency but remain inaccessible due to temperature control requirements. Unitrans Supply Chain Solutions' achievement of 100% AFMA Transport Protocol compliance demonstrates the infrastructure investments required for safe feed additive distribution, including specialized cleaning regimes, biosecurity processes, and temperature monitoring systems. The cold-chain gap creates competitive disadvantages for liquid additive suppliers while limiting producer access to potentially superior nutrition technologies, perpetuating reliance on traditional dry formulations with inherent efficacy limitations.
*Our forecasts treat driver/restraint impacts as directional, not additive. The impact forecasts reflect baseline growth, mix effects, and variable interactions.
Segment Analysis
By Additive: Amino Acids Drive Protein Optimization
Amino acids command 24.8% market share in 2024, reflecting their fundamental role in optimizing protein utilization across poultry and swine operations where feed costs represent 60-70% of total production expenses. The segment's dominance stems from methionine and lysine supplementation programs that enable least-cost feed formulation while maintaining animal performance standards required by commercial producers. Antioxidants emerge as the fastest-growing additive category at 3.5% CAGR through 2025-2030, driven by mycotoxin management imperatives and increasing awareness of oxidative stress impacts on animal health and meat quality. Vitamins maintain steady demand at approximately 18% market share, particularly fat-soluble vitamins A, D, and E essential for immune function and reproductive performance in tropical climates.
Enzymes capture growing market attention through their ability to unlock nutrients from locally-available feed ingredients, reducing dependence on expensive imported proteins while improving sustainability metrics increasingly important to export-oriented producers. Probiotics and prebiotics gain traction as antibiotic alternatives, though adoption remains concentrated among larger commercial operations with technical expertise to implement effective gut health programs. Minerals, binders, and acidifiers serve specialized functions in specific production systems, with binders experiencing surge demand following 2024 mycotoxin outbreaks across maize-growing regions. The regulatory influence of SADC (Southern African Development Community) veterinary medicine harmonization creates standardized approval pathways for innovative additive formulations, potentially accelerating adoption of next-generation products including precision-fermented amino acids and targeted enzyme complexes.


By Animal Type: Poultry Dominance Faces Aquaculture Challenge
Poultry operations consume 55.2% of feed additives in 2024, driven by broiler production expansion to meet protein demand from urbanizing populations and quick-service restaurant growth across major African cities. The segment's additive intensity reflects commercial poultry's sophisticated nutrition requirements, including amino acid balancing, enzyme supplementation, and gut health management programs essential for competitive feed conversion ratios. Swine represents the fastest-growing animal segment at 3.8% CAGR through 2025-2030, supported by commercial pig farming modernization in South Africa's Western Cape and Nigeria's emerging pork industry targeting urban consumers. Ruminants maintain traditional feeding patterns with limited additive adoption outside commercial dairy operations, though mineral supplementation gains acceptance for addressing deficiencies in natural pastures.
Aquaculture emerges as a high-growth opportunity despite small current market share, with specialized feed mills like De Heus' Uganda facility and Unga Holdings' Kenya plant demonstrating sector potential. Victory Farms' USD 35 million funding for East African aquaculture expansion signals investor confidence in fish farming scalability, creating concentrated demand for specialized additives including digestibility enhancers and water quality management products. The regulatory compliance requirements for aquaculture exports to European markets drive adoption of sophisticated additive programs including organic trace minerals and natural growth promoters. Other animals, including small ruminants and rabbits, offer niche opportunities where targeted nutrition programs can deliver measurable performance gains, but market fragmentation limits commercial additive development for these species.

Geography Analysis
South Africa retained 46.3% of revenue in 2024 and will likely post a 3.7% CAGR through 2030. Its extensive feed-mill grid and strict quality audits enable advanced additive programs. In July 2024, Nutreco’s acquisition of African Explosives and Chemical Industries (AECI) Animal Health secured storage and technical labs that accelerate new-product trials. The country's robust distribution network and strong presence of international feed additive manufacturers have contributed to market growth.
Kenya’s strategic position as a regional hub for East African trade has strengthened its role in the feed additives market by enabling efficient distribution across neighboring countries. The market is also witnessing rising adoption of feed probiotics and enzymes, driven by increasing awareness of gut health in animal nutrition. Additionally, the country’s expanding commercial livestock sector is boosting demand for performance-enhancing additives that support higher productivity and disease resilience.
Rising investments in modern feed milling technologies are helping improve efficiency and consistency in feed formulations across the rest of Africa. Nigeria’s growing pig and layer complexes, supported by Premier Feed Mills’ 670,000 metric tons production network. Local feed manufacturers across these countries are increasingly partnering with international suppliers to enhance product quality and technical capabilities. [3]Source: DSM-Firmenich, “Premix Plant in Egypt,” dsm-firmenich.com
Competitive Landscape
The Africa feed additives market remains highly fragmented, with the top five suppliers controlling less than 20% of the market. Adisseo holds leadership through methionine supply and Durban staging hubs. Nutreco N.V. leverages its 2024 AECI Animal Health acquisition to deepen distribution into feedlots and dairy clusters. Archer-Daniels-Midland Company integrates premix lines with regional grain origination. BASF SE, Evonik Industries AG, and Kemin Industries, Inc. each hold a niche position, focusing on antioxidants, specialty enzymes, or toxin-binding portfolios.
Strategic moves favor local production. In September 2024, DSM-Firmenich invested USD 15 million in Egypt to shorten lead times and customize mineral-vitamin packs. Royal De Heus pursues a network approach, tying additive supply to its mills in Kenya, Uganda, and Nigeria. Suppliers increasingly add remote advisory apps for gut-health monitoring, letting smallholders adjust additive rates via smartphone. The market has witnessed significant merger and acquisition activities as companies seek to strengthen their product portfolios and geographical presence.
Global players are increasingly focusing on strategic partnerships with local distributors and manufacturers to enhance their market reach and understanding of regional requirements. This trend of consolidation is particularly evident in key markets like South Africa and Egypt, where companies are establishing strong operational bases to serve the broader African market. The focus on research and development capabilities has also enabled the companies to introduce advanced feed additive solutions while maintaining competitive pricing strategies.[3]Source: Wigmore Wholesale, “Premier Feed Mills Profile,” wigmorewholesale.com
Africa Feed Additives Industry Leaders
Adisseo
Archer Daniel Midland Co.
DSM Nutritional Products AG
Evonik Industries AG
SHV (Nutreco NV)
- *Disclaimer: Major Players sorted in no particular order

Recent Industry Developments
- September 2025: Olam Agri pledged USD 200 million to build Ghana’s first large-scale fish-feed campus, including extrusion, raw-material silos, and cold-chain warehouses. The project aligns with the government plan to raise fish self-sufficiency to 70% by 2030 and creates 1,200 direct jobs.
- September 2025: De Heus inaugurated a 100,000 metric ton aquafeed facility in Njeru, Uganda, featuring biomass boilers that cut diesel use by 60% and a program sourcing maize from 15,000 farmers.
- May 2025: Unga Holdings started Kenya’s first commercial floating-fish-feed line at KES 225 million (USD 1.76 million), targeting tilapia cages along Lake Victoria and promising 20% feed-conversion gains.


Africa Feed Additives Market Report Scope
Additive
| Acidifiers | By Sub Additive | Fumaric Acid |
| Lactic Acid | ||
| Propionic Acid | ||
| Other Acidifiers | ||
| Amino Acids | By Sub Additive | Lysine |
| Methionine | ||
| Threonine | ||
| Tryptophan | ||
| Other Amino Acids | ||
| Antibiotics | By Sub Additive | Bacitracin |
| Penicillins | ||
| Tetracyclines | ||
| Tylosin | ||
| Other Antibiotics | ||
| Antioxidants | By Sub Additive | Butylated Hydroxyanisole (BHA) |
| Butylated Hydroxytoluene (BHT) | ||
| Citric Acid | ||
| Ethoxyquin | ||
| Propyl Gallate | ||
| Tocopherols | ||
| Other Antioxidants | ||
| Binders | By Sub Additive | Natural Binders |
| Synthetic Binders | ||
| Enzymes | By Sub Additive | Carbohydrases |
| Phytases | ||
| Other Enzymes | ||
| Flavors & Sweeteners | By Sub Additive | Flavors |
| Sweeteners | ||
| Minerals | By Sub Additive | Macrominerals |
| Microminerals | ||
| Mycotoxin Detoxifiers | By Sub Additive | Binders |
| Biotransformers | ||
| Phytogenics | By Sub Additive | Essential Oil |
| Herbs & Spices | ||
| Other Phytogenics | ||
| Pigments | By Sub Additive | Carotenoids |
| Curcumin & Spirulina | ||
| Prebiotics | By Sub Additive | Fructo Oligosaccharides |
| Galacto Oligosaccharides | ||
| Inulin | ||
| Lactulose | ||
| Mannan Oligosaccharides | ||
| Xylo Oligosaccharides | ||
| Other Prebiotics | ||
| Probiotics | By Sub Additive | Bifidobacteria |
| Enterococcus | ||
| Lactobacilli | ||
| Pediococcus | ||
| Streptococcus | ||
| Other Probiotics | ||
| Vitamins | By Sub Additive | Vitamin A |
| Vitamin B | ||
| Vitamin C | ||
| Vitamin E | ||
| Other Vitamins | ||
| Yeast | By Sub Additive | Live Yeast |
| Selenium Yeast | ||
| Spent Yeast | ||
| Torula Dried Yeast | ||
| Whey Yeast | ||
| Yeast Derivatives |
By Animal
| Aquaculture | By Sub Animal | Fish |
| Shrimp | ||
| Other Aquaculture Species | ||
| Poultry | By Sub Animal | Broiler |
| Layer | ||
| Other Poultry Birds | ||
| Ruminants | By Sub Animal | Beef Cattle |
| Dairy Cattle | ||
| Other Ruminants | ||
| Swine | ||
| Other Animals |
By Country
| Egypt |
| Kenya |
| South Africa |
| Rest of Africa |
| Additive | Acidifiers | By Sub Additive | Fumaric Acid |
| Lactic Acid | |||
| Propionic Acid | |||
| Other Acidifiers | |||
| Amino Acids | By Sub Additive | Lysine | |
| Methionine | |||
| Threonine | |||
| Tryptophan | |||
| Other Amino Acids | |||
| Antibiotics | By Sub Additive | Bacitracin | |
| Penicillins | |||
| Tetracyclines | |||
| Tylosin | |||
| Other Antibiotics | |||
| Antioxidants | By Sub Additive | Butylated Hydroxyanisole (BHA) | |
| Butylated Hydroxytoluene (BHT) | |||
| Citric Acid | |||
| Ethoxyquin | |||
| Propyl Gallate | |||
| Tocopherols | |||
| Other Antioxidants | |||
| Binders | By Sub Additive | Natural Binders | |
| Synthetic Binders | |||
| Enzymes | By Sub Additive | Carbohydrases | |
| Phytases | |||
| Other Enzymes | |||
| Flavors & Sweeteners | By Sub Additive | Flavors | |
| Sweeteners | |||
| Minerals | By Sub Additive | Macrominerals | |
| Microminerals | |||
| Mycotoxin Detoxifiers | By Sub Additive | Binders | |
| Biotransformers | |||
| Phytogenics | By Sub Additive | Essential Oil | |
| Herbs & Spices | |||
| Other Phytogenics | |||
| Pigments | By Sub Additive | Carotenoids | |
| Curcumin & Spirulina | |||
| Prebiotics | By Sub Additive | Fructo Oligosaccharides | |
| Galacto Oligosaccharides | |||
| Inulin | |||
| Lactulose | |||
| Mannan Oligosaccharides | |||
| Xylo Oligosaccharides | |||
| Other Prebiotics | |||
| Probiotics | By Sub Additive | Bifidobacteria | |
| Enterococcus | |||
| Lactobacilli | |||
| Pediococcus | |||
| Streptococcus | |||
| Other Probiotics | |||
| Vitamins | By Sub Additive | Vitamin A | |
| Vitamin B | |||
| Vitamin C | |||
| Vitamin E | |||
| Other Vitamins | |||
| Yeast | By Sub Additive | Live Yeast | |
| Selenium Yeast | |||
| Spent Yeast | |||
| Torula Dried Yeast | |||
| Whey Yeast | |||
| Yeast Derivatives | |||
| By Animal | Aquaculture | By Sub Animal | Fish |
| Shrimp | |||
| Other Aquaculture Species | |||
| Poultry | By Sub Animal | Broiler | |
| Layer | |||
| Other Poultry Birds | |||
| Ruminants | By Sub Animal | Beef Cattle | |
| Dairy Cattle | |||
| Other Ruminants | |||
| Swine | |||
| Other Animals | |||
| By Country | Egypt | ||
| Kenya | |||
| South Africa | |||
| Rest of Africa | |||


Market Definition
- FUNCTIONS - For the study, feed additives are considered to be commercially manufactured products that are used to enhance characteristics such as weight gain, feed conversion ratio, and feed intake when fed in appropriate proportions.
- RESELLERS - Companies engaged in reselling feed additives without value addition have been excluded from the market scope, to avoid double counting.
- END CONSUMERS - Compound feed manufacturers are considered to be end-consumers in the market studied. The scope excludes farmers buying feed additives to be used directly as supplements or premixes.
- INTERNAL COMPANY CONSUMPTION - Companies engaged in the production of compound feed as well as the manufacturing of feed additives are part of the study. However, while estimating the market sizes, the internal consumption of feed additives by such companies has been excluded.
| Keyword | Definition |
|---|---|
| Feed additives | Feed additives are products used in animal nutrition for purposes of improving the quality of feed and the quality of food from animal origin, or to improve the animals’ performance and health. |
| Probiotics | Probiotics are microorganisms introduced into the body for their beneficial qualities. (It maintains or restores beneficial bacteria to the gut). |
| Antibiotics | Antibiotic is a drug that is specifically used to inhibit the growth of bacteria. |
| Prebiotics | A non-digestible food ingredient that promotes the growth of beneficial microorganisms in the intestines. |
| Antioxidants | Antioxidants are compounds that inhibit oxidation, a chemical reaction that produces free radicals. |
| Phytogenics | Phytogenics are a group of natural and non-antibiotic growth promoters derived from herbs, spices, essential oils, and oleoresins. |
| Vitamins | Vitamins are organic compounds, which are required for normal growth and maintenance of the body. |
| Metabolism | A chemical process that occurs within a living organism in order to maintain life. |
| Amino acids | Amino acids are the building blocks of proteins and play an important role in metabolic pathways. |
| Enzymes | Enzyme is a substance that acts as a catalyst to bring about a specific biochemical reaction. |
| Anti-microbial resistance | The ability of a microorganism to resist the effects of an antimicrobial agent. |
| Anti-microbial | Destroying or inhibiting the growth of microorganisms. |
| Osmotic balance | It is a process of maintaining salt and water balance across membranes within the body's fluids. |
| Bacteriocin | Bacteriocins are the toxins produced by bacteria to inhibit the growth of similar or closely related bacterial strains. |
| Biohydrogenation | It is a process that occurs in the rumen of an animal in which bacteria convert unsaturated fatty acids (USFA) to saturated fatty acids (SFA). |
| Oxidative rancidity | It is a reaction of fatty acids with oxygen, which generally causes unpleasant odors in animals. To prevent these, antioxidants were added. |
| Mycotoxicosis | Any condition or disease caused by fungal toxins, mainly due to contamination of animal feed with mycotoxins. |
| Mycotoxins | Mycotoxins are toxin compounds that are naturally produced by certain types of molds (fungi). |
| Feed Probiotics | Microbial feed supplements positively affect gastrointestinal microbial balance. |
| Probiotic yeast | Feed yeast (single-cell fungi) and other fungi used as probiotics. |
| Feed enzymes | They are used to supplement digestive enzymes in an animal’s stomach to break down food. Enzymes also ensure that meat and egg production is improved. |
| Mycotoxin detoxifiers | They are used to prevent fungal growth and to stop any harmful mold from being absorbed in the gut and blood. |
| Feed antibiotics | They are used both for the prevention and treatment of diseases but also for rapid growth and development. |
| Feed antioxidants | They are used to protect the deterioration of other feed nutrients in the feed such as fats, vitamins, pigments, and flavoring agents, thus providing nutrient security to the animals. |
| Feed phytogenics | Phytogenics are natural substances, added to livestock feed to promote growth, aid in digestion, and act as anti-microbial agents. |
| Feed vitamins | They are used to maintain the normal physiological function and normal growth and development of animals. |
| Feed flavors and sweetners | These flavors and sweeteners help to mask tastes and odors during changes in additives or medications and make them ideal for animal diets undergoing transition. |
| Feed acidifiers | Animal feed acidifiers are organic acids incorporated into the feed for nutritional or preservative purposes. Acidifiers enhance congestion and microbiological balance in the alimentary and digestive tracts of livestock. |
| Feed minerals | Feed minerals play an important role in the regular dietary requirements of animal feed. |
| Feed binders | Feed binders are the binding agents used in the manufacture of safe animal feed products. It enhances the taste of food and prolongs the storage period of the feed. |
| Key Terms | Abbreviation |
| LSDV | Lumpy Skin Disease Virus |
| ASF | African Swine Fever |
| GPA | Growth Promoter Antibiotics |
| NSP | Non-Starch Polysaccharides |
| PUFA | Polyunsaturated Fatty Acid |
| Afs | Aflatoxins |
| AGP | Antibiotic Growth Promoters |
| FAO | The Food And Agriculture Organization of the United Nations |
| USDA | The United States Department of Agriculture |


Research Methodology
Mordor Intelligence follows a four-step methodology in all our reports.
- Step-1: IDENTIFY KEY VARIABLES: In order to build a robust forecasting methodology, the variables and factors identified in Step-1 are tested against available historical market numbers. Through an iterative process, the variables required for market forecast are set and the model is built on the basis of these variables.
- Step-2: Build a Market Model: Market-size estimations for the forecast years are in nominal terms. Inflation is not a part of the pricing, and the average selling price (ASP) is kept constant throughout the forecast period.
- Step-3: Validate and Finalize: In this important step, all market numbers, variables and analyst calls are validated through an extensive network of primary research experts from the market studied. The respondents are selected across levels and functions to generate a holistic picture of the market studied.
- Step-4: Research Outputs: Syndicated Reports, Custom Consulting Assignments, Databases & Subscription Platforms


