Market Overview
| Study Period | 2020 - 2030 |
|---|---|
| Forecast Data Period | 2025 - 2030 |
| Historical Data Period | 2020 - 2023 |
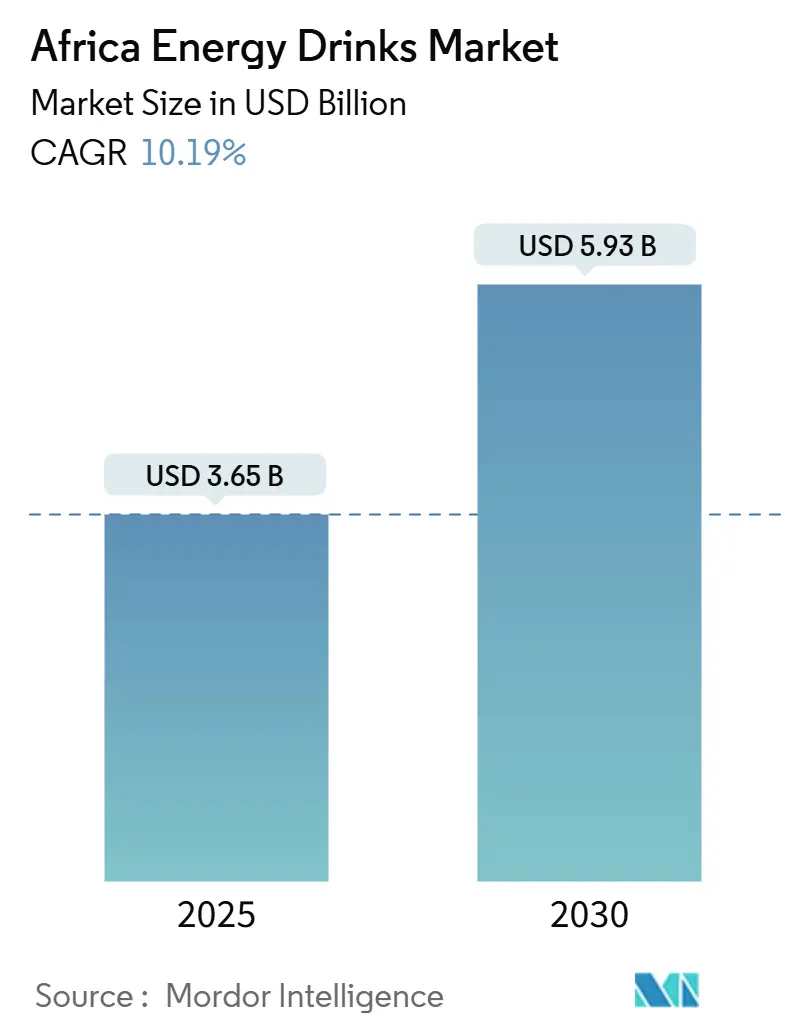
| Market Size (2025) | USD 3.65 Billion |
| Market Size (2030) | USD 5.93 Billion |
| Growth Rate (2025 - 2030) | 10.19% CAGR |
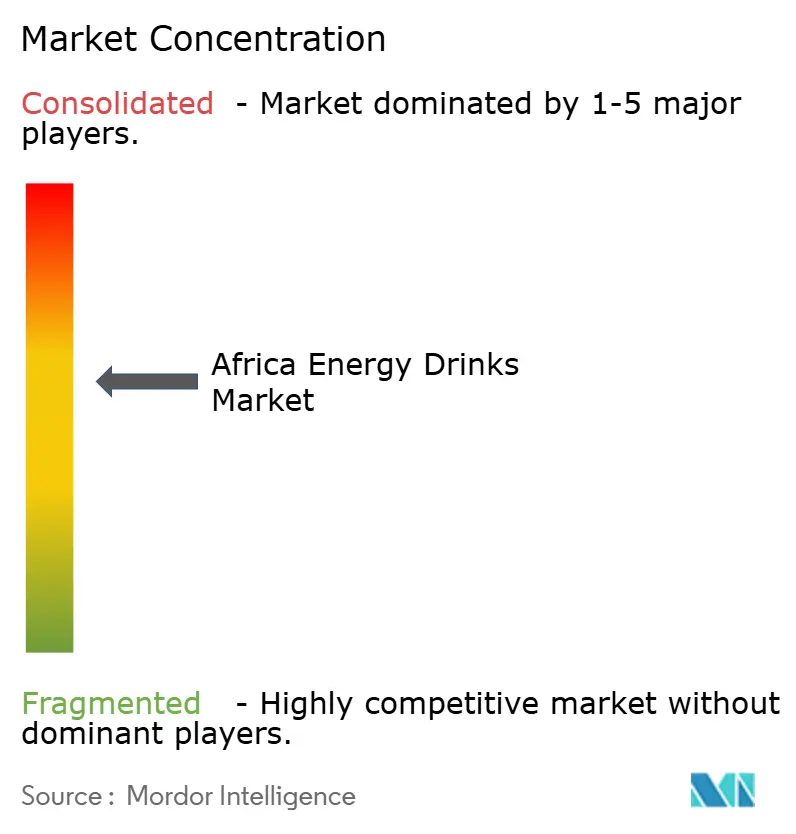
| Market Concentration | Medium |
Major Players *Disclaimer: Major Players sorted in no particular order Image © Mordor Intelligence. Reuse requires attribution under CC BY 4.0. | |
Africa Energy Drinks Market Analysis by Mordor Intelligence
The Africa energy drinks market is valued at USD 3.65 billion in 2025 and is forecast to reach USD 5.93 billion by 2030, expanding at a compound annual growth rate (CAGR) of 10.19% during 2025-2030. This growth is driven by several factors, including increasing urbanization, which is reshaping consumption patterns, the emergence of a fitness-oriented culture boosting demand for performance-focused beverages, and significant investments by multinational brands to establish strong distribution networks. For instance, in September 2024, the Coca-Cola system committed USD 1 billion to Nigeria over five years, contingent on achieving growth targets, reflecting confidence in the region's demographic potential despite regulatory and competitive challenges.
Key Report Takeaways
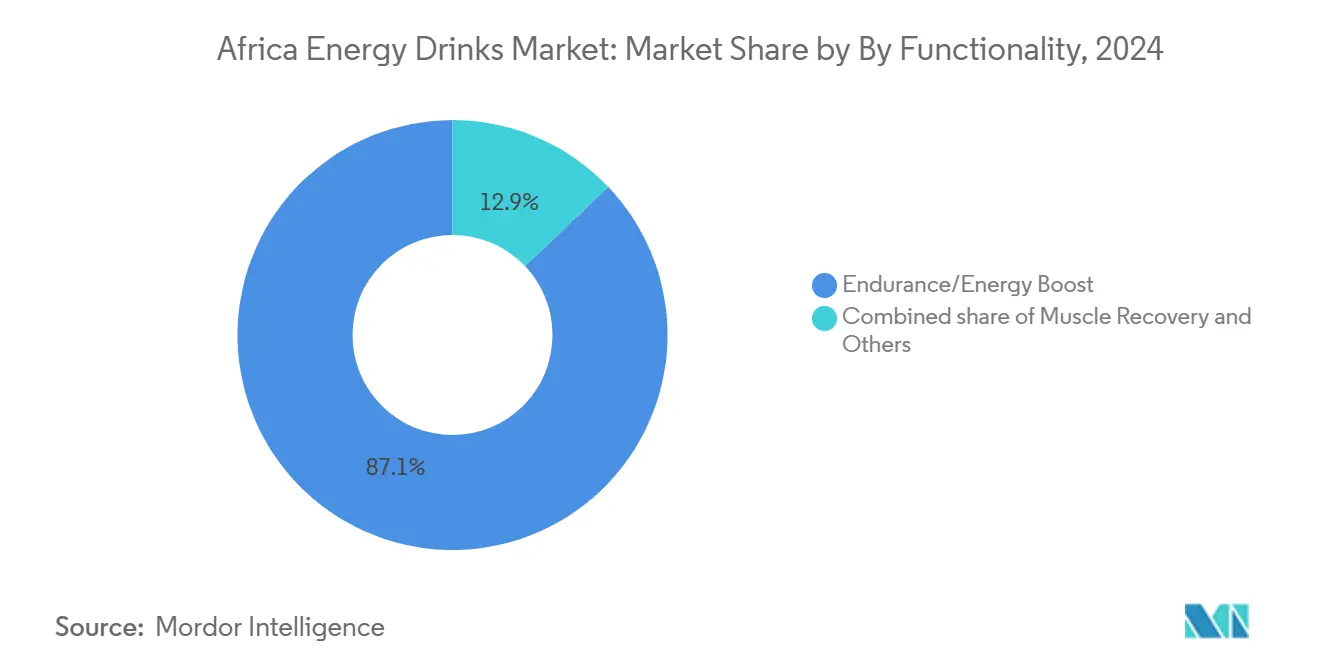
- By functionality, endurance/energy-boost drinks held 87.11% of the Africa energy drinks market share in 2024, while muscle recovery drinks are forecast to post an 11.56% CAGR through 2030.
- By packaging, metal cans commanded 57.04% of the Africa energy drinks market size in 2024; glass bottles are projected to grow fastest at a 14.21% CAGR to 2030
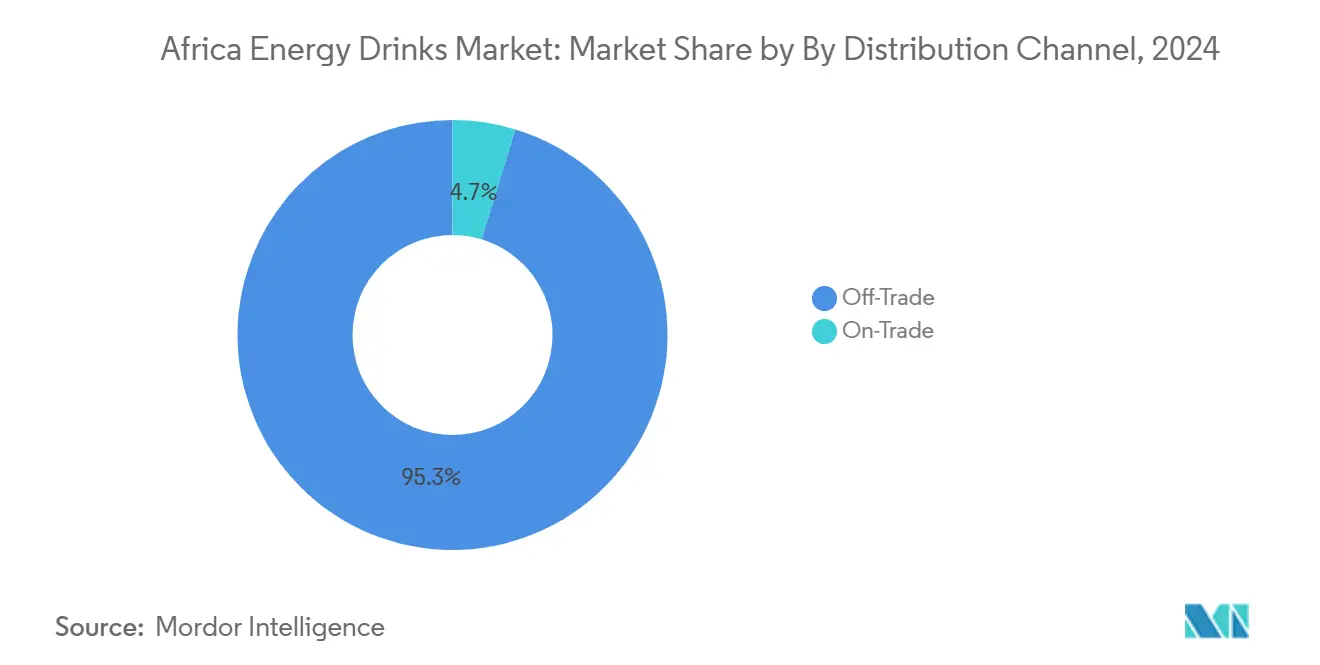
- By channel, off-trade accounted for 95.28% of 2024 sales, whereas on-trade venues are set to expand at a 12.67% CAGR over 2025-2030
- By country, South Africa led with 39.08% revenue share in 2024, while Nigeria is tracking the highest national CAGR at 14.53% through 2030
Africa Energy Drinks Market Trends and Insights
Drivers Impact Analysis*
| Driver | (~) % Impact on CAGR Forecast | Geographic Relevance | Impact Timeline |
|---|---|---|---|
| Rapid urbanization shifting lifestyles toward on-the-go consumption | +2.3% | Highest intensity in Nigeria, Kenya, Egypt | Long term (≥ 4 years) |
| Rising fitness and sports activities increasing demand for performance boosters | +1.6% | South Africa, Kenya, urban centers across Nigeria and Egypt | Medium term (2-4 years) |
| Product innovations like sugar-free and natural variants appealing to health trends | +1.9% | South Africa, Egypt, urban Nigeria | Medium term (2-4 years) |
| Growth in gym memberships and active urban routines | +1.1% | South Africa, Kenya, select Nigerian cities (Lagos, Abuja) | Long term (≥ 4 years) |
| Diverse flavors and packaging attracting varied consumer preferences | +1.4% | Premium formats in South Africa, value packs in Nigeria | Short term (≤ 2 years) |
| Aggressive marketing via celebrity endorsements and sports sponsorships | +1.5% | South Africa, Nigeria, Kenya | Short term (≤ 2 years) |
| Source: Mordor Intelligence | |||


Rapid urbanization shifting lifestyles toward on-the-go consumption
Urbanization is altering meal patterns and extending commute times, driving demand for portable energy solutions that accommodate fragmented daily schedules. Africa's urban population is growing rapidly. According to the "Africa’s Urbanisation Dynamics 2025" report by the Organisation for Economic Co-operation and Development, Africa’s urban population is projected to double over the next three decades, rising from 700 million to 1.4 billion by 2050. This growth will make Africa the continent with the second-largest urban population, following Asia [1]Source: Organisation for Economic Co-operation and Development, “Africa's Urbanisation Dynamics 2025,” oecd.org. This demographic tilt matters because younger cohorts treat energy drinks as lifestyle accessories rather than functional supplements, driving repeat purchases and brand loyalty. The shift also favors single-serve formats and impulse channels.
Growth in gym memberships and active urban routines
Gym penetration remains low across most of Africa; however, urban hubs are experiencing significant growth as aspirational consumers associate fitness with social status. Afrofit, a Kenyan fitness chain, opened its fourth club in Kisumu in December 2024 and is expanding through franchising across East Africa, targeting markets in Tanzania, Rwanda, and Uganda. In South Africa, the sports nutrition market is projected to grow rapidly, with energy drinks gaining market share from traditional protein powders due to consumer preference for ready-to-drink convenience. The muscle-recovery segment is expected to grow at a faster rate than endurance-focused products, as gym-goers increasingly prioritize post-workout replenishment and are willing to pay a premium for functional ingredients such as BCAAs and electrolytes. Brands that integrate sampling and educational initiatives within fitness centers can foster product trials and build customer loyalty before retail competition intensifies.
Product innovations like sugar-free and natural variants appealing to health trends
Sugar-free and natural-ingredient options are expanding as brands address health advocacy and regulatory demands. In July 2024, Switch Energy Drink introduced two new flavors in its Vita C range aimed at immune support: Blueberry & Raspberry and Sugar-Free Vita C Immune Support in Goji Berry and Starfruit. These additions cater to health-conscious consumers, marking the first sugar-free option in the Vita C range. The introduction of these flavors reflects the growing demand for beverages that align with healthier lifestyles, offering consumers the benefits of immune support without compromising on taste. The Sugar-Free Vita C Immune Support variant, in particular, is designed to appeal to individuals seeking low-calorie, sugar-free alternatives while still enjoying unique and refreshing flavors. This provides flavorful choices without added sugar for customers prioritizing health. In Africa, price sensitivity remains a critical consideration, and reformulation efforts must balance maintaining taste quality with avoiding cost increases. Brands operating in the region must carefully navigate these challenges to ensure that healthier product offerings remain accessible and appealing to the price-conscious consumer base.
Aggressive marketing via celebrity endorsements and sports sponsorships
Marketing expenditures are increasingly directed toward experiential activations and influencer collaborations to navigate the challenges of traditional media fragmentation. In March 2025, Red Bull became the official energy drink of Nile Breweries in Uganda, integrating the brand into distribution networks that serve bars, restaurants, and retail outlets. This partnership allows Red Bull to enhance its visibility and accessibility in key consumption spaces, aligning with consumer habits and preferences in the region. In South Africa, brands such as MoFaya and Knox Hydrate have utilized celebrity endorsements to establish credibility among youth audiences, who often view energy drinks as social symbols rather than functional beverages. These endorsements leverage the influence of prominent figures to create aspirational value for the products, resonating with younger demographics. Additionally, sponsorships of music festivals and sports events provide high-visibility engagement opportunities. These events attract large, diverse audiences, offering brands a platform to showcase their products in dynamic and interactive settings, thereby fostering stronger brand associations and consumer loyalty.
Restraints Impact Analysis*
| Restraint | (~) % Impact on CAGR Forecast | Geographic Relevance | Impact Timeline |
|---|---|---|---|
| Health concerns over high caffeine and sugar leading to negative perceptions | -0.9% | Highest intensity in South Africa, Egypt | Short term (≤ 2 years) |
| Competition from soft drinks and traditional beverages like teas and juices | -0.7% | Particularly Nigeria, Kenya, Egypt | Medium term (2-4 years) |
| Sugar and caffeine taxation and regulation risk | -1.0% | South Africa (active), Egypt (imminent), potential spread to Nigeria, Kenya | Short term (≤ 2 years) |
| Inconsistent regulations on labeling and ingredients across countries | -0.6% | Pan-African, affecting cross-border brands | Long term (≥ 4 years) |
| Source: Mordor Intelligence | |||
Health concerns over high caffeine and sugar leading to negative perceptions
Caffeine and sugar content remain flashpoints for public-health advocates and regulators. The World Health Organization and World Bank issued guidance in 20255 urging governments to implement sugar-sweetened beverage taxes as part of broader non-communicable disease prevention strategies [2]Source: World Health Organization, “AWHO launches bold push to raise health taxes and save millions of lives,” who.int. Egypt's National Food Safety Authority introduced evidence-based requirements for caffeinated energy drinks in 2024 [3]Source: National Food Safety Authority of Egypt, “CAFFEINATED ENERGY DRINKS IN EGYPT-A Risk Assessment Approach,” gforss.org, and the government plans to levy VAT on sugar-sweetened products in fiscal year 2025-2026, potentially raising retail prices and dampening demand [4]Source: Ministry of Finance, Arab Republic of Egypt, “Egyptian Tax Authority: No VAT on sugar in the new budget,” mof.gov.eg. South Africa’s 2018 Health Promotion Levy introduced a tax on sugary beverages, with the tax amount determined by the sugar content in each drink. This study is the first to evaluate the impact of the South African tax on sugar and caloric intake. Researchers analyzed the nutritional data from the purchases of over 3,000 households before and after the tax implementation to identify changes in daily sugar intake, calorie consumption, and the volume of taxed and non-taxed beverages purchased. The findings revealed a 52% reduction in calorie consumption, a 51% reduction in sugar intake, and a 29% decrease in the volume of beverages purchased per person per day after the tax was enacted [5]Source: Gillings School of Global Public Health, “South African beverage tax has reduced purchases of sugar-sweetened beverages,” sph.unc.edu.
Inconsistent regulations on labeling and ingredients across countries
Labeling standards, caffeine limits, and age-restriction policies vary widely across African markets, forcing brands to maintain multiple SKU variants and navigate country-specific approval processes. Egypt's NFSA requirements, South Africa's HPL, and Nigeria's NAFDAC guidelines each impose distinct thresholds and documentation burdens. This fragmentation disadvantages smaller brands that lack regulatory affairs teams and favors multinationals with scale to absorb compliance overhead. The absence of mutual recognition agreements means that a product approved in one country may require re-testing and re-labeling for adjacent markets, delaying launches and inflating costs. Regional harmonization initiatives under the African Continental Free Trade Area could eventually streamline standards, but progress remains slow. In the interim, brands must prioritize high-volume markets and accept that pan-African distribution will remain inefficient.
*Our forecasts treat driver/restraint impacts as directional, not additive. The impact forecasts reflect baseline growth, mix effects, and variable interactions.
Segment Analysis
By Functionality: Endurance Dominates, Recovery Segment Accelerates
Endurance/energy-boost formulations accounted for 87.11% of the market share in 2024, reflecting their origins as stimulants for activities such as manual labor, long-haul driving, and late-night study sessions. These products primarily feature ingredients like caffeine, taurine, and B-vitamins to provide immediate alertness and are predominantly sold through impulse channels such as forecourts and kiosks, where consumers look for quick energy solutions. In contrast, muscle-recovery drinks held a smaller market share but are projected to grow at an annual rate of 11.56% through 2030, driven by increasing gym participation and demand from athletes for post-workout recovery solutions.
The shift toward recovery formulations is most evident in urban areas with established fitness infrastructure. Afrofit's franchising expansion across East Africa is expected to create a dedicated customer base for recovery drinks, either sold on-site or through partnerships with beverage distributors. Brands collaborating with gym chains to offer bundled memberships can encourage product trials before retail markets become saturated. However, a key challenge lies in educating consumers to justify the premium pricing of recovery drinks, as many African consumers currently perceive energy drinks as interchangeable products. Formulations that demonstrate clear benefits, such as faster recovery times and reduced muscle soreness, and effectively communicate these outcomes through credible endorsements, are likely to gain a significant market share.


By Packaging Type: Cans Lead, Glass Bottles Surge on Premiumization
In 2024, metal cans accounted for 57.04% of packaging volume, driven by their durability, portability, and compatibility with cold-chain distribution. Cans are particularly dominant in impulse purchase channels such as forecourts, kiosks, and vending machines, where consumers prioritize convenience and single-serve formats. Glass bottles are projected to grow at an annual rate of 14.21% through 2030, as brands increasingly focus on premium positioning and sustainability initiatives. PET bottles maintained a moderate market share, appealing to cost-conscious consumers who prefer larger formats and resealable closures. Aseptic packaging options, including Tetra Pak, cartons, and pouches, remain niche but are gaining traction in rural areas where limited cold-chain infrastructure makes shelf-stable formats essential to reducing spoilage risks.
Disposable cups, primarily used in on-trade venues, captured a minimal share but are experiencing growth as bars and nightlife establishments adopt branded dispensers for draft energy drinks. The packaging mix highlights a broader challenge: while sustainability advocates promote returnable glass and recycled PET, price-sensitive consumers resist higher costs, and informal retail channels often lack reverse-logistics systems to collect used packaging. Brands investing in deposit-refund schemes and collaborating with waste collectors can leverage packaging as a competitive advantage. However, these initiatives require significant investment, have long payback periods, and depend on regulatory support to succeed.
By Distribution Channel: Off-Trade Dominates, On-Trade Gains Momentum
Off-trade channels, including supermarkets, hypermarkets, convenience stores, specialty stores, and online retail, accounted for 95.28% of sales in 2024. This reflects Africa's retail environment, where traditional trade and modern retail coexist. Supermarkets and hypermarkets provide a wide product assortment and promotional visibility, while convenience stores and forecourts cater to impulse purchases linked to commuting and travel. Online retail is growing rapidly in urban areas. For example, PRIME Hydration's December 2024 launch in Ghana and Nigeria through TradeDepot, a B2B e-commerce platform, demonstrates how brands are bypassing traditional distributors to access fragmented retail networks. However, while this approach offers a competitive advantage, it involves a long payback period and requires regulatory support.
On-trade venues, such as bars, restaurants, and nightlife spots are projected to grow at an annual rate of 12.67% through 2030. This growth is driven by brand investments in sponsorships and experiential activations. For instance, Red Bull's March 2025 distribution agreement with Nile Breweries in Uganda integrates the brand into on-premise channels, where social consumption encourages trial and repeat purchases. On-trade channels also offer higher per-unit margins and opportunities for premium serves, such as mixing energy drinks with spirits or serving them in branded glassware. However, these channels are capital-intensive, requiring dedicated sales teams, refrigeration support, and promotional spending. Securing exclusive pouring rights at high-traffic venues can help brands establish market share before competitors enter. Nonetheless, reliance on nightlife channels carries risks, including potential regulatory crackdowns on youth-focused marketing.
By Soft Drink Type: Traditional Energy Drinks Dominate, Natural/Organic Energy Drinks Gain Momentum
Traditional energy drinks continue to dominate the African energy drink market, commanding 48.24% of the market value in 2024. This significant market position is primarily driven by the increasing availability of energy drinks in diverse flavors and ingredient combinations across the region. The segment's strong performance is particularly notable in Nigeria. The surge in demand is largely attributed to Africa's predominantly young demographic profile and its fast-paced lifestyle requirements. Major brands in this segment have been actively expanding their product portfolios with innovative flavors and formulations to maintain their market leadership, while also focusing on enhanced distribution networks across both urban and rural areas.
The natural/organic energy drinks segment is experiencing remarkable growth in the African market, projected to achieve 12.86% growth annually from 2025 to 2030. This impressive growth trajectory is driven by increasing health consciousness among consumers and a growing preference for clean-label products. Manufacturers are responding to this trend by introducing new energy drinks to the market fortified with natural ingredients such as ginseng, green tea extracts, and natural fruit flavors. The segment is also benefiting from the rising awareness about the potential health risks associated with artificial additives and synthetic ingredients, prompting consumers to seek healthier alternatives in their energy drink choices.
Geography Analysis
South Africa held 39.08% of market value in 2024, underpinned by mature retail infrastructure, higher per-capita incomes, and established cold-chain distribution. The energy drinks market in the country has experienced significant growth in recent years and is expected to continue expanding, albeit at a slower rate as the market matures. Local brands such as Switch Energy, Score Energy, and Dragon have gained popularity by offering competitive pricing and culturally relevant marketing strategies. Tiger Brands, a key player in the market, has reported strong performance for its Energade sports drink, supported by an extensive distribution network through general trade stores, providing broad access to informal retail channels. Additionally, the Health Promotion Levy has driven changes in product formulations, with beverage manufacturers substantially reducing taxable sugar content in recent years.
Nigeria is forecast to grow at 14.53% annually through 2030, the fastest rate among major markets, driven by youth demographics and rising disposable income. Studies indicate that consumption is prevalent, particularly among younger consumers, with pricing varying significantly based on format and brand. The Coca-Cola system has made substantial investments, demonstrating confidence in Nigeria’s economic trajectory to sustain demand despite challenges such as currency volatility and inflation. Local players, such as Tingo Electra, are competing with multinational companies by offering lower price points and leveraging localized distribution networks. Similarly, PRIME Hydration has entered the market via B2B e-commerce platforms, providing access to fragmented retail networks while bypassing traditional distributor markups. However, Nigeria’s regulatory environment remains complex, with NAFDAC guidelines often subject to varying interpretations and inconsistent enforcement.
Egypt presents a mixed outlook: the market benefits from a large urban population and growing fitness culture, but regulatory tightening poses risks. The National Food Safety Authority introduced evidence-based requirements for caffeinated energy drinks in 2024, and the government plans to levy VAT on sugar-sweetened products in fiscal year 2025-2026, potentially compressing margins for full-sugar SKUs. The Rest of Africa category, spanning Kenya, Uganda, Ghana, and smaller markets, remains underpenetrated but is attracting investment. The Coca-Cola system committed USD 175 million to Kenya over 5 years, and Afrofit is franchising gym clubs across East Africa, creating new consumption occasions tied to active lifestyles
Competitive Landscape
The Africa energy drinks market exhibits a moderately consolidated structure, with multinational companies such as Red Bull, Monster, Coca-Cola, and PepsiCo holding a significant share. However, they face ongoing competition from regional players and local competitors. Coca-Cola HBC's USD 3.4 billion acquisition of 75% of Coca-Cola Beverages Africa, expected to close by the end of 2026, will consolidate bottling operations and enable faster rollout of Monster Energy across the continent. These moves reflect a broader pattern: incumbents are deploying capital to lock in distribution before local brands can scale, betting that first-mover advantages in cold-chain infrastructure and retail relationships will compound over time.
White-space opportunities are concentrated in underserved segments and geographies. Muscle-recovery drinks are experiencing steady growth but remain underpenetrated, creating openings for brands that collaborate with gym chains and sports teams. On-trade channels such as bars and nightlife venues are expanding and offer higher margins, yet many brands lack dedicated sales teams to service these accounts. Emerging disruptors include PRIME Hydration, which bypassed traditional distributors by partnering with TradeDepot’s B2B e-commerce platform to reach fragmented retail networks in Ghana and Nigeria.
Local brands like Tingo Electra in Nigeria and Dragon in South Africa are capturing share by tailoring formulations and price points to local tastes, proving that cultural resonance and affordability can offset multinational marketing budgets. Technology is becoming a competitive vector: Coca-Cola Beverages Africa's Namibia plant integrates artificial intelligence to optimize production and water recovery, reducing costs and enhancing sustainability credentials. Brands that invest in digital last-mile solutions, returnable-packaging loops, and data-driven demand forecasting can win share in markets where traditional distribution remains inefficient.
Africa Energy Drinks Industry Leaders
Monster Beverage Corporation
PepsiCo, Inc.
Red Bull GmbH
The Coca-Cola Company
Tiger Brands Ltd.
- *Disclaimer: Major Players sorted in no particular order

Recent Industry Developments
- October 2025: South Africa's Shesha introduced an energy drink made from juice extracted from fresh, raw sugarcane, marking a global first. The drink is crafted from hand-harvested, high-quality sugarcane stalks that are peeled and crushed to create the base for this naturally sweetened, fortified beverage. No other energy drink globally is produced using this method. Manufactured and canned in KwaZulu-Natal, this locally developed product contributes to job creation and economic growth in rural communities.
- March 2025: Red Bull GmbH secured an exclusive distribution agreement with Nile Breweries Limited in Uganda, embedding the brand in NBL's extensive on-premise and retail networks across the country. This partnership enables Red Bull to leverage NBL's cold-chain infrastructure and relationships with bars, restaurants, and convenience stores, accelerating market penetration in East Africa.
- November 2024: PRIME Hydration launched in Ghana and Nigeria via a partnership with TradeDepot, a B2B e-commerce platform serving fragmented retail networks. This digital-first distribution strategy bypasses traditional wholesalers and enables direct engagement with small retailers, reducing markups and improving availability in peri-urban and township markets.


Africa Energy Drinks Market Report Scope
Energy Shots, Natural/Organic Energy Drinks, Sugar-free or Low-calories Energy Drinks, Traditional Energy Drinks are covered as segments by Soft Drink Type. Glass Bottles, Metal Can, PET Bottles are covered as segments by Packaging Type. Off-trade, On-trade are covered as segments by Distribution Channel. Egypt, Nigeria, South Africa are covered as segments by Country.By Soft Drink Type
| Traditional Energy Drinks |
| Sugar-free or Low-calories Energy Drinks |
| Natural/Oraganic Energy Drinks |
| Energy Shots |
| Other Energy Drinks |
By Functionality
| Endurance/Energy Boost |
| Muscle Recovery |
| Other |
By Packaging Type
| PET Bottles |
| Glass Bottles |
| Metal Can |
| Aseptic packages |
| Disposable Cups |
By Distribution Channel
| On-Trade | |
| Off-Trade | Supermarket/Hypermarket |
| Convenience Stores | |
| Specialty Stores | |
| Online Retail | |
| Other Distribution Channels |
By Country
| South Africa |
| Egypt |
| Nigeria |
| Rest of Africa |
| By Soft Drink Type | Traditional Energy Drinks | |
| Sugar-free or Low-calories Energy Drinks | ||
| Natural/Oraganic Energy Drinks | ||
| Energy Shots | ||
| Other Energy Drinks | ||
| By Functionality | Endurance/Energy Boost | |
| Muscle Recovery | ||
| Other | ||
| By Packaging Type | PET Bottles | |
| Glass Bottles | ||
| Metal Can | ||
| Aseptic packages | ||
| Disposable Cups | ||
| By Distribution Channel | On-Trade | |
| Off-Trade | Supermarket/Hypermarket | |
| Convenience Stores | ||
| Specialty Stores | ||
| Online Retail | ||
| Other Distribution Channels | ||
| By Country | South Africa | |
| Egypt | ||
| Nigeria | ||
| Rest of Africa | ||


Market Definition
- Carbonated Soft Drinks (CSDs) - Carbonated soft drinks (CSDs) refer to non-alcoholic beverages that are carbonated and typically flavored, containing dissolved carbon dioxide to create effervescence. These beverages commonly include cola, lemon-lime, orange, and various fruit-flavored sodas. Marketed in cans, bottles, or fountain dispense.
- Juices - We have considered packaged juices which encompass non-alcoholic beverages derived from fruits, vegetables, or a combination thereof, processed and sealed in various packaging formats such as bottles, cartons, or pouches. Excluding fresh juices, this market segment involves commercially prepared and preserved juices, often with added preservatives and flavors.
- Ready-to-Drink (RTD) Tea and RTD Coffee - Ready-to-Drink (RTD) tea and RTD coffee are pre-packaged, non-alcoholic beverages that are brewed and prepared for consumption without further dilution. RTD tea typically includes various tea varieties, infused with flavors and sweeteners, and comes in bottles, cans, or cartons. Similarly, RTD coffee involves pre-brewed coffee formulations, often mixed with milk, sugar, or flavorings, and is conveniently packaged for on-the-go consumption.
- Energy Drinks - Energy drinks are non-alcoholic beverages formulated to provide a quick boost of energy and alertness. Whereas, sports drinks are beverages designed to hydrate and replenish electrolytes, particularly after physical exertion, exercise, or intense activity
| Keyword | Definition |
|---|---|
| Carbonated Soft Drinks | Carbonated soft drinks (CSDs) are a combination of carbonated water and flavouring, sweetened by sugar or a non-sugar sweeteners. |
| Standard Cola | Standard Cola is defined as the original flavor of cola soda. |
| Diet Cola | A cola-based soft drink containing no or low amounts of sugar |
| Fruit Flavored Carbonates | A carbonated beverage prepared from fruit juice/fruit flavor with carbonated water and containing sugar, dextrose, invert sugar or liquid glucose either singly or in combination. It may contain peel oil and fruit essences. |
| Juice | Juice is a drink made from the extraction or pressing of the natural liquid contained in fruit and vegetables. |
| 100% Juice | Fruit/vegetable juice made from fruit in the form of its juice with no water added to make up the volume. It is not permitted to add sugars, sweeteners, preservatives, flavourings or colourings to fruit juice. |
| Juice Drinks (up to 24% Juice) | Fruit/vegetable juice drinks with up to 24% fruits/vegetable extract. |
| Nectars (25-99% Juice) | Juices that can have between 25 and 99% of fruit, with the minimum legal limits defined depending on the type of fruit |
| Juice concentrates | Juice Concentrates are those form of juices when most of this liquid is removed resulting in a thick, syrupy product known as juice concentrate. |
| RTD Coffee | Packaged coffee beverages that are sold in a prepared form and are ready for consumption at the time of purchase. |
| Iced Coffee | An iced coffee is a cold version of coffee, usually a combination of hot espresso and milk with ice added to it. |
| Cold Brew Coffee | Cold brew also called cold water extraction or cold pressing is made by steeping ground coffee in room-temperature water for several hours. |
| RTD Tea | Ready-to-drink (RTD) tea is a packaged tea product ready for immediate consumption without brewing or preparation |
| Iced Tea | Ice tea or iced tea is a drink made from tea without milk but with sugar and sometimes fruit flavourings, drunk cold. |
| Green Tea | Green tea is a tea beverage which promotes mental alertness, relieving digestive symptoms and promoting weight loss. |
| Herbal Tea | Herbal tea beverages are made from the infusion or decoction of herbs, spices, or other plant material in hot water. |
| Energy Drink | A type of drink containing stimulant compounds, usually caffeine, which is marketed as providing mental and physical stimulation. They may or may not be carbonated and may also contain sugar, other sweeteners, or herbal extracts, among numerous possible ingredients. |
| Sugar-free or Low-calories Energy Drinks | Sugar-free or Low-calories Energy Drinks are sugar-free, artificially sweetened energy drinks with few or no calories. |
| Traditional Energy Drink | Traditional Energy Drinks are functional soft drinks containing ingredients designed to boost the consumer's energy. |
| Natural/Oraganic Energy Drinks | Natural/Organic energy drinks are energy drinks free of artificial sweeteners and synthetic colorings. Instead, they contain naturally derived ingredients such as green tea, yerba mate, and botanical extracts. |
| Energy Shots | A small but highly concentrated energy drink that contains large amounts of caffeine and/or other stimulants. The quantity is comparatively smaller compared to energy drinks. |
| Sports Drink | Sports drinks are beverages designed specifically for the rapid supply of fluid, carbohydrates, and electrolytes before, during or after exercise. |
| Isotonic | Isotonic drinks contain similar concentrations of salt and sugar as in the human body, and are designed to quickly replace fluids lost during exercise but with an increase of carbohydrate. |
| Hypertonic | Hypertonic drinks have a higher concentration of salt and sugar than the human body. They are best drunk after exercise as it is important to replace glycogen levels quickly after exercise. |
| Hypotonic | Hypotonic drinks are designed to quickly replace fluids lost during exercise. They have very low carbohydrate content and a lower concentration of salt and sugar than the human body. |
| Electrolyte-Enhanced Water | Electrolyte water is water infused with electrically-charged minerals, such as sodium, potassium, calcium, and magnesium. |
| Protein-based Sport Drinks | Protein-based sports drinks are those sports drinks which has added protein in it that will improve performance and reduce muscle protein breakdown. |
| On-Trade | The on-trade refers to places that sell beverages for immediate consumption on the premises like bars, restaurants, and pubs |
| Off-Trade | Off-trade usually means places like liquor stores, supermarkets and other places where you don't consume the beverage right away. |
| Convenience Store | A retail business that provides the public with a convenient location to quickly purchase a wide variety of consumable products and services, generally food and gasoline. |
| Specialty store | A specialty store is a shop/store that carries a deep assortment of brands, styles, or models within a relatively narrow category of goods |
| Online Retail | Online retail is a type of eCommerce whereby a business sells goods or services directly to consumers from a website. |
| Aseptic Packaging | Aseptic packaging refers to the filling of a cold, commercially sterile product under sterile conditions into a presterilized container and closure under sterile conditions to form a seal that effectively excludes microorganisms. These includes tetra packs, cartons, pouches etc. |
| PET Bottle | PET bottle means a bottle made of polyethylene terephthalate. |
| Metal Cans | Metal containers made of aluminum or tin- plated or zinc-plated steel, which are commonly used for packaging food, beverages or other products. |
| Disposable Cups | Disposable Cup means a cup or other container designed for single use to serve beverages, such as water, cold drinks, hot drinks and alcoholic beverages. |
| Gen Z | A way of referring to the group of people who were born in the late 1990s and early 2000s. |
| Millenial | Anyone born between 1981 and 1996 (ages 23 to 38 in 2019) is considered a Millennial |
| Taurine | Taurine is an amino acid that supports immune health and nervous system function. |
| Bars & Pubs | It is a drinking establishment licensed to serve alcoholic drinks for consumption on the premises. |
| Café | It is a foodservice establishment serving refreshments (mainly coffee) and light meals. |
| On the go | It means doing / dealing with while busily engaged with something and not diverting plans in order to accommodate. |
| Internet Penetration | The Internet Penetration Rate corresponds to the percentage of the total population of a given country or region that uses the Internet. |
| Vending Machine | A machine that dispenses small articles such as food, drinks, or cigarettes when a coin or token is inserted |
| Discount store | A discount store or discounter offers a retail format in which products are sold at prices that are in principle lower than an actual or supposed "full retail price". Discounters rely on bulk purchasing and efficient distribution to keep down costs. |
| Clean Label | Clean label on the beverage market are drinks that are made from few ingredients of natural origin and are not or only slightly processed. |
| Caffeine | An alkaloid compound which is a stimulant of the central nervous system. It is mainly used recreationally, as a mild cognitive enhancer to increase alertness and attentional performance. |
| Extreme sport | Action sports, adventure sports or extreme sports are activities perceived as involving a high degree of risk. |
| High-intensity interval training | It incorporates several rounds that alternate between several minutes of high intensity movements to significantly increase the heart rate to at least 80% of one's maximum heart rate, followed by short periods of lower intensity movements. |
| Shelf life | The length of time for which an item remains usable, fit for consumption, or saleable. |
| Cream Soda | Cream soda is a sweet soft drink. Generally flavored with vanilla and based on the taste of an ice cream float |
| Root Beer | Root beer is a sweet North American soft drink traditionally made using the root bark of the sassafras tree Sassafras albidum or the vine of Smilax ornata as the primary flavor. Root beer is typically, but not exclusively, non-alcoholic, caffeine-free, sweet, and carbonated. |
| Vanilla Soda | A carbonated soft drink flavoured with vanilla. |
| Dairy-Free | A product that does not contain any milk or milk products from cows, sheep or goats. |
| Caffeine-Free Energy Drinks | Caffeine-free energy drinks rely on other ingredients to boost the energy. Popular choices include amino acids, B vitamins, and electrolytes. |


Research Methodology
Mordor Intelligence follows a four-step methodology in all our reports.
- Step-1: IDENTIFY KEY VARIABLES: In order to build a robust forecasting methodology, the variables and factors identified in Step 1 are tested against available historical market numbers. Through an iterative process, the variables required for market forecast are set, and the model is built on the basis of these variables.
- Step-2: Build a Market Model: Market-size estimations for the forecast years are in nominal terms. Inflation is not a part of the pricing, and the average selling price (ASP) is kept constant throughout the forecast period for each country.
- Step-3: Validate and Finalize: In this important step, all market numbers, variables, and analyst calls are validated through an extensive network of primary research experts from the market studied. The respondents are selected across levels and functions to generate a holistic picture of the market studied.
- Step-4: Research Outputs: Syndicated reports, custom consulting assignments, databases & subscription platforms


