Underground Utility Mapping Market Size and Share
Market Overview
| Study Period | 2020 - 2031 |
|---|---|
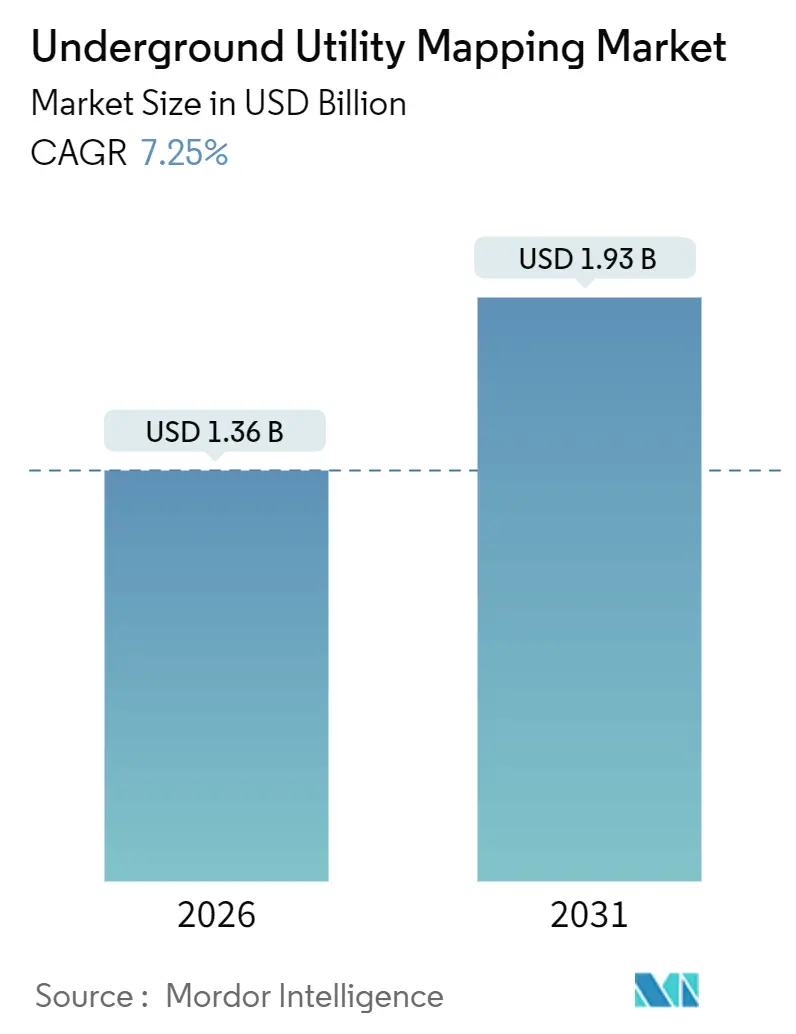
| Market Size (2026) | USD 1.36 Billion |
| Market Size (2031) | USD 1.93 Billion |
| Growth Rate (2026 - 2031) | 7.25% CAGR |
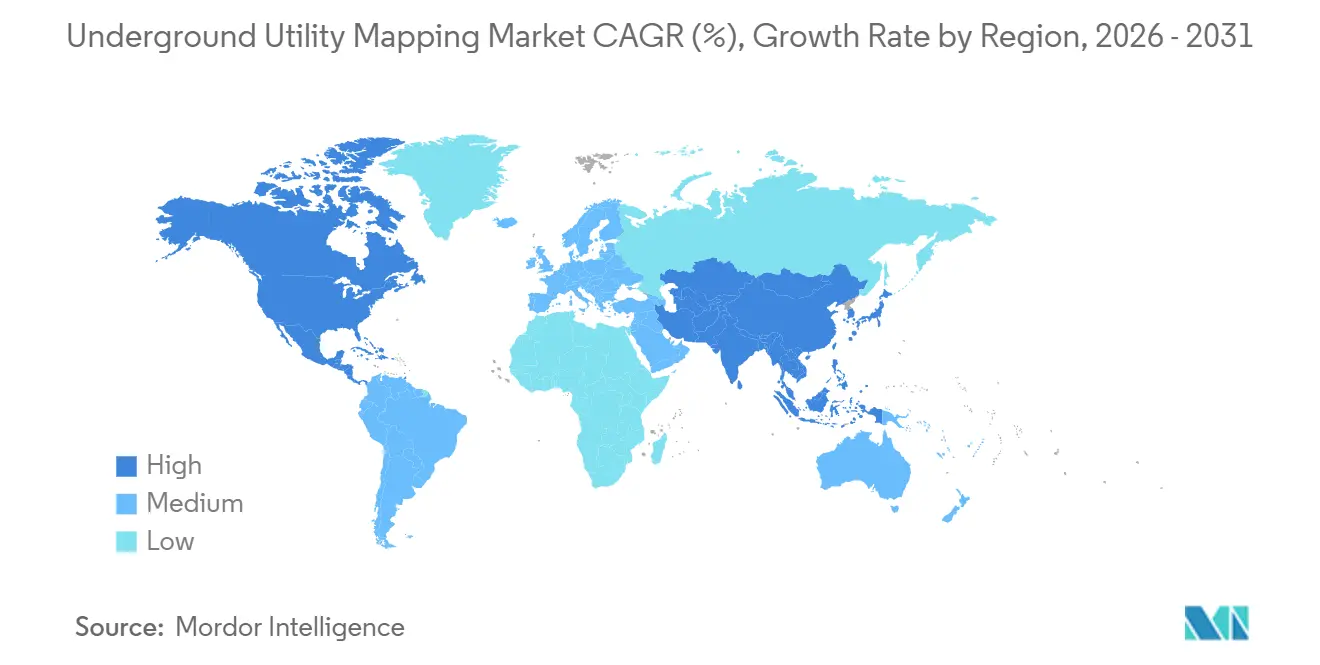
| Fastest Growing Market | Asia Pacific |
| Largest Market | North America |
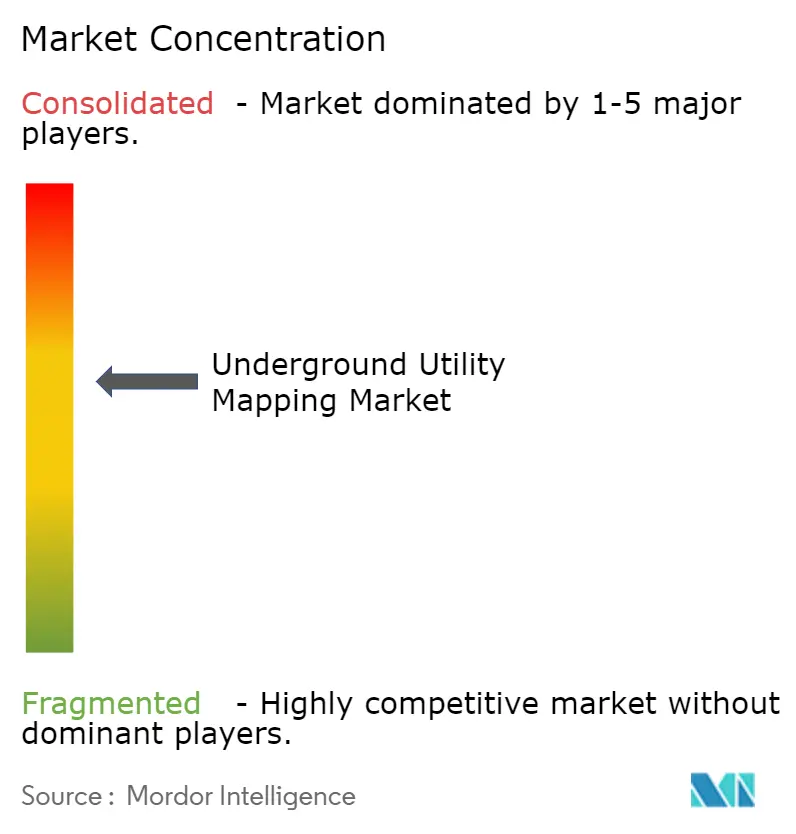
| Market Concentration | Medium |
Major Players *Disclaimer: Major Players sorted in no particular order Image © Mordor Intelligence. Reuse requires attribution under CC BY 4.0. | |
Underground Utility Mapping Market Analysis by Mordor Intelligence
The Underground Utility Mapping Market size is estimated at USD 1.36 billion in 2026, and is expected to reach USD 1.93 billion by 2031, at a CAGR of 7.25% during the forecast period (2026-2031).
The growth rests on rapid infrastructure renewal, stricter excavation-damage laws, and the maturing of sensor-fusion platforms that convert buried-asset data into actionable digital twins. Demand also intensifies as owners incorporate underground models into environmental, social, and governance (ESG) disclosures to quantify physical risk exposure. North America’s long-running One Call frameworks sustain robust replacement demand, while Asia-Pacific’s highway, metro, and fiber rollouts are reshaping procurement toward cloud-based collaboration. Competitive dynamics reveal moderate fragmentation: the top four vendors account for a mid-30% share, yet regional specialists still thrive by pairing local regulatory insight with niche technology packages.
Key Report Takeaways
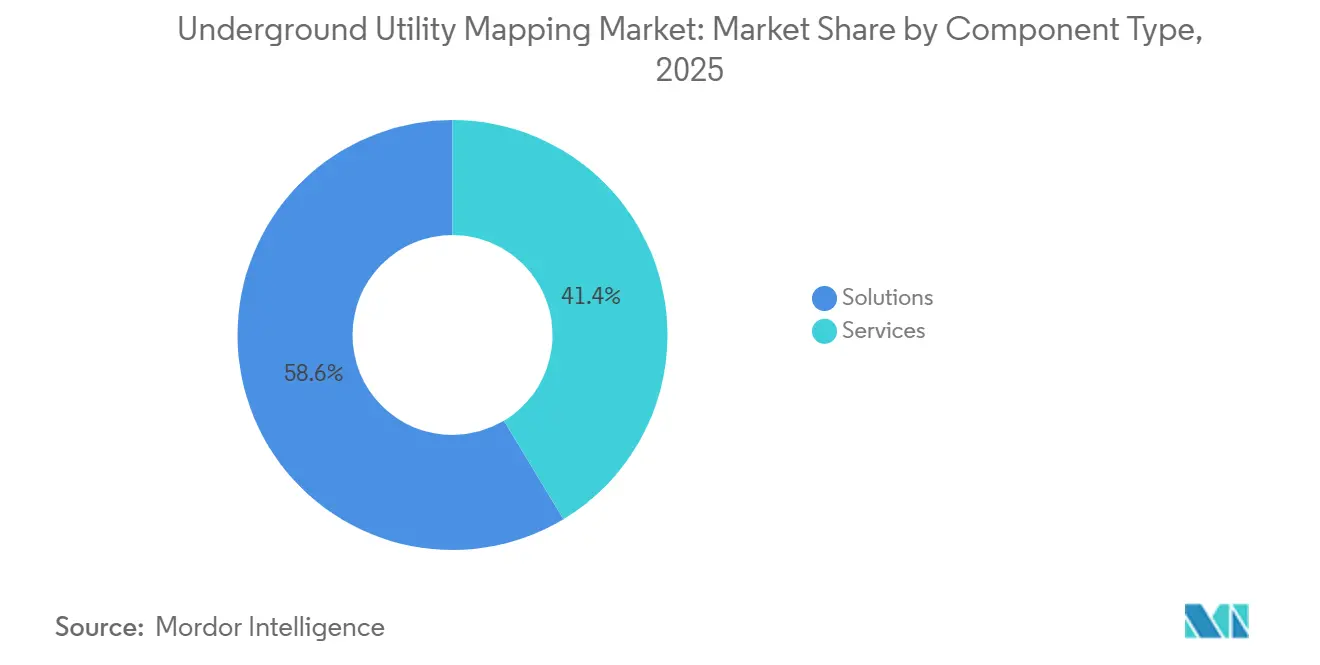
- By component type, solutions accounted for 58.63% of the underground utility mapping market share in 2025, while services are expected to expand at a 9.22% CAGR through 2031.
- By end-user, building and construction held 28.53% of the underground utility mapping market size in 2025, while transportation infrastructure is forecast to advance at an 8.14% CAGR to 2031.
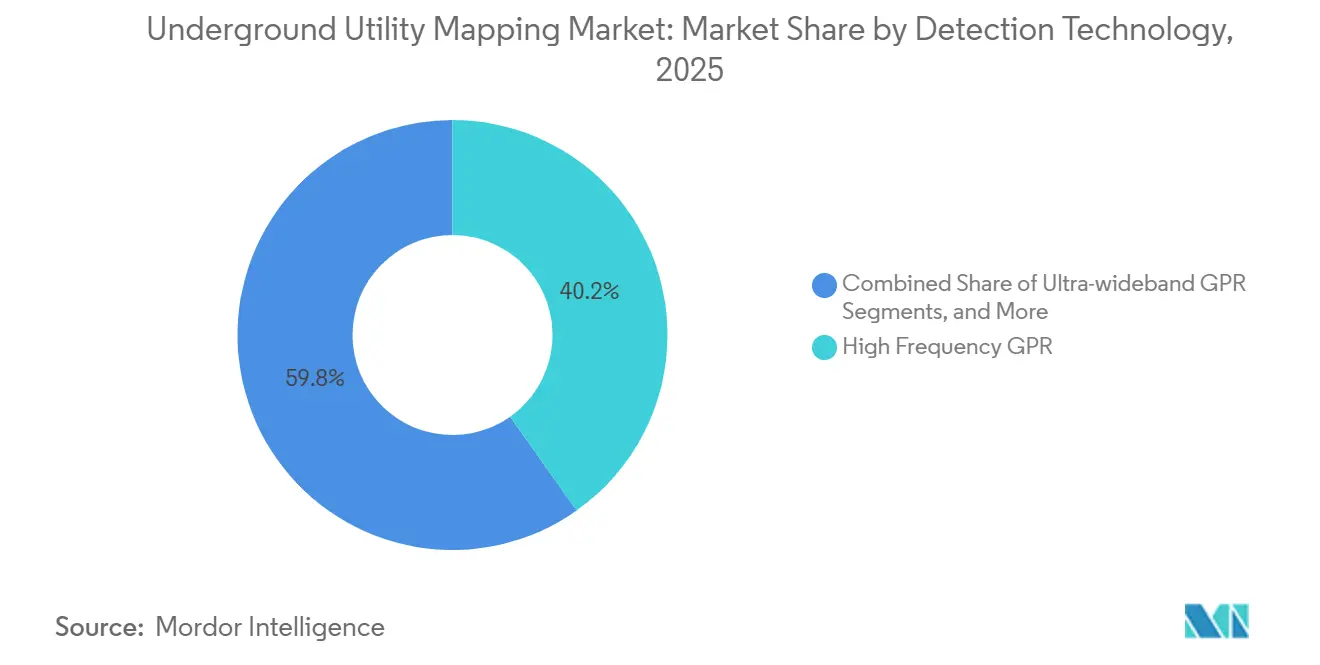
- By detection technology, high-frequency GPR captured 40.21% share of the underground utility mapping market size in 2025, whereas LiDAR-assisted imaging is projected to grow at an 8.72% CAGR through 2031.
- By delivery mode, outsourced survey providers secured 52.84% share in 2025. Software-as-a-service platforms are poised to post a 9.64% CAGR during the forecast period.
- By geography, North America led with 33.92% market share in 2025, while Asia-Pacific is projected to expand at a 10.32% CAGR through 2031.
Note: Market size and forecast figures in this report are generated using Mordor Intelligence’s proprietary estimation framework, updated with the latest available data and insights as of January 2026.
Global Underground Utility Mapping Market Trends and Insights
Drivers Impact Analysis*
| Driver | (~)% Impact on CAGR Forecast | Geographic Relevance | Impact Timeline |
|---|---|---|---|
| Smart-City Programs Mandating Digital Twin-Ready Subsurface Data | +2.3 | Global, North America and Europe lead | Medium term (2-4 years) |
| Tightening Excavation-Damage Regulations in North America and Europe | +2.1% | North America and Europe, with spillover to Australia and New Zealand | Medium term (2-4 years) |
| Growing Fiber-to-the-Home (FTTH) Rollout Volume | +1.8% | Global, with concentration in Asia-Pacific, North America, and Europe | Long term (≥ 4 years) |
| Adoption of Multi-Sensor UAV-Based Mapping Payloads | +1.5% | North America and Europe initially, expanding to Asia-Pacific and Middle East | Medium term (2-4 years) |
| Utility ESG Reporting That Now Requires Buried-Asset Disclosure | +1.2% | Global, led by North America and Europe with regulatory frameworks | Long term (≥ 4 years) |
| Insurtech Discounts for Projects with Certified Subsurface Models | +0.9% | North America and Europe, emerging in Asia-Pacific | Medium term (2-4 years) |
| Source: Mordor Intelligence | |||
Tightening Excavation-Damage Regulations
Regulators have shifted from advisory to punitive postures. Pennsylvania’s Act 127 authorizes fines up to USD 50,000 per violation and obliges electronic locate requests three days before breaking ground, embedding mapping into baseline project schedules. California’s Dig Safe Act mirrors this stance by mandating the creation of positive-response records within 48 hours, thereby creating a defensible audit trail. The Common Ground Alliance logged 189,549 U.S. damages in 2023, totaling roughly USD 30 billion in economic losses, amplifying the cost-avoidance incentive. Europe now requires subsurface surveys for projects above EUR 500,000 (USD 565,000) under its revised Construction Products Regulation, expanding the minimum mapping budget. Collectively, these mandates accelerate solution purchase cycles and elevate mapping from a compliance afterthought to a core risk-management tool.
Growing Fiber-to-the-Home Rollout Volume
The United States passed 60 million connected premises in 2024 and targets 75 million by 2026, driving trenching projects that must navigate dense utility corridors.[1]Federal Communications Commission, “2024 Broadband Deployment Report,” fcc.gov China plans 400 million connections by 2027, while India’s BharatNet will link 250,000 village clusters by 2026. Because fiber routes often parallel legacy gas, water, and power lines, operators bundle certified subsurface utility engineering into capital plans. Insurers now reward contractors that present Quality Level A models with premium discounts, reinforcing the spending cycle.
Adoption of Multi-Sensor UAV-Based Mapping Payloads
Hexagon’s 2024 UAV GPR system scans 10 kilometers per day, five times faster than traditional carts. The U.S. Federal Aviation Administration streamlined Part 107 waivers, clearing beyond-visual-line-of-sight flights for utility surveys.[2]Federal Aviation Administration, “Part 107 Waiver Guidance,” faa.gov Leica’s BLK ARC handheld blends LiDAR, GPR, and real-time kinematic GPS to deliver 5-centimeter positional accuracy, satisfying ASCE 38-22 Quality Level A criteria. Lower per-kilometer acquisition costs now justify mapping for secondary roads and residential subdivisions, broadening the market for underground utility mapping.
Utility ESG Reporting That Requires Buried-Asset Disclosure
The 2024 SEC climate rule adopts Task Force on Climate-related Financial Disclosures guidance, pushing utilities to inventory buried pipelines, cables, and ducts. ISO 55000 updates reinforce full-lifecycle asset tracking, while investors penalize firms that cannot evidence hidden-asset resilience. Utilities respond by commissioning enterprise-wide surveys reminiscent of above-ground audits, transforming mapping from episodic procurement to a recurring governance line item.
Restraint Impact Analysis*
| Restraint | (~)% Impact on CAGR Forecast | Geographic Relevance | Impact Timeline |
|---|---|---|---|
| High Capital Cost of High-Frequency Ground-Penetrating Radar Systems | -1.3% | Global, with acute impact in price-sensitive Asia-Pacific and African markets | Short term (≤ 2 years) |
| Shortage of Certified Utility-Survey Professionals | -1.1% | North America and Europe, emerging in Asia-Pacific | Medium term (2-4 years) |
| Data-Ownership Disputes Between Municipalities and Contractors | -0.7% | North America, Europe, and Australia | Medium term (2-4 years) |
| Signal Interference in Congested Mega-City Environments | -0.6% | Asia-Pacific mega-cities, North American and European urban cores | Short term (≤ 2 years) |
| Source: Mordor Intelligence | |||
High Capital Cost of High-Frequency GPR Systems
Systems priced between USD 50,000 and 150,000 stretch budgets of small contractors and municipal agencies. Ultra-wideband platforms can near USD 200,000, and annual maintenance contracts add 12% to 15% of purchase value.[3]Geophysical Survey Systems, “2024 Product Catalog,” geophysical.com Import tariffs and limited vendor support raise ownership costs in emerging economies, encouraging rental models but limiting outright sales.
Shortage of Certified Utility-Survey Professionals
The National Utility Locating Contractors Association reported a 20% technician shortfall in 2024, elongating project queues. Enrollment in ASCE’s subsurface certification program declined 15% from 2022 to 2024. Skills gaps are sharpest in LiDAR-GPR fusion and UAV operation, delaying full exploitation of next-generation tools. Training pipelines typically require two years, dampening near-term capacity expansion.
*Our forecasts treat driver/restraint impacts as directional, not additive. The impact forecasts reflect baseline growth, mix effects, and variable interactions.
Segment Analysis
By Component Type: Services Expand as Complexity Outpaces Hardware
Services revenue is projected to climb at a 9.22% CAGR between 2026 and 2031, even though solutions commanded 58.63% of underground utility mapping market share in 2025. Large infrastructure owners now outsource detection, 3D modeling, and certification to bridge internal talent shortages. Third-party validation of ASCE 38-22 Quality Levels integrates mapping fees into financing documents, embedding recurring service spend across project lifecycles. Demand is strongest where public agencies face hiring freezes yet remain legally liable for missed utilities, pushing them toward outcome-based contracts that guarantee regulatory compliance.
The solutions segment still anchors capital budgets for heavyweight engineering consultancies that prefer owning ground-penetrating radar fleets and multimodal sensors. High-frequency GPR dominates hardware spend, but integrated platforms that combine GPR, electromagnetic, and LiDAR inputs are gaining traction as they reduce field passes and operator skill requirements. Vendors now bundle extended warranties and cloud analytics to compress total cost of ownership, a move that blurs the line between one-time equipment sales and subscription services. As more owners insist on data interoperability, solution providers that offer seamless uploads into common GIS and BIM ecosystems are tightening their grip on replacement cycles.


By End-User Industry: Transportation Infrastructure Accelerates
Building and construction retained 28.53% of underground utility mapping market size in 2025 because residential and commercial projects must obtain One Call clearances before excavation. Transportation infrastructure, however, is set to outpace all other verticals with an 8.14% CAGR as highway widening, metro tunneling, and high-speed rail mandates embed subsurface utility engineering at the feasibility stage. The U.S. Infrastructure Investment and Jobs Act alone channels USD 110 billion toward road and bridge works, creating a multi-year pipeline of locate requests that already strain certified-locator capacity. Similar megaprojects in India, China, and ASEAN cities are replicating this demand curve, drawing global service firms into joint ventures with local surveyors.
Electric power distribution, oil and gas, water and wastewater, and public-safety agencies round out the user base with needs tied to regulatory compliance and resilience planning. Utilities are burying overhead lines to mitigate wildfire risk, water authorities are replacing lead service laterals, and pipeline operators must mark assets under PHMSA rules. Telecommunications maintains a mid-teens share thanks to fiber-to-the-home builds, yet its service cadence is episodic compared with transportation’s long-horizon mega-corridor programs. Collectively, these verticals ensure diversified revenue streams that cushion providers from cyclicality in any single sector.
By Detection Technology: LiDAR-Assisted Imaging Disrupts Status Quo
High-frequency GPR held 40.21% of detection-technology share in 2025, reflecting its unmatched ability to resolve small-diameter conduits within 30 centimeters of the surface. Active radio-frequency and passive electromagnetic locators remain the workhorses for metallic lines because of their low cost and simple training curve, but neither can detect non-conductive pipes that now dominate new installations. Ultra-wideband GPR fills depth-penetration gaps in clay soils, while LiDAR-assisted subsurface imaging is surging at an 8.72% CAGR as UAV or backpack payloads capture surface topography and buried-asset signatures in a single pass. The blend of modalities satisfies ASCE 38-22 Quality Level A positional tolerances, allowing contractors to replace manual correlation between pavement features and utility alignments.
Going forward, sensor-fusion platforms are expected to shift the revenue mix toward software because raw scans feed machine-learning engines that auto-classify reflections. Vendors are leveraging open APIs to funnel LiDAR-GPR point clouds into mainstream BIM environments, creating new fee opportunities for analytics and lifecycle data management. Price pressure on high-frequency GPR hardware is easing as component costs fall, but service-attached maintenance contracts and cloud subscriptions offset margin erosion. These dynamics position detection-technology providers to capture incremental underground utility mapping market share as owners migrate from paper as-builts to continuously updated digital twins.

By Delivery Mode: SaaS Democratizes Advanced Workflows
Outsourced survey providers captured 52.84% share in 2025 because capital-intensive equipment and scarce talent favor turnkey contracting. Many public agencies and small contractors lack the specialized staff to interpret GPR data or certify results, so they hand the task off to regional specialists who ensure compliance with ASCE standards. Outsourcers bundle hydrovac exposure, photogrammetry, and robotics into integrated statements of work, locking in multi-year maintenance contracts that defend margins even when new-project starts slow.
Software-as-a-service platforms, on the other hand, are on track for a 9.64% CAGR, as subscription pricing ranges from USD 500 to 2,000 per user annually, eliminating six-figure desktop license costs. Field crews upload scans through mobile apps, trigger automated quality checks, and receive georeferenced 3D models within hours. This workflow compresses approval cycles and supports real-time collaboration among engineers, surveyors, and permitting officials. In-house survey teams, primarily at large utilities and engineering conglomerates, are adopting hybrid models that keep data sovereignty while renting cloud-based processing power during peak workloads, further broadening SaaS penetration.
Geography Analysis
North America commanded 33.92% of underground utility mapping market share in 2025. Federal transportation funds, state-level fine structures, and mature One Call procedures institutionalize mapping as a prerequisite for projects. Pennsylvania’s Act 127 and California’s Dig Safe revisions add hefty penalties that elevate subsurface verification to board-level attention. Canada is tightening lead times for location requests, and Mexico’s near-shoring wave is driving industrial corridor demand, albeit constrained by uneven enforcement.
Asia-Pacific is forecast to grow at a 10.32% CAGR through 2031, the fastest regional pace. India’s USD 1.4 trillion National Infrastructure Pipeline shepherds metro and highway schemes that all require certified underground models. China’s ambition to connect 400 million with fiber and vigorous urban-renewal funds energize sensor sales and service outsourcing. ASEAN nations absorb multilateral-bank loan conditions that explicitly include subsurface utility engineering, yet progress is tempered by talent shortages and import duties on high-frequency GPR.
Europe, South America, the Middle East, and Africa collectively form the remainder. The European Union’s EUR 500,000 (USD 565,000) survey threshold harmonizes demand across member states, while the United Kingdom accelerates the burial of overhead lines to bolster climate resilience. Brazil and Argentina lead South America via urban-renewal programs and mining expansions that must locate water and telecom lines. Middle Eastern smart-city master plans, such as NEOM and Masdar City, build digital twins from the ground up, ensuring persistent spending on mapping. Africa trails but shows green shoots in South African mining belts and Nigerian urban cores where safety mandates are tightening.

Competitive Landscape
The underground utility mapping market remains moderately fragmented because the top four suppliers, including Hexagon AB, Leica Geosystems, Geophysical Survey Systems, and Radiodetection Ltd, collectively control roughly 35% of global revenue. Regional specialists and service-only firms still capture sizable municipal and industrial contracts, ensuring that no single brand sets pricing power. Hardware manufacturers now pair sensors with software subscriptions, shifting the revenue mix from one-time equipment sales to recurring analytics fees. Venture activity is steady as private equity funds consolidate small survey companies to gain national coverage. Competitive intensity, therefore, centers on integration breadth rather than on headline acquisition volume.
Technology differentiation clusters around three axes: sensor fusion, autonomous field platforms, and cloud workflows. Leica’s BLK ARC handheld unites LiDAR, ground-penetrating radar, and real-time kinematic GPS to deliver 5-centimeter positional accuracy, which meets ASCE 38-22 Quality Level A tolerances. Hexagon AB complements its multimodal sensors with the HxGN Content Program, a subscription that processes raw scans in the cloud and returns fully registered 3D models within hours. Radiodetection Ltd upgraded its electromagnetic locator firmware to stream locate traces directly into leading construction-management suites, shortening the hand-off to designers. Geophysical Survey Systems added machine-learning noise filters to its high-frequency GPR line, which improves detection in signal-rich downtown corridors.
Emerging disruptors exploit service models that couple local regulatory know-how with flexible pricing. Firms such as multiVIEW Locates and U-Locate Utility Mapping win city contracts by bundling hydrovac exposure, UAV mapping, and ASCE certification into turnkey packages. Some large utilities and construction majors are building in-house survey teams to keep proprietary data under tight control, but they still license cloud analytics from third-party vendors during peak workloads. As a result, solution providers that offer open APIs and pay-as-you-go processing maintain an edge with both external service firms and vertically integrated owners.
Underground Utility Mapping Industry Leaders
Hexagon AB
Leica Geosystems AG
Geophysical Survey Systems, Inc.
Radiodetection Ltd
Vivax-Metrotech Corp.
- *Disclaimer: Major Players sorted in no particular order

Recent Industry Developments
- December 2025: Hexagon AB rolled out an AI-powered cloud engine that auto-classifies GPR reflections, reducing post-survey processing time by 40% and integrating directly with its HxGN Content Program subscription.
- December 2025: Leica Geosystems unveiled a LiDAR-GPR backpack system tailored for confined-space tunnels, winning pilot contracts on European metro extensions.
- November 2025: Radiodetection introduced a software update enabling 3D visualization of electromagnetic locate traces within common BIM platforms, easing hand-offs to civil engineers.
- October 2025: Badger Daylighting expanded its hydrovac fleet by 60 units and opened two depots in Texas to serve highways funded under the U.S. Infrastructure Investment and Jobs Act.
- September 2025: Geophysical Survey Systems signed a distribution deal with a Southeast Asian reseller, bundling finance options to mitigate high upfront equipment costs in price-sensitive markets.


Global Underground Utility Mapping Market Report Scope
The Underground Utility Mapping Market Report is Segmented by Component Type (Solutions, Services), End-User Industry (Public Safety, Oil and Gas, Construction, Telecommunications, Power, Water, Transportation), Detection Technology (RF Location, EM Detection, High-frequency GPR, UWB GPR, LiDAR Imaging), Delivery Mode (In-house, Outsourced, SaaS), and Geography (North America, South America, Europe, Asia-Pacific, Middle East, Africa). The Market Forecasts are in Value (USD).
| Solutions | Ground-Penetrating Radar (GPR) |
| Electromagnetic (EM) Locators | |
| Acoustic and Infra-red System | |
| Integrated Multi-sensor Platforms | |
| Services | Utility Detection and Surveying |
| Data Processing and 3D Modelling | |
| Validation and Certificate |
| Public Safety and Emergency Services |
| Oil and Gas |
| Building and Construction |
| Telecommunications |
| Electric Power Distribution |
| Water and Waste-water Management |
| Transportation Infrastructure |
| Active Radio-frequency (RF) Location |
| Passive Electromagnetic Detection |
| High-frequency GPR (500 MHz-3 GHz) |
| Ultra-wideband (UWB) GPR |
| LiDAR-assisted Subsurface Imaging |
| In-house Survey Teams |
| Outsourced Survey Service Providers |
| Software-as-a-Service Platforms |
| North America | United States |
| Canada | |
| Mexico | |
| South America | Brazil |
| Argentina | |
| Rest of South America | |
| Europe | Germany |
| United Kingdom | |
| France | |
| Italy | |
| Spain | |
| Rest of Europe | |
| Asia-Pacific | China |
| Japan | |
| India | |
| South Korea | |
| ASEAN | |
| Rest of Asia-Pacific | |
| Middle East | Saudi Arabia |
| United Arab Emirates | |
| Rest of Middle East | |
| Africa | South Africa |
| Nigeria | |
| Rest of Africa |
| By Component Type | Solutions | Ground-Penetrating Radar (GPR) |
| Electromagnetic (EM) Locators | ||
| Acoustic and Infra-red System | ||
| Integrated Multi-sensor Platforms | ||
| Services | Utility Detection and Surveying | |
| Data Processing and 3D Modelling | ||
| Validation and Certificate | ||
| By End-User Industry | Public Safety and Emergency Services | |
| Oil and Gas | ||
| Building and Construction | ||
| Telecommunications | ||
| Electric Power Distribution | ||
| Water and Waste-water Management | ||
| Transportation Infrastructure | ||
| By Detection Technology | Active Radio-frequency (RF) Location | |
| Passive Electromagnetic Detection | ||
| High-frequency GPR (500 MHz-3 GHz) | ||
| Ultra-wideband (UWB) GPR | ||
| LiDAR-assisted Subsurface Imaging | ||
| By Device Delivery Mode | In-house Survey Teams | |
| Outsourced Survey Service Providers | ||
| Software-as-a-Service Platforms | ||
| By Geography | North America | United States |
| Canada | ||
| Mexico | ||
| South America | Brazil | |
| Argentina | ||
| Rest of South America | ||
| Europe | Germany | |
| United Kingdom | ||
| France | ||
| Italy | ||
| Spain | ||
| Rest of Europe | ||
| Asia-Pacific | China | |
| Japan | ||
| India | ||
| South Korea | ||
| ASEAN | ||
| Rest of Asia-Pacific | ||
| Middle East | Saudi Arabia | |
| United Arab Emirates | ||
| Rest of Middle East | ||
| Africa | South Africa | |
| Nigeria | ||
| Rest of Africa | ||


Key Questions Answered in the Report
What is the current value of the underground utility mapping market?
The underground utility mapping market size reached USD 1.36 billion in 2026 and is projected to grow to USD 1.93 billion by 2031.
Which segment is expanding fastest?
Services, covering detection, 3D modeling, and certification, are forecast to grow at a 9.22% CAGR through 2031.
Why is transportation infrastructure adopting mapping so quickly?
Highway widening, metro tunneling, and rail projects embed utility engineering early to avoid costly relocations, driving an 8.14% CAGR in the segment.
How do new regulations affect project budgets?
Acts such as Pennsylvania’s Act 127 impose fines up to USD 50,000 for violations, making certified subsurface models a mandatory budget line.
What technology trends should buyers watch?
Multi-sensor UAV payloads that fuse LiDAR and GPR are cutting survey times and enabling 5-centimeter accuracy, expanding use cases to smaller projects.
Are SaaS platforms replacing traditional desktop software?
Yes, cloud subscriptions priced from USD 500-2,000 per user annually now deliver ASCE-compliant outputs without costly on-premise licenses, democratizing access for small contractors.
Page last updated on:


