Market Overview
| Study Period | 2019 - 2030 |
|---|---|
| Forecast Data Period | 2025 - 2030 |
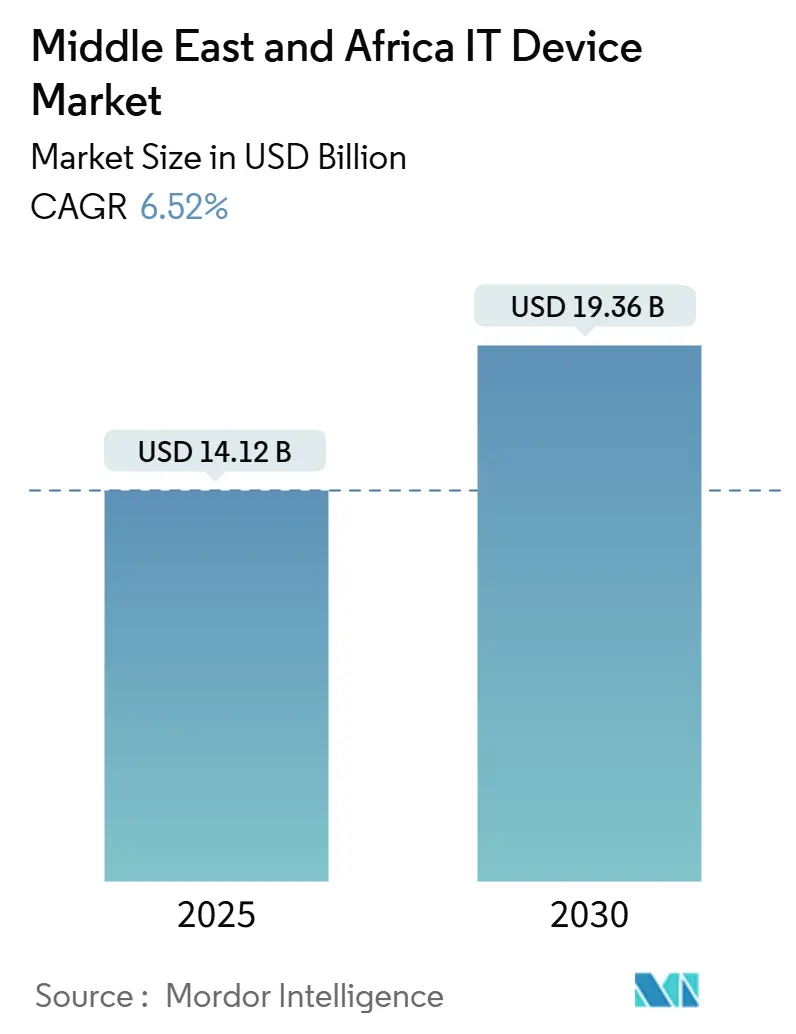
| Base Year Market Size (2025) | USD 14.12 Billion |
| Market Size (2025) | USD 14.12 Billion |
| Market Size (2030) | USD 19.36 Billion |
| Growth Rate (2025 - 2030) | 6.52% CAGR |
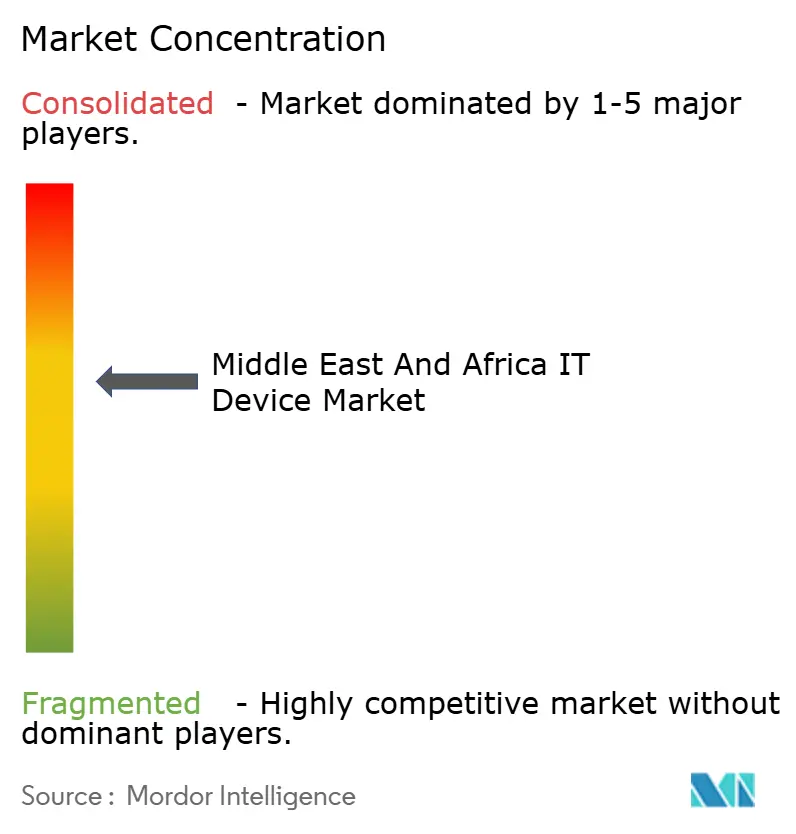
| Market Concentration | Medium |
Major Players *Disclaimer: Major Players sorted in no particular order Image © Mordor Intelligence. Reuse requires attribution under CC BY 4.0. | |
Middle East and Africa IT Device Market Analysis by Mordor Intelligence
The Middle East and Africa IT Device market size stands at USD 14.12 billion in 2025 and is projected to reach USD 19.36 billion by 2030, registering a 6.52% CAGR during the forecast period. Momentum stems from government-funded digital transformation programs, a rising youth population that treats smartphones as primary computers, and the shift from generalized hardware replacements to sector-specific procurements. Large-scale fiber deployments in Gulf states now anchor multi-device ecosystems, while fintech and super-app models compress replacement cycles by demanding secure, biometric-ready handsets. Manufacturing localization exemplified by Lenovo’s USD 2 billion Saudi facility helps vendors offset foreign-exchange swings. Despite lingering grey-market channels and geopolitical hot spots, mission-critical use cases in oil, gas, and healthcare sustain premium demand even when broader consumer sentiment softens.
Key Report Takeaways
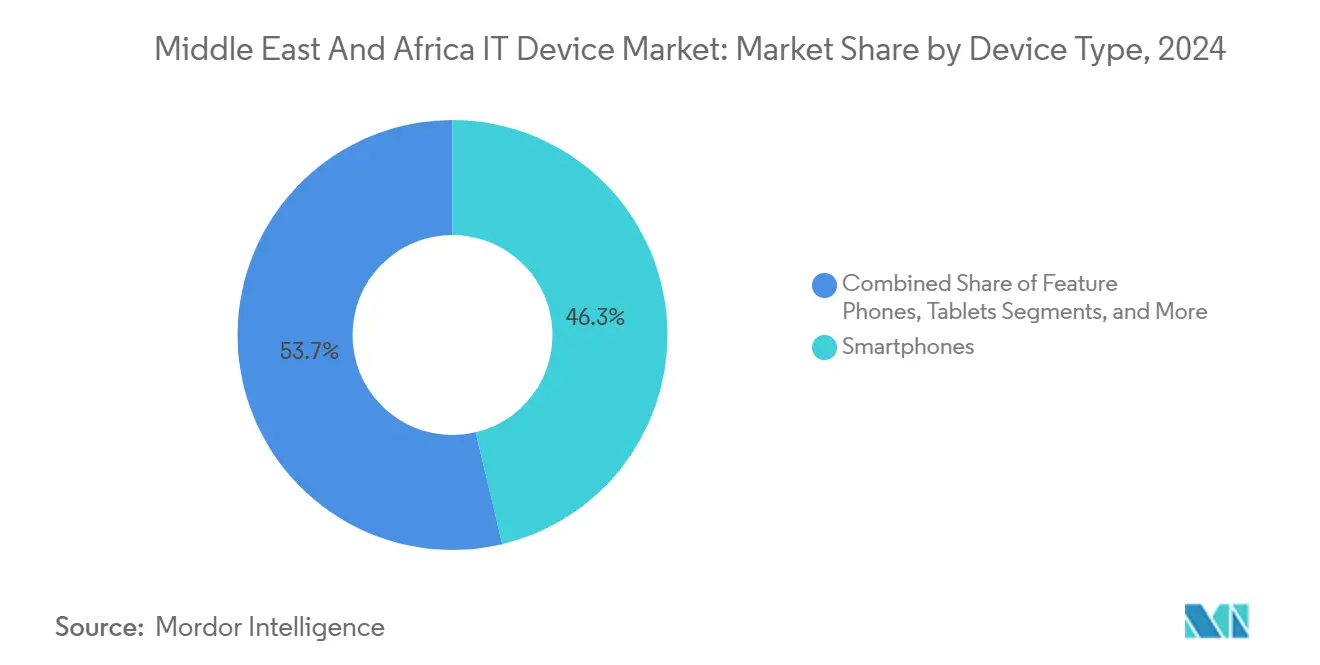
- By device type, smartphones led with 46.28% of the Middle East and Africa IT Device market share in 2024; wearables are forecast to expand at an 18.46% CAGR through 2030.
- By end user, consumer purchases commanded a 68.46% share of the Middle East and Africa IT Device market size in 2024, while the healthcare sector is set to advance at a 12.18% CAGR between 2025 and 2030.
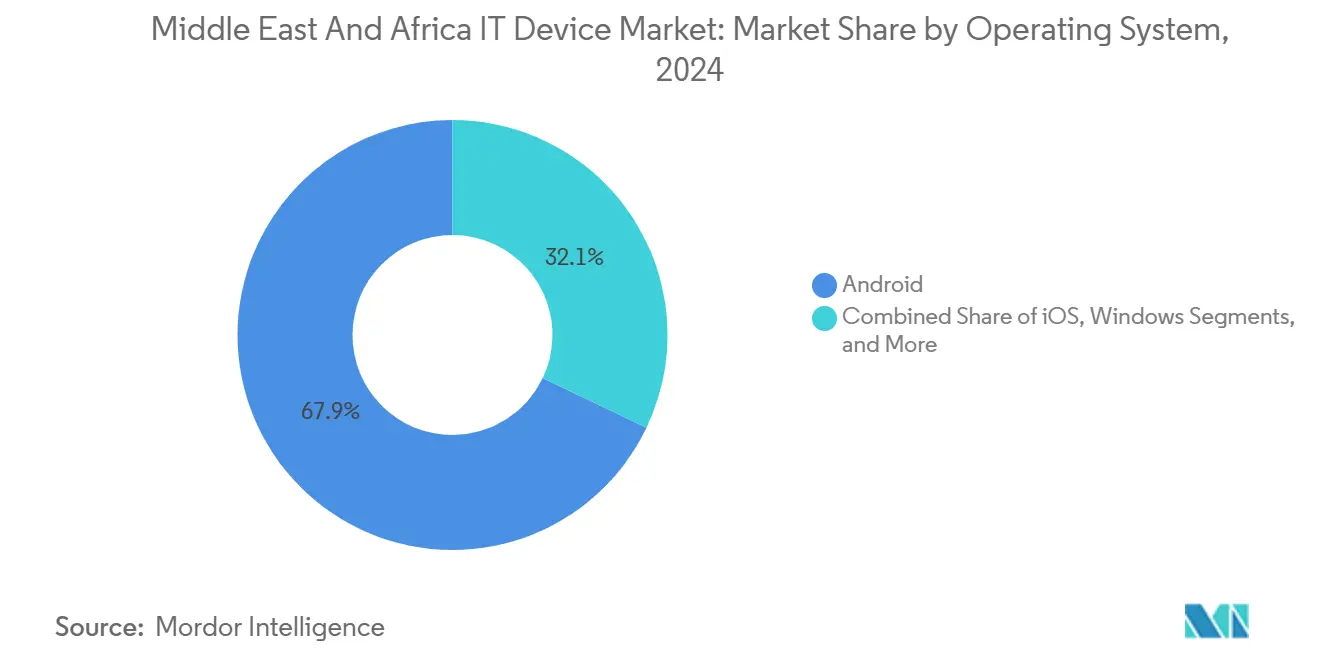
- By operating system, Android retained a 67.91% share in 2024; HarmonyOS is projected to grow at a 15.67% CAGR through 2030.
- By distribution channel, offline retail held 52.32% revenue share in 2024, whereas online marketplaces are rising at a 10.74% CAGR to 2030.
- By geography, the Middle East captured 57.56% revenue share in 2024, and Africa is forecast to post the fastest 8.98% CAGR through 2030.
Note: Market size and forecast figures in this report are generated using Mordor Intelligence’s proprietary estimation framework, updated with the latest available data and insights as of January 2026.
Middle East and Africa IT Device Market Trends and Insights
Drivers Impact Analysis*
| Driver | (~) % Impact on CAGR Forecast | Geographic Relevance | Impact Timeline |
|---|---|---|---|
| Rising Smartphone Penetration Among Youth | 1.30% | Middle East and Africa, strongest in rapidly urbanizing markets | Short term (≤ 2 years) |
| Expanding Fiber-To-The-Home Backbones Enabling Device Ecosystems | 1.10% | Middle East and Africa, led by GCC countries and South Africa | Medium term (2-4 years) |
| Government-Led Digital Transformation Initiatives (e.g., Saudi Vision 2030, Egypt Digital Strategy) | 1.00% | Saudi Arabia, Egypt, UAE, and other digitally focused economies | Medium term (2-4 years) |
| Rapid Growth of Fintech and Super-App Models Driving Mobile Device Upgrades | 0.90% | Middle East and Africa, particularly in Kenya, Nigeria, Egypt, and the GCC | Short term (≤ 2 years) |
| Uptake of Private 5G Networks in Oil and Gas Facilities | 0.60% | GCC countries, especially Saudi Arabia, UAE, and Qatar | Long term (≥ 4 years) |
| Emergence of Home-Grown ODMs Serving Ultra-Low-Cost Segments | 0.50% | Middle East and Africa, with growing manufacturing activity in Egypt and South Africa | Long term (≥ 4 years) |
| Source: Mordor Intelligence | |||
Rising Smartphone Penetration Among Youth
Youth cohorts are rewriting adoption curves by using handsets as the default gateway to banking, entertainment, and education. Mobile-internet reach in sub-Saharan Africa hit 28% in 2024, yet a 16-point gender gap means tens of millions of first-time buyers are still untapped.[1]GSMA, “Mobile Internet Penetration 2024,” gsma.com Middle East shipments climbed 2% year-on-year in Q3 2024, propelled by brands such as HONOR that posted 66% regional growth by emphasizing AI photography and gaming. Software-centric differentiation is shortening upgrade cycles even when hardware advances are incremental. Apple’s planned 2025 Saudi online store suggests premium youth demand can coexist with price sensitivity. Collectively, these dynamics funnel sustained volume into the Middle East and Africa IT Device market.
Expanding Fiber-To-The-Home Backbones Enabling Device Ecosystems
Gulf fiber penetration surpasses 70% in major cities, catalyzing demand for laptops, desktops, and smart TVs that benefit from low-latency fixed networks. Saudi 5G fixed-wireless access counted 1.4 million subscribers by mid-2024, driving sales of larger-screen devices for remote work and schooling. Kenya’s backbone expansion has already triggered public-sector tenders for advanced workstations equipped with Intel Core Ultra processors.[2]United Nations, “UNGM Laptop Tender Notices 2024,” ungm.org Cheaper, dependable broadband reduces the marginal cost of running multiple endpoints, shifting households toward diversified device portfolios. The halo effect raises average revenue per user, sustaining the Middle East and Africa IT Device market beyond smartphone refreshes.
Government-Led Digital Transformation Initiatives
Public mandates are aggregating demand at scale, insulating suppliers from consumer volatility. Saudi Vision 2030 allocated more than USD 50 billion to digital health, spawning bulk orders for bedside tablets, tele-consult laptops, and clinical-grade wearables. Egypt targets 80% e-government service coverage by 2025, generating workstation and secure-endpoint tenders across ministries. Kenya projects USD 0.4–2.5 billion in economic savings from connected diagnostics by 2030, further lifting procurement. Compliance standards such as ISO 27001 increasingly dictate device specifications, narrowing the competitive set to vendors with proven security credentials. These policy levers anchor long-term equipment demand, reinforcing the trajectory of the Middle East and Africa IT Device market.
Rapid Growth of Fintech and Super-App Models Driving Mobile Device Upgrades
Super-apps like MTN’s Ayoba and Orange’s Max it require NFC and biometric authentication, rendering older 3G-only phones obsolete. M-Pesa’s merchant-payment expansion has sparked demand for USD 100–200 Android handsets where Transsion’s Tecno and Infinix hold roughly half the African share. Security patches and performance needs, rather than hardware failure, now dictate replacement, favoring tightly integrated ecosystems. Apple’s iPhone captured 46% share in Saudi Arabia in 2024, reflecting this premium security appeal. Consequently, fintech adoption feeds directly into the Middle East and Africa IT Device market’s unit growth.
Restraints Impact Analysis*
| Restraint | (~) % Impact on CAGR Forecast | Geographic Relevance | Impact Timeline |
|---|---|---|---|
| Foreign-Exchange Volatility Inflating Import Costs | -1.20% | Middle East and Africa, most acute in import-dependent economies | Short term (≤ 2 years) |
| Sub-Optimal After-Sales Service Infrastructure Across Rural Areas | -1.00% | Middle East and Africa, particularly in underserved rural and remote regions | Medium term (2-4 years) |
| Persistent Grey-Market and Counterfeit Device Influx | -0.90% | Middle East and Africa, especially in price-sensitive consumer markets | Medium term (2-4 years) |
| Geopolitical Instability Dampening ICT Capital Expenditure | -0.80% | Middle East and Africa, concentrated in politically volatile economies | Long term (≥ 4 years) |
| Source: Mordor Intelligence | |||
Foreign-Exchange Volatility Inflating Import Costs
The naira lost 69.9% versus the dollar in 2024, lifting smartphone landing costs and pushing entry-level models beyond low-income reach.[3]Central Bank of Nigeria, “FX Rates 2024,” cbn.gov.ng Egypt’s pound devaluation sparked similar price jumps, encouraging smuggling to bypass VAT. Kenyan shilling swings added up to 15% to device tags, extending replacement cycles past three years. Vendors now hedge by localizing assembly. Lenovo’s USD 2 billion Saudi plant will invoice in riyals, yet sub-Saharan markets lack comparable scale. Currency risk, therefore, tempers the Middle East and Africa IT Device market’s near-term volume potential.
Sub-Optimal After-Sales Service Infrastructure Across Rural Areas
Large swaths of rural Africa and hinterland Middle East suffer from a dearth of authorized repair centers, forcing users to rely on informal technicians who often employ counterfeit parts. The resulting high failure rates diminish brand loyalty and elongate replacement timelines. OEMs experimenting with mobile service vans and mail-in programs face logistical and customs hurdles. Without reliable after-sales networks, warranty perceptions remain weak, capping the premium many consumers will pay. This service gap thus erodes the attainable value in the Middle East and Africa IT Device market.
*Our forecasts treat driver/restraint impacts as directional, not additive. The impact forecasts reflect baseline growth, mix effects, and variable interactions.
Segment Analysis
By Device Type: Healthcare Propels Wearables Beyond Smartphones
The wearables slice of the Middle East and Africa IT Device market is forecast to post an 18.46% CAGR, outstripping every other category, even as smartphones retained 46.28% revenue in 2024. Saudi partnerships with Orion Health to link 5,000 institutions and Kenya’s rollout of AliveCor ECG handsets exemplify clinical demand for continuous monitoring. As reimbursement models include remote-patient devices, hospitals procure at enterprise scale, embedding security and HL7 compliance requirements that favor medically certified brands.
Complementary upticks appear in laptops and tablets when telehealth portals and e-prescription systems require larger screens. Feature phones continue sliding as mobile-money platforms mandate Android or iOS, a trend that benefits vendors hawking sub-USD 50 4G smartphones. Desktops stay niche, serving CAD workloads in oil engineering or high-frequency trading in Gulf financial hubs. Fiber-enabled smart-TV adoption inches forward, though below 10% in most African homes. These dynamics illustrate how device growth now tracks vertical mandates more than discretionary refreshes, expanding the total Middle East and Africa IT Device market size linked to sector playbooks.


By End User: Healthcare Leaps Ahead of Consumer Spending
Consumers generated 68.46% of 2024 revenue, yet hospitals, clinics, and insurers are expected to deliver a 12.18% CAGR to 2030, the fastest among end users. Saudi digital health alone could unlock USD 15–27 billion in system savings, underpinning bulk orders for bedside tablets and connected wearables. Nigeria’s digital-health arena reached USD 1.27 billion in 2024 and approaches USD 2 billion by 2029, pulling diagnostic hardware into rural wards.
Government and defense deal flows remain steady, anchored by e-service portals demanding secure endpoints. Enterprises refresh fleets as hybrid work normalizes, yet procurement cadence hinges on macro cycles. Education adoption is sporadic, constrained by public budgets, though pilots in Kenya and South Africa deploy tablets for curriculum apps. Ultimately, healthcare’s shift from capex to subscription bundles stabilizes revenue, cementing its role as a lead driver of the Middle East and Africa IT Device market.
By Operating System: HarmonyOS Carves Out Sovereignty-Focused Niche
Android held 67.91% share in 2024, but HarmonyOS is poised for a 15.67% CAGR amid buyers seeking geopolitical insulation. Huawei’s HarmonyOS 5.0 now hosts 15,000 native apps and omits Android compatibility, signaling a break toward self-contained ecosystems. Saudi data-sovereignty laws and Huawei Cloud’s AI zone amplify appeal for public-sector workloads.
iOS holds a premium enclave 46% share in Saudi Arabia thanks to tight hardware-software coupling and robust update policies. Windows dominates enterprise PCs, while Linux and ChromeOS address education and dev-ops niches. As compliance overtakes app-count as a purchase criterion, OS fragmentation deepens. This broadens strategic options but also multiplies integration challenges, shaping competitive dynamics within the Middle East and Africa IT Device market.
By Distribution Channel: Online Marketplaces Close Gap With Brick-and-Mortar
Offline shops still captured 52.32% of 2024 sales, reflecting consumer need to test devices, access financing, and arrange same-day repairs. Yet online channels will advance at a 10.74% CAGR, propelled by Africa’s e-commerce doubling from USD 55 billion in 2024 to USD 113 billion in 2029 and by Amazon’s 2024 South Africa launch. Mobile-money penetration above 50% in East Africa removes payment friction, while Jumia’s 23 million monthly visits illustrate maturing logistics.
Telco bundles persist where prepaid dominates but lose ground as buyers prefer unlocked devices shipped from warehouse to doorstep. Corporate and government procurement cycles add steady baseline volume, albeit with protracted tendering. Overall, the omnichannel pivot increases competitive transparency and pressures margins but widens reach, further enlarging the Middle East and Africa IT Device market size accessible to digitally savvy sellers.
Geography Analysis
Regional revenue skewed 57.50% toward the Middle East in 2024, and the bloc is slated to post a steady 6.52% CAGR to 2030. Saudi Arabia’s USD 50 billion digital-health budget and Lenovo’s USD 2 billion plant signal an intensifying premium hardware focus.[4]Lenovo, “Alat Convertible Bond Filing 2024,” lenovo.com Private 5G at ADNOC supports thousands of rugged devices, validating high-ticket demand even in volatile oil cycles. Turkey’s 12.2 million 2024 smartphone shipments and Apple’s impending flagship in Diriyah underscore growing affluent segments. Compliance rules such as ISO 27001 tilt specifications toward secure, enterprise-grade builds, boosting average selling prices.
Africa is forecast for an 8.90% CAGR, the fastest among sub-regions, powered by 623 million projected unique mobile subscribers by 2025. Transition’s 201 million global shipments cater to price-sensitive first-time users, even as revenue and net income fell in 2024 amid Xiaomi and Realme price undercuts. South Africa’s online retail will surpass USD 72 billion by 2026, while Kenya expects USD 0.4–2.5 billion in healthcare savings from connected devices. Currency swings and grey channels remain structural headwinds: the naira’s 69.9% drop piles cost onto imports, and Egyptian smuggling once accounted for 80% of handset inflow before 2025 registration rules.
Smaller Middle Eastern economies Egypt, Jordan, Lebanon face fiscal constraints yet leverage digitization drives like Egypt’s IMEI program to formalize sales. Secondary African markets such as Ghana and Cameroon ride spillover effects from regional e-commerce networks; Ghana’s medical-tech space will grow from USD 281 million in 2024 to USD 414 million by 2029. Ultimately, fiber coverage and mobile-money penetration not GDP alone best predict device-market expansion, guiding vendor allocation across the Middle East and Africa IT Device market.
Competitive Landscape
Global majors Samsung, Apple, and Huawei dominate premium tiers, while Transsion leads entry-level smartphones with up to 50% African share despite a 7.2% revenue dip and 41% profit slide in 2024. Lenovo’s Riyadh plant, operational by 2026, seeks to lift regional revenue from USD 1.25 billion to USD 6 billion within three years by hedging tariff and forex risks. HONOR, Transsion, and Xiaomi jointly shipped almost half of Middle East smartphones in 2024, with HONOR up 66% on youth-centric AI features.
Differentiation is shifting toward ecosystem depth. Huawei’s HarmonyOS 5.0 skips Android, positioning itself for data-sovereign government deals, while Huawei Cloud’s local AI stack further binds hardware to services. Apple’s Diriyah flagship and local online storefront bank on brand loyalty and secure payments to defend high ASPs. ODM newcomers in Nigeria and Egypt forge rugged tablets for field engineers and pay-as-you-go smartphones for informal workers, exploiting niches the giants overlook.
Jumia integrates device installments with mobile wallets, and telco operators bundle 5G phones with enterprise edge services. Lenovo forecasts AI PCs to hit 25% of 2025 shipments regionally, scaling to 80% by 2027, opening a new premium battlefront. Overall, moderate fragmentation persists, but vertical-solution capability is becoming the decisive advantage across the Middle East and Africa IT Device industry.
Middle East and Africa IT Device Industry Leaders
Samsung Electronics Co., Ltd.
Apple Inc.
Huawei Technologies Co., Ltd.
Lenovo Group Limited
Dell Technologies Inc.
- *Disclaimer: Major Players sorted in no particular order

Recent Industry Developments
- January 2025: Egypt launched an electronic mechanism for mobile-phone registration requiring IMEI verification within 90 days of entry, aiming to formalize grey-market channels where 80% of phones previously arrived via smuggling.
- November 2024: Apple announced an online Apple Store for Saudi Arabia in summer 2025 and physical flagships from 2026 after investing SAR 10 billion since 2019.
- October 2024: Huawei unveiled HarmonyOS 5.0 beta with 15,000 native apps, severing Android compatibility to deepen ecosystem independence.
- October 2024: Samsung Pay went live in Saudi Arabia after an agreement with the Saudi Central Bank, expanding NFC payment adoption


Middle East and Africa IT Device Market Report Scope
The Middle East and Africa IT Device Market includes the sales and adoption of a broad range of consumer and enterprise technology devices across the region. It spans smartphones, feature phones, tablets, laptops, desktops, wearables, and smart TVs/OTT devices, serving end-users in the consumer, enterprise, government, defense, education, and healthcare sectors. The market also covers multiple operating systems and diverse distribution channels, including offline and online retail, direct enterprise procurement, and telco-led bundled sales.
The Middle East and Africa IT Device Market Report is Segmented by Device Type (Smartphones, Feature Phones, Tablets, Laptops and Notebooks, Desktops and Workstations, Wearables, Smart TVs and OTT Devices), End User (Consumer, Enterprise, Government and Defense, Education, Healthcare), Operating System (Android, iOS, Windows, Linux and ChromeOS, HarmonyOS and Others), Distribution Channel (Offline Retail, Online Retail and Marketplaces, Direct Enterprise Sales, Telco-Led Bundled Sales), and Geography (Middle East, Africa). The Market Forecasts are Provided in Terms of Value (USD).
By Device Type
| Smartphones |
| Feature Phones |
| Tablets |
| Laptops and Notebooks |
| Desktops and Workstations |
| Wearables |
| Smart TVs and OTT Devices |
By End User
| Consumer |
| Enterprise |
| Government and Defense |
| Education |
| Healthcare |
By Operating System
| Android |
| iOS |
| Windows |
| Linux and ChromeOS |
| HarmonyOS and Others |
By Distribution Channel
| Offline Retail |
| Online Retail and Marketplaces |
| Direct Enterprise Sales |
| Telco-Led Bundled Sales |
By Geography
| Middle East | Saudi Arabia |
| United Arab Emirates | |
| Turkey | |
| Rest of Middle East | |
| Africa | South Africa |
| Kenya | |
| Rest of Africa |
| By Device Type | Smartphones | |
| Feature Phones | ||
| Tablets | ||
| Laptops and Notebooks | ||
| Desktops and Workstations | ||
| Wearables | ||
| Smart TVs and OTT Devices | ||
| By End User | Consumer | |
| Enterprise | ||
| Government and Defense | ||
| Education | ||
| Healthcare | ||
| By Operating System | Android | |
| iOS | ||
| Windows | ||
| Linux and ChromeOS | ||
| HarmonyOS and Others | ||
| By Distribution Channel | Offline Retail | |
| Online Retail and Marketplaces | ||
| Direct Enterprise Sales | ||
| Telco-Led Bundled Sales | ||
| By Geography | Middle East | Saudi Arabia |
| United Arab Emirates | ||
| Turkey | ||
| Rest of Middle East | ||
| Africa | South Africa | |
| Kenya | ||
| Rest of Africa | ||


Key Questions Answered in the Report
What is the projected value of the Middle East and Africa IT Device market by 2030?
It is expected to reach USD 19.36 billion, reflecting a 6.52% CAGR through the period.
Which device category will grow fastest across the region?
Wearables, propelled by healthcare digitization mandates, are forecast to rise at an 18.46% CAGR to 2030.
How significant is online retail for device sales?
Online marketplaces are expanding at a 10.74% CAGR and are closing in on offline retails 2024 lead of 52.32% revenue share.
Why is HarmonyOS gaining traction?
The platform aligns with data-sovereignty requirements and offers a growing native-app base, supporting a 15.67% forecast CAGR.
Which geographic segment is set for the highest growth?
Africa is projected to achieve an 8.98% CAGR, fueled by mobile-subscriber additions and ultra-low-cost handset availability.
How are vendors countering foreign-exchange volatility?
Strategies include local assembly plants, such as Lenovos upcoming Riyadh facility, invoicing in local currency to hedge dollar swings.
Page last updated on:


