
South Africa Data Center Server Market Size and Share
Market Overview
| Study Period | 2020 - 2031 |
|---|---|
| Forecast Data Period | 2026 - 2031 |
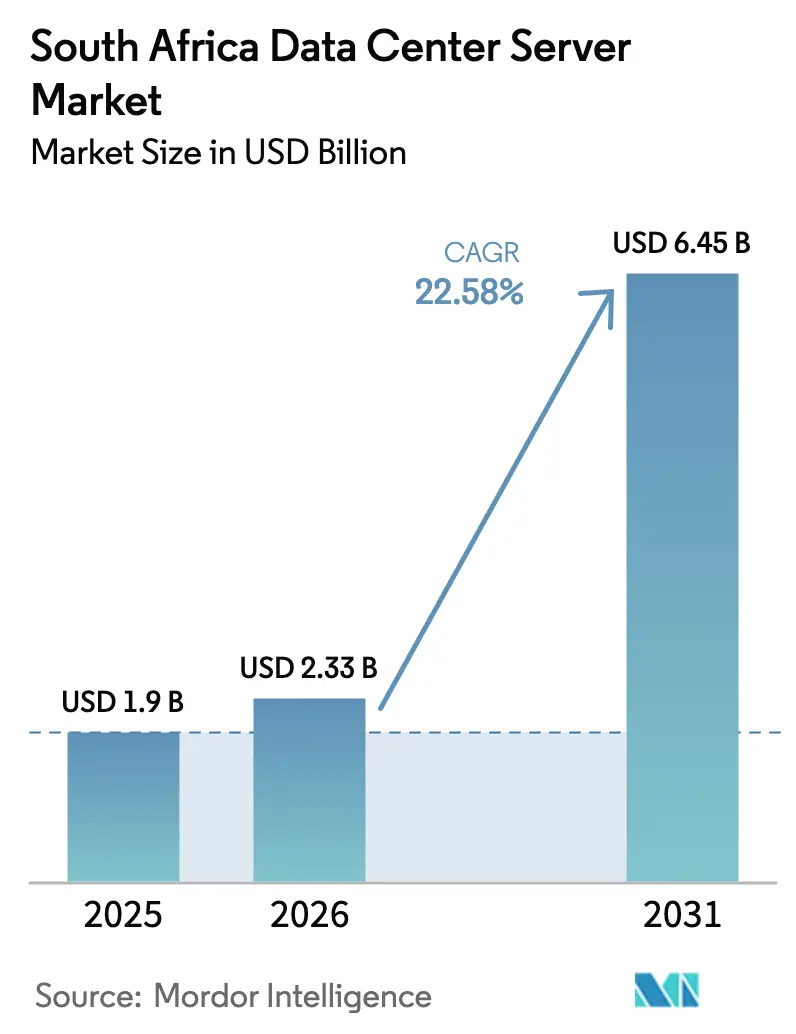
| Base Year Market Size (2025) | USD 1.9 Billion |
| Market Size (2026) | USD 2.33 Billion |
| Market Size (2031) | USD 6.45 Billion |
| Growth Rate (2026 - 2031) | 22.58 % |
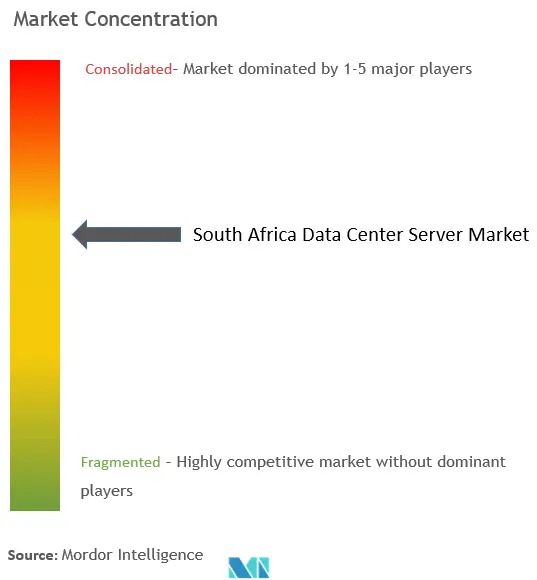
| Market Concentration | Medium |
Major Players *Disclaimer: Major Players sorted in no particular order Image © Mordor Intelligence. Reuse requires attribution under CC BY 4.0. | |
South Africa Data Center Server Market Analysis by Mordor Intelligence
The South Africa data center server market size is expected to grow from USD 1.9 billion in 2025 to USD 2.33 billion in 2026 and is forecast to reach USD 6.45 billion by 2031 at 22.58% CAGR over 2026-2031. Expansion is underpinned by local data-sovereignty rules, accelerated cloud migration, and rising artificial-intelligence workloads that collectively re-shape server procurement patterns. Hyperscalers choose Johannesburg as their continental gateway, a decision reinforced by NAPAfrica Internet Exchange surpassing 5 Tbps of peak traffic in 2025. At the same time, Protection of Personal Information Act mandates and local content-hosting rules sustain on-premises capacity investments even as enterprises embrace hybrid cloud. Intensifying power constraints make renewable power purchase agreements a competitive differentiator, while one-year GPU refresh cycles are shortening hardware life spans and lifting replacement demand.
Key Report Takeaways
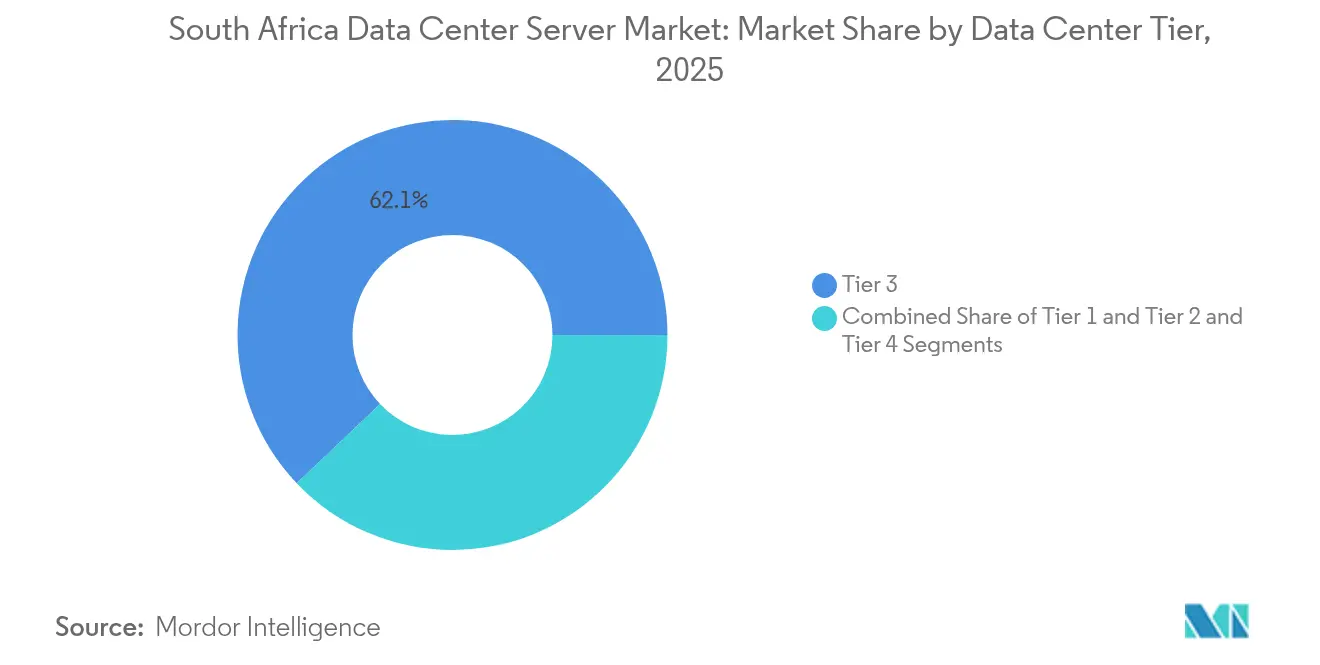
- By data-center tier, Tier 3 facilities led with 62.10% revenue share in 2025; Tier 4 is projected to expand at a 24.62% CAGR through 2031.
- By form factor, half-height blades held 54.60% of the South Africa data center server market share in 2025, whereas quarter-height micro-blades are on track to grow at 25.07% CAGR to 2031.
- By workload, virtualization and private cloud accounted for 38.70% of 2025 deployments, while AI/ML workloads are set to grow at 26.22% CAGR.
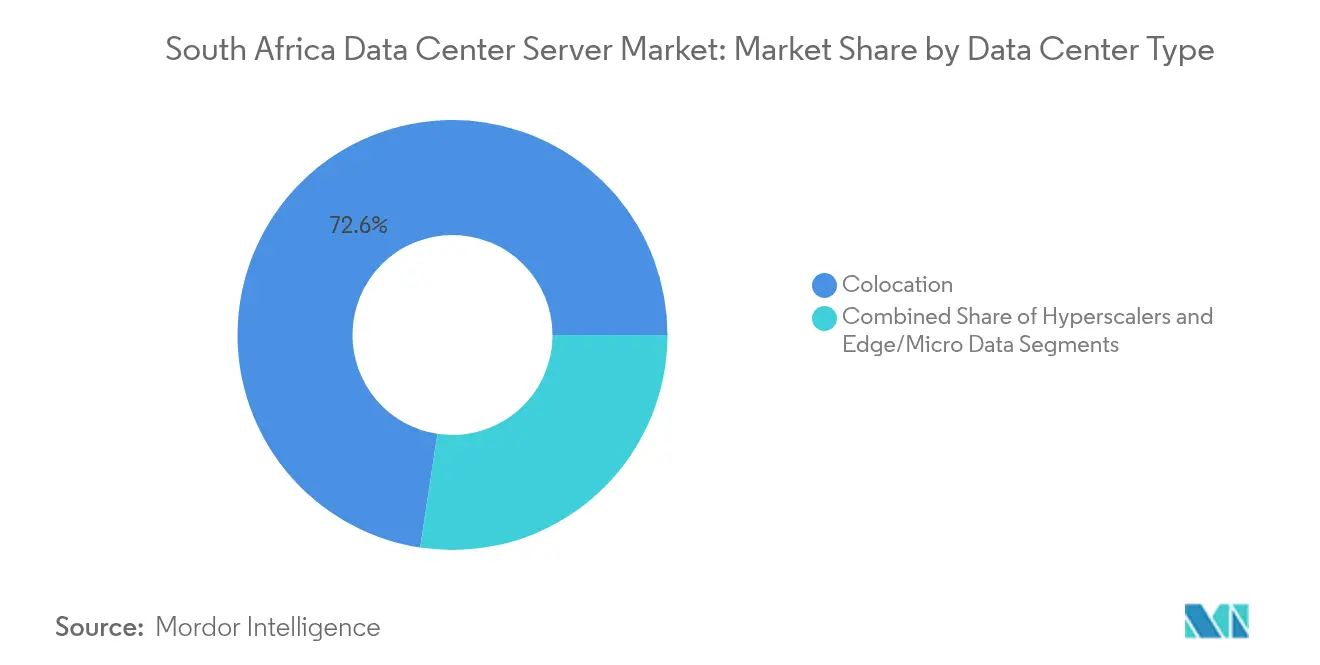
- By data-center type, colocation commanded 72.60% share of the South Africa data center server market size in 2025; hyperscaler facilities will post a 27.05% CAGR to 2031.
- By end-use industry, IT and telecoms led with 30.70% revenue share in 2025, but manufacturing workloads are projected to enlarge at 27.68% CAGR.
Note: Market size and forecast figures in this report are generated using Mordor Intelligence’s proprietary estimation framework, updated with the latest available data and insights as of 2026.
South Africa Data Center Server Market Trends and Insights
Drivers Impact Analysis*
| Driver | (~) % Impact on CAGR Forecast | Geographic Relevance | Impact Timeline |
|---|---|---|---|
| Accelerated cloud-first strategies | +4.2% | Johannesburg, Cape Town, national | Medium term (2-4 years) |
| Surge in AI/ML and edge workloads | +5.8% | National, led by finance and telecoms | Short term (≤ 2 years) |
| Rapid fibre roll-outs by Telkom, DFA, MTN | +3.1% | Metropolitan corridors | Medium term (2-4 years) |
| Sub-1 ms cross-connect demand at new IXs | +2.3% | Johannesburg | Short term (≤ 2 years) |
| Local content-hosting mandates | +3.7% | National | Long term (≥ 4 years) |
| Eskom green-tariff pilot for PPA adoption | +2.9% | Renewable-energy zones | Long term (≥ 4 years) |
| Source: Mordor Intelligence | |||
Accelerated Cloud-First Strategies Among Enterprises
A national pivot toward public-cloud adoption sees the domestic cloud services market tripling to ZAR 113 billion by 2028, compelling enterprises to redesign server estates around hybrid and multi-cloud architectures. Google Cloud’s Johannesburg region, preferred by 43% of local businesses, anchors demand for servers that marry local data residency with hyperscale performance. Financial institutions lead the shift, migrating core workloads yet retaining compliant, high-density blades for sensitive data. The National Data and Cloud Policy solidifies this dual-footprint model, sustaining local capacity even as off-premises usage grows.[1] Vendors that integrate seamless cloud interconnects, on-premises compliance features, and GPU readiness capture a disproportionate share in the South Africa data center server market.
Surge in AI/ML and Edge Workloads Requiring High-Density Servers
AI workloads accelerate GPU adoption and push power densities above 25 kW per rack, driving a redesign of cooling regimes.[2] Dell, Lenovo, and Supermicro now refresh GPU nodes annually to align with Nvidia’s release cadence. Healthcare illustrates this pivot: the National Health Laboratory Service roadmap calls for AI-enabled diagnostics that depend on local, high-density compute clusters.[3] Simultaneously, manufacturing and telecom operators deploy edge servers to process sensor data in real time, reducing backhaul latency. These workloads amplify the South Africa data center server market’s appetite for liquid-cooled micro-blade platforms that pack maximum GPU horsepower into constrained footprints.
Rapid Fibre-to-the-Data-Centre Roll-outs by Telkom, DFA and MTN
More than 165,000 km of Telkom fibre and multi-billion-rand builds by Dark Fibre Africa and MTN shorten latency and widen access to carrier-neutral facilities. As prices fall, enterprises distribute disaster-recovery nodes between Johannesburg and Cape Town, expanding addressable server demand. Residential fibre, led by Vumatel’s 1.9 million-home footprint, fuels edge-content caching near consumers. SA Connect targets nationwide broadband coverage, opening rural markets to micro data-centres and edge servers. Robust backhaul is therefore a structural enabler of the South Africa data center server market’s long-term growth.
Local Content-Hosting Mandates in POPIA and Film and Publication Board Act
POPIA requires that personal data be processed on South African soil, locking in local compute needs for banks, healthcare providers, and media firms. Streaming platforms must store copies of licensed content locally, spurring demand for high-capacity storage arrays. Healthcare providers adopt in-country AI platforms to comply with stringent patient-data rules. By compelling on-shore processing, these statutes guarantee a persistent expansion path for the South Africa data center server market, even as global cloud offerings mature.
Restraints Impact Analysis*
| Restraint | (~) % Impact on CAGR Forecast | Geographic Relevance | Impact Timeline |
|---|---|---|---|
| Escalating construction CapEx on metal price spikes | -2.8% | Nationwide | Short term (≤ 2 years) |
| Chronic grid-power instability and diesel reliance | -3.4% | Industrial zones | Medium term (2-4 years) |
| Import duties of 5%–15% on fully-assembled servers | -1.9% | Ports and free-trade zones | Short term (≤ 2 years) |
| Skills shortage limiting Industry 4.0 implementation | -1.6% | Manufacturing clusters | Long term (≥ 4 years) |
| Source: Mordor Intelligence | |||
Escalating Construction CapEx Amid Steel, Copper and Lithium Price Spikes
Raw-material volatility inflates shell-and-core costs, delaying commissioning cycles and reducing free cash for server refreshes. Copper price surges strain electrical and cooling budgets, while lithium costs lift battery-UPS expenditure. Operators counter this pressure with modular builds and off-site prefabrication, yet up-front capital intensity still tempers the South Africa data center server market’s tempo. Larger incumbents leverage scale purchasing, widening the gap over smaller entrants.
Chronic Grid-Power Instability Driving Costly Diesel Backup
Despite a slowdown in rotational power cuts, Eskom’s tariff reform and supply constraints elevate operating costs. Data-centre operators maintain diesel gensets and battery strings, pushing energy overheads to 65% of operational spend during peak outages. Teraco and others sign long-term wind-and-solar PPAs to hedge, but capital outlays delay ROI. Power insecurity therefore caps expansion velocity across the South Africa data center server market and accelerates demand for energy-efficient servers.
*Our forecasts treat driver/restraint impacts as directional, not additive. The impact forecasts reflect baseline growth, mix effects, and variable interactions.
Segment Analysis
By Data-Center Tier: Mission-Critical Infrastructure Drives Tier 4 Growth
Tier 3 facilities held 62.10% of 2025 revenue, giving them leadership within the South Africa data center server market. Banks, insurers, and public-sector agencies trust Tier 3 for a balance of uptime and cost. Tier 4 supply, although only a fraction today, will post a 24.62% CAGR to 2031 as hyperscalers standardize on fault-tolerant architecture. This shift raises the South Africa data center server market size for advanced power distribution, redundant feeds, and liquid-cooling systems. POPIA and the National Data and Cloud Policy further tilt decisions toward higher tiers that guarantee compliance.
Mission-critical workloads such as digital payments require 99.995% availability, prompting migration to Tier 4 halls in Johannesburg. Multinational cloud providers replicate global design templates that specify concurrent maintainability, elevating local engineering standards. Tier 1 and Tier 2 remain cost-effective for edge nodes where latency trumps redundancy. Overall, premium-tier take-up boosts demand for high-density, hot-swappable blades and GPU shelves across the South Africa data center server market.

By Form Factor: Micro-Blades Emerge as Edge Computing Catalyst
Half-height blades secured 54.60% revenue in 2025, reflecting a legacy of enterprise virtualization. Edge deployments, however, elevate quarter-height and micro-blades, which will expand at 25.07% CAGR. Telecommunications operators place micro-blades in 5G base-station shelters, reducing backhaul and enabling real-time analytics. Manufacturing plants adopt ruggedized variants to facilitate predictive maintenance. Liquid-cooling solutions launching in 2025 unlock rack densities above 70 kW, a milestone that enlarges the South Africa data center server market size for compact form factors.
Space-constrained colocation cages in Cape Town also adopt micro-blades to optimise rack revenue. Full-height blades remain relevant for research and rendering workloads that need maximum memory channels. Vendors that align design roadmaps with one-year GPU cadences seize opportunity, as enterprises refresh earlier to secure AI horsepower.
By Application/Workload: AI/ML Acceleration Reshapes Computing Demands
Virtualization and private cloud kept a 38.70% slice of 2025 consumption, anchoring steady revenue for conventional x86 nodes. Yet AI/ML training racks will grow at 26.22% CAGR to 2031, powered by finance, healthcare, and mining analytics. GPU scarcity raises lead times, hence hyperscalers reserve allocations a year ahead. High-performance computing remains essential for weather research and seismic exploration, maintaining a smaller but stable footprint in the South Africa data center server market.
Edge and IoT gateways proliferate, processing telemetry in milliseconds and feeding centralized clusters for deeper inference. Regulatory pressures confine sensitive patient and transaction data to in-country AI clusters, reinforcing local demand. Consequently, purpose-built GPU servers enlarge the South Africa data center server market share for accelerated computing platforms.
By Data-Center Type: Hyperscalers Drive Infrastructure Modernisation
Colocation dominated with 72.60% share in 2025 as enterprises outsourced real estate and operations. Google, Microsoft, and AWS now localize capacity, lifting hyperscaler CAGR to 27.05%. Their arrival scales the South Africa data center server market through bulk purchasing, 100 MW campuses, and subsea cable anchoring. Enterprise data-centres, while declining in proportion, still upgrade internal nodes for compliance and latency-sensitive systems.
Edge micro-datacentres multiply across retail malls and mining sites, where sub-10 ms latency boosts application performance. These compact sites rely on micro-blades and fan-less designs, carving a new layer in the South Africa data center server industry. Vendors that preload infrastructure for hyperscaler specifications secure predictable multi-year demand streams.
By End-Use Industry: Manufacturing Digitisation Accelerates Despite Readiness Gaps
IT and telecoms retained 30.70% revenue in 2025, owing to network-function virtualisation and cloud hosting. Manufacturing, though less mature, will scale server demand at 27.68% CAGR, led by automotive and mining. These sectors deploy IoT sensors and AI inspection systems that require rugged edge nodes, enlarging the South Africa data center server market size for industrial-grade gear. BFSI sustains investment in encryption-capable blades to satisfy financial regulators, while healthcare adopts GPU clusters for imaging diagnostics and electronic records.
Skills shortages and capex constraints hamper many small factories. Import-duty regimes favour local assembly, encouraging OEMs to partner with contract manufacturers. Government grants under the Industrial Policy Action Plan provide funding for pilot smart-factory projects, indirectly supporting server uptake. As Industry 4.0 adoption widens, cross-sector diversification stabilises revenue across the South Africa data center server market.
Geography Analysis
Johannesburg and Cape Town account for an estimated 78% of installed racks, driven by dense fibre backbones, subsea cable landings, and skilled labour. Johannesburg’s interconnection ecosystem grew rapidly after NAPAfrica crossed the 5 Tbps threshold, supporting low-latency east-west traffic flows. Cape Town benefits from renewable-energy corridors that mitigate grid risk and from WACS and Equiano cable gateways connecting to Europe, which diversify supply inside the South Africa data center server market.
Beyond the metros, Durban and Port Elizabeth attract disaster-recovery nodes and content caches that serve coastal populations. DFA’s 16 million-rand build-out in Secunda links petrochemical and mining operations to core clouds, unlocking new edge opportunities. SA Connect’s rural broadband agenda will push micro-data-centre rollouts into Northern Cape solar hubs, where abundant sun supports off-grid server clusters.
South Africa further positions itself as a regional hub for the Southern African Development Community members. Cross-border enterprises shift workloads to Johannesburg to leverage mature peering, while content-delivery networks store popular media closer to Zambia, Botswana, and Mozambique audiences. Consequently, geographic diversification balances risk and sustains expansion across the South Africa data center server market.
Regulatory Landscape
South Africa's data center server deployments are shaped by data-residency and government-cloud requirements, led by the Protection of Personal Information Act (POPIA) and the National Data and Cloud Policy published in May 2024. The policy pushes government-used facilities toward high-availability design (including 99.995% fault-tolerant requirements for qualifying use cases) and adds siting and resource-sufficiency expectations, such as electricity and water self-sufficiency, which feeds into server specifications around power efficiency, redundancy, and on-site resilience.
In 2026, proposed telecom infrastructure reforms also affect build timelines and interconnection density for data-center campuses. The Electronic Communications Amendment Bill (2026) aims to support more efficient infrastructure deployment and facilities leasing to improve competition, aligning with prior market recommendations, while ICASA continues spectrum and planning work, including January 2026 hearings on the Second Draft National Radio Frequency Plan. For public-sector demand, sourcing and operational controls flow through State Information Technology Agency (SITA) procurement and service-level governance, with security requirements anchored to the Minimum Information Security Standards (MISS), sustaining demand for compliant on-shore compute and storage.
Competitive Landscape
Competition remains moderate as no vendor exceeds a 15% revenue slice, yet technological churn intensifies. Dell, Lenovo, HPE, and Supermicro pivot to annual GPU cycles, eroding advantages of slower-moving rivals. Liquid cooling emerges as a differentiation lever: Supermicro plans to equip 15% of new halls with direct-chip liquid loops, reducing rack PUE to 1.1. Local assemblers exploit 5%–15% import tariffs to offer POPIA-compliant systems at lower landed cost, attracting state-owned enterprises and mid-tier banks.
Huawei courts municipal cloud and smart-city contracts, bundling servers with networking and surveillance suites. HPE emphasises GreenLake Private Cloud AI, bundling consumption-based pricing that resonates with CFOs seeking opex models. Suppliers providing holistic power-usage analytics and compliance dashboards gain traction inside the South Africa data center server market because operators must justify energy spend to boards and regulators.
White-space opportunities cluster around edge infrastructure for mining and agro-processing, where rugged servers encounter little incumbent presence. Channel partners with engineering services for industrial environments enjoy higher margins. Overall, hardware vendors that translate global product roadmaps into locally compliant, power-efficient bundles capture leadership.
South Africa Data Center Server Industry Leaders
-
Dell Inc.
-
Hewlett Packard Enterprise
-
Lenovo Group Limited
-
Huawei Technologies Co., Ltd.
-
International Business Machines Corp.
- *Disclaimer: Major Players sorted in no particular order
Market Opportunities and Future Outlook
The 2026 policy positioning of data centres as strategic infrastructure, placed alongside priority sectors such as electricity and transport in public signaling by Finance Minister Enoch Godongwana (February 2026), creates whitespace for faster project pipelines and investment mechanisms that translate into server demand through new build-outs and refresh cycles. Live critical IT capacity is estimated at 300 MW to 350 MW, with an additional 120 MW to 200 MW under construction or announced as of 2025. Suppliers that package energy-aware configurations (high-efficiency power profiles, higher density platforms, and cooling-ready designs) have a clearer route to win deployments where grid constraints and cost-to-serve are central procurement filters.
On the demand side, South Africa's on-shore cloud footprint and interconnection growth support continued local server procurement rather than offshore consumption. Hyperscalers and major cloud platforms (AWS, Google, Microsoft) maintain in-country regions, and Johannesburg's role as an interconnection hub is reinforced by NAPAfrica surpassing 5 Tbps peak traffic in 2025, which increases the value of low-latency, locally hosted workloads. Opportunities concentrate in AI/ML and regulated industries that must keep sensitive data in-country under POPIA and government-cloud requirements, alongside edge builds supported by ongoing fibre roll-outs and initiatives such as SA Connect, which broaden viable locations for micro data centres and ruggedized edge server nodes.
Recent Industry Developments
- May 2026: Huawei unveiled AI-ready data infrastructure offerings for South African enterprises, highlighting full-stack data centre virtualization and OceanStor Dorado storage as part of its local push. The move supports higher-density, AI-oriented server estates and strengthens vendor pull-through into colocation and enterprise modernisation programs.
- April 2026: Hewlett Packard Enterprise rolled out its ProLiant Gen12 compute platform in South Africa, positioning it for workload consolidation, energy efficiency, and security anchored by Silicon Root of Trust capabilities. This refresh expands the addressable market for new server platforms as operators respond to tighter power and security requirements.
- February 2026: The Minister of Communications and Digital Technologies recommended approval of Dell's 10-year, R230 million Equity Equivalent Investment Programme (EEIP) renewal to the Department of Trade, Industry and Competition. The action reinforces Dell's long-term commitment to the local ICT ecosystem, supporting channel capacity and local programs that influence enterprise and data-centre server purchasing decisions.
Research Methodology Framework and Report Scope
Market Definition and Coverage
This market covers the annual revenue value of servers purchased for use inside data centers located in South Africa, including new deployments and planned refresh cycles across enterprise, colocation, and cloud facilities.
Scope exclusions: We exclude end-user devices and networking gear (such as storage-only appliances, switches, and routers) and we do not count construction or facility CAPEX that sits outside server hardware spending.
Segmentation Overview
- By Data-Center Tier
- Tier 1 and 2
- Tier 3
- Tier 4
- By Form Factor
- Half-height Blades
- Full-height Blades
- Quarter-height / Micro-blades
- By Application / Workload
- Virtualisation and Private Cloud
- High-Performance Computing (HPC)
- Artificial Intelligence/Machine Learning and Data Analytics
- Storage-centric
- Edge / IoT Gateways
- By Data Center Type
- Hyperscalers/Cloud Service Provider
- Colocation Facilities
- Enterprise and Edge
- By End-use Industry
- BFSI
- IT and Telecom
- Healthcare and Life-Sciences
- Manufacturing and Industry 4.0
- Energy and Utilities
- Government and Defence
Data Sources, Market Sizing, and Validation
Desk Research
Desk research started by building a fact base on South Africa data center capacity expansion, power constraints, and the timing of new builds, since these directly shape server procurement cycles. Public sources reviewed include items such as Statistics South Africa for macro indicators, ICASA publications for telecom context, South African Reserve Bank releases for currency and inflation context, and South African government gazettes and policy notes linked to data protection and digital services.
We also used supporting materials like company annual reports, investor presentations, press releases, and association or exchange updates to confirm build pipelines and demand drivers. In addition, a few paid subscriptions were used for company financials and intelligence, news and financials tracking, and patent databases to spot shifts in compute architecture and refresh intensity. The desk sources named here are illustrative, and many other references were also used to collect inputs, validate assumptions, and resolve data gaps.
Primary Interviews and Surveys
Primary work was used to pressure-test how buying behavior differs by facility type in South Africa, and to confirm what drives refresh timing (power availability, workload mix, and sourcing lead times). We spoke with a mix of data center operators, system integrators, server channel participants, and enterprise IT decision-makers, which helped validate assumptions taken from desk research and close gaps where public data is thin.
Distribution of primary research fieldwork respondents
| Company type | Respondent position |
|---|---|
| Top tier: 37% | CXOs: 21% |
| Mid tier: 41% | Functional/Unit leaders: 22% |
| Smaller Players: 22% | Managers: 57% |
Market-Sizing & Forecasting
Sizing was built using a top-down and bottom-up approach where data center build activity and demand signals in South Africa were translated into server spending, and then corrected using selective bottom-up checks from supplier and channel feedback. To keep the model grounded, we used inputs such as planned IT load additions and utilization direction, typical server refresh cycles by workload, mix shifts between CPU-focused and accelerator-led configurations, rack density trends tied to power and cooling limits, and imported hardware lead time expectations that influence purchase timing.
Bottom-up approximations were used as reasonableness checks, such as sampled average selling price ranges by form factor multiplied by indicative unit volumes for major facility types, followed by channel checks to confirm whether pricing moved due to component constraints. Forecasts were produced using scenario analysis, since local power reliability, currency movement, and hyperscaler expansion timing can change year-to-year outcomes. Where a direct volume signal was missing, we applied conservative proxy ratios from interview feedback, and then we rechecked totals against the implied spending per MW trend to avoid overstatement.
Data Validation & Update Cycle
Outputs were validated through multiple passes where assumptions, units, and year-on-year changes were reviewed, and then compared against independent market signals like announced capacity, commissioning timelines, and observed refresh behavior. When large variances showed up, the underlying drivers were re-opened, and targeted re-contacts were triggered to confirm whether the issue came from pricing, mix, or timing.
Before sign-off, a second analyst review is completed to check internal consistency across inputs and to confirm that the narrative matches the model. Reports are refreshed annually, and interim updates are made when material events occur that can shift demand or pricing. Right before delivery, a final update pass is completed so clients receive the most current view available.
Mordor Intelligence's South Africa Data Center Server Market Size Versus Other Published Estimates
Published market values for South Africa data center servers can look far apart because some studies measure total data center infrastructure spending, while others count only a narrow slice of server shipments or a single facility type. Differences also come from the base year chosen, how pricing is converted into USD, and whether the estimate reflects installed capacity or actual annual purchasing.
The main gap comes from whether facility and non-server infrastructure spend is bundled into the number, where Mordor Intelligence keeps the value limited to server hardware revenue and excludes data center construction, power systems, and networking equipment that can inflate infrastructure totals.
Benchmark comparison
| Source | Market Size | Gaps in Research Methodology |
|---|---|---|
| Mordor Intelligence | USD 1.90 B (2025) | |
| Industry Portal A | USD 2.16 B (2024) | This figure is often presented as a broader data center investment value, which can combine server spending with facility and infrastructure components, and may not separate annual purchasing from multi-year project totals. |
| Regional Consultancy B | USD 0.25 B (2023) | This estimate appears to focus on a narrower server subset (for example, rack servers in certain enterprise sites), which can exclude cloud deployments and blade form factors and reduce the captured demand pool. |
The spread across the three numbers is largely explained by what gets counted and how the year is defined, rather than by a disagreement on demand direction. By tying totals to clear purchase activity and by checking pricing and timing with local respondents, our final market value stays traceable to repeatable inputs.
Key Questions Answered in the Report
What is the current value of the South Africa data center server market?
The market stands at USD 2.33 billion in 2026 and is projected to reach USD 6.45 billion by 2031.
Which server form factor is growing fastest?
Quarter-height micro-blades lead with a 25.07% CAGR thanks to edge computing needs.
Why are Tier 4 data-centres expanding quickly?
Financial-services and hyperscale operators demand 99.995% uptime to meet regulatory and service-level commitments, boosting Tier 4 at 24.62% CAGR.
How does Eskom’s power situation affect data-centres?
Grid instability raises diesel and energy costs, trimming market CAGR by an estimated 3.4%.
Which workload category will dominate future server demand?
AI and machine-learning workloads are forecast to grow at 26.22% CAGR, surpassing traditional virtualization.
What geographic areas in South Africa host most server capacity?
Johannesburg and Cape Town together host roughly three-quarters of installed racks due to mature fibre backbones and interconnection hubs.
- Data Center Power Market Power systems across the global market, covering component, tier and facility size.
- Artificial Intelligence (AI) Data Center Market Global AI facilities demand, split by facility type, component and tier.
- South Africa Data Center Storage Market Storage in South Africa, split by storage technology, storage type and facility type.
- South Africa Data Center Networking Market Networking in South Africa, split by component.
- Africa Data Center Power Market Africa power systems, split by component, facility type and facility size.
- South Africa Data Center Construction Market South Africa's construction, split by tier, facility size and facility type.
- South Africa Data Center Physical Security Market South Africa physical security, split by solution type and service type.
- South America Data Center Physical Security Market South America physical security, split by solution type and service type.
- Middle East Data Center Immersion Cooling Fluid Market The Middle East immersion fluids, split by fluid type, phase type and facility type.
- Singapore Data Center Storage Market Storage demand across Singapore, covering storage technology, storage type and facility type.
- South America Data Center SSD Market South America SSDs, split by form factor, interface and nand technology.