
Market Overview
| Study Period | 2021 - 2031 |
|---|---|
| Forecast Data Period | 2026 - 2031 |
| Base Year Market Size (2025) | USD 0.78 Billion |
| Market Size (2026) | USD 0.82 Billion |
| Market Size (2031) | USD 1.05 Billion |
| Growth Rate (2026 - 2031) | 5.07 % |
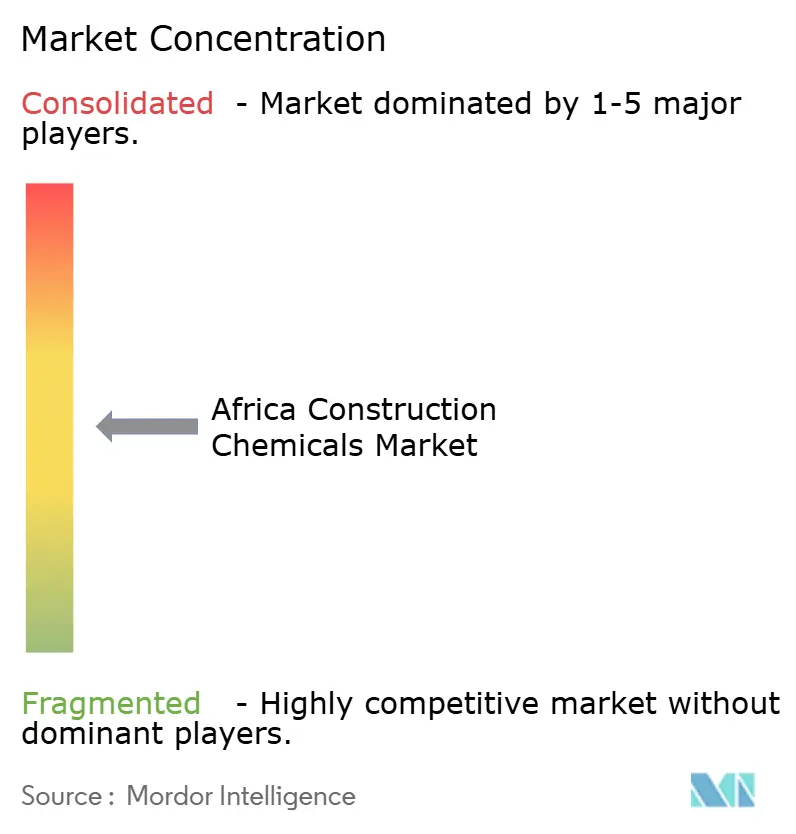
| Market Concentration | Medium |
Major Players *Disclaimer: Major Players sorted in no particular order Image © Mordor Intelligence. Reuse requires attribution under CC BY 4.0. | |
Africa Construction Chemicals Market Analysis by Mordor Intelligence
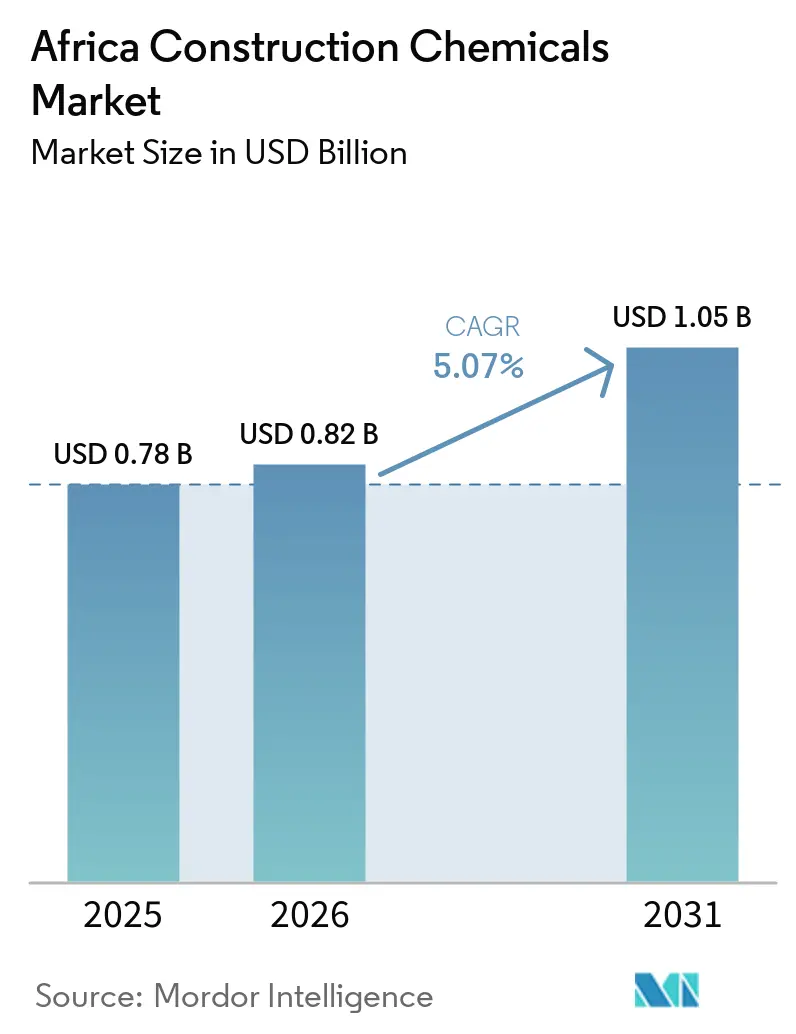
The Africa Construction Chemicals Market size was valued at USD 0.78 billion in 2025 and is estimated to grow from USD 0.82 billion in 2026 to USD 1.05 billion by 2031, at a CAGR of 5.07% during the forecast period (2026-2031). Demand is rising because rapid urbanization collides with historic infrastructure gaps, pushing builders to specify performance additives that extend structural life and lower ownership costs. Public authorities favor speed and durability, steering procurement toward pre-blended mortars, low-VOC sealants, and supplementary cementitious materials that comply with emerging carbon rules. Multinational suppliers exploit these shifts by opening regional labs, while domestic firms concentrate on affordable distribution in commodity admixtures. The Africa construction chemicals market also benefits from megaprojects such as Egypt’s New Administrative Capital and Nigeria’s Dangote Refinery, which create large, time-bound spikes in product offtake and set higher performance benchmarks that gradually spill into residential and commercial work.
Key Report Takeaways
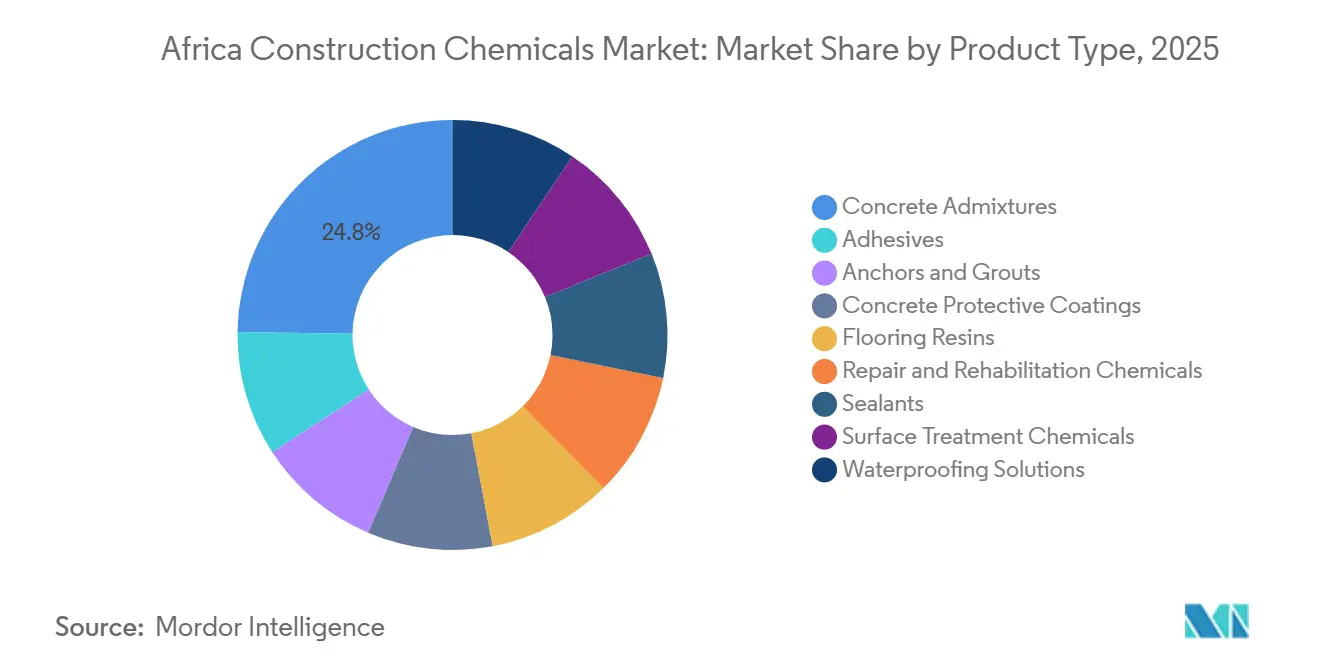
- Concrete admixtures accounted for 24.78% of Africa construction chemicals market share in 2025, while waterproofing solutions are advancing at a 5.72% CAGR through 2031.
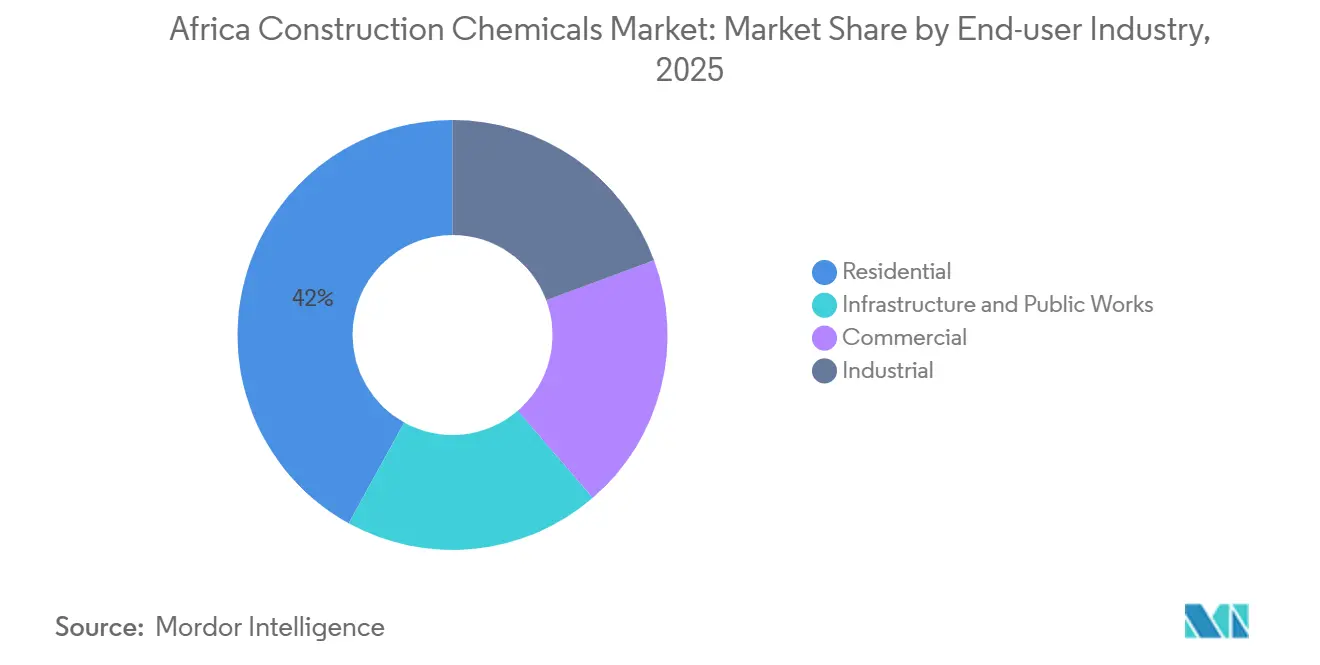
- Residential construction held 41.98% of the Africa construction chemicals market size in 2025, but infrastructure and public works are expanding at a 6.40% CAGR to 2031.
- Rest of Africa aggregated 51.48% of 2025 demand, whereas Egypt is projected to post the fastest 6.34% CAGR between 2026 and 2031.
Note: Market size and forecast figures in this report are generated using Mordor Intelligence’s proprietary estimation framework, updated with the latest available data and insights as of January 2026.
Market Trends and Insights
Drivers Impact Analysis of Africa Construction Chemicals Market*
| Driver | (~) % Impact on CAGR Forecast | Geographic Relevance | Impact Timeline |
|---|---|---|---|
| Infrastructure megaproject pipeline expansion | +1.2% | Egypt, Nigeria, Morocco; spillover to Kenya, Tanzania | Medium term (2-4 years) |
| Affordable-housing policy roll-outs and urban densification | +0.9% | South Africa, Egypt, Nigeria; emerging in Ghana, Côte d'Ivoire | Short term (≤ 2 years) |
| Demand for high-strength, energy-efficient structures | +0.7% | Global, with early adoption in South Africa, Egypt | Long term (≥ 4 years) |
| Green-cement tax incentives and embodied-carbon regulation | +0.6% | South Africa, Morocco; pilot programs in Egypt | Long term (≥ 4 years) |
| Valorisation of mining tailings into supplementary cementitious materials | +0.4% | South Africa, Zambia, DRC; limited to mining-intensive regions | Medium term (2-4 years) |
| Source: Mordor Intelligence | |||
Infrastructure Megaproject Pipeline Expansion
Egypt committed USD 18 billion to infrastructure in 2025, with its New Administrative Capital alone requiring 45 million m³ of concrete through 2030. Similar momentum is visible in Nigeria, where the Dangote Refinery consumed specialty mortars and coatings to protect concrete from hydrocarbons and set new procurement standards for industrial facilities. Morocco’s high-speed rail extension to Marrakech, financed by the African Development Bank, demands low-shrinkage admixtures to curb slab cracking, raising technical entry barriers. Kenya’s Lamu Port–South Sudan–Ethiopia Corridor requires ISO 9001-certified chemical vendors, signaling a growing preference for lifecycle value rather than lowest cost. Contractors tend to stockpile membranes and grouts ahead of rainy seasons, shortening lead times and rewarding distributors with in-country warehousing. Collectively, these megaprojects enlarge the Africa construction chemicals market by channeling premium specifications from marquee infrastructure into mainstream residential and commercial projects.
Affordable-Housing Policy Roll-Outs and Urban Densification
South Africa’s Breaking New Ground program delivered 120,000 subsidized units in 2025, each using polymer-modified mortars that satisfy 50-year durability targets mandated by the National Home Builders Registration Council[1]. Egypt’s Social Housing Initiative seeks 1 million units by 2030 and specifies pre-blended tile adhesives to avoid on-site mixing errors, consolidating volume among accredited suppliers. Nigeria’s National Housing Fund, despite funding gaps, stimulates private developers in Lagos and Abuja to adopt self-leveling floors that accelerate handover schedules. Accra and Nairobi now pursue vertical densification that consumes more anchoring systems and façade sealants per project than single-level sprawl. Predictable multi-year demand allows chemical producers to site blending plants nearer to growth corridors, cutting freight costs and hedging currency swings. The Africa construction chemicals market, therefore, gains a reliable residential volume base that underpins broader capacity investments.
Demand for High-Strength, Energy-Efficient Structures
High-rise builders in Johannesburg, Cairo, and Lagos now specify concrete above 60 MPa compressive strength to optimize floor-area ratios and reduce column footprints. BASF’s MasterGlenium superplasticizers enabled water-cement ratios below 0.35 and captured 18% of South Africa’s high-performance admixture sub-segment in 2025[2]. Morocco’s updated energy code prioritizes thermal mass; this encourages phase-change material-enhanced concrete trials using Sika’s CoolCrete in Casablanca. African Union Agenda 2063 stresses climate adaptation, prompting procurement of reflective surface coatings that lower heat-island effects. Coastal projects increasingly include corrosion-inhibiting admixtures to curb chloride ingress, thereby adding specialty demand to what once was a volume-driven sector. These preferences enlarge the value pool within the Africa construction chemicals market and steer R&D toward multifunctional products.
Green-Cement Tax Incentives and Embodied-Carbon Regulation
South Africa’s amended Carbon Tax Act levies ZAR 190 (USD 10) per ton of CO₂ that exceeds a benchmark, heightening interest in slag and fly-ash blends. Morocco grants a 20% corporate tax rebate when manufacturers use industrial by-products in cementitious blends, channeling EUR 45 million of private capital into low-carbon upgrades since 2024. Egypt introduced voluntary embodied-carbon labeling in 2025; while adoption is nascent, global developers are already demanding compliance, pressuring local suppliers to quantify footprints. Divergent VOC ceilings across markets raise complexity: a waterproofing system cleared in South Africa often needs reformulation before Egyptian approval, lifting R&D costs and narrowing the playing field. Global formulators with distributed labs can amortize these expenses, whereas smaller firms risk market exit, nudging the Africa construction chemicals market toward greater concentration.
Restraints Impact Analysis of Africa Construction Chemicals Market*
| Restraint | (~) % Impact on CAGR Forecast | Geographic Relevance | Impact Timeline |
|---|---|---|---|
| Tightening VOC and hazardous-chemicals limits | -0.5% | South Africa, Egypt; emerging in Nigeria, Kenya | Medium term (2-4 years) |
| Import-dependent raw-material price volatility | -0.6% | All markets except South Africa (partial local production) | Short term (≤ 2 years) |
| Counterfeit/sub-spec products eroding contractor confidence | -0.3% | Nigeria, Kenya, Tanzania; limited in South Africa, Morocco | Short term (≤ 2 years) |
| Source: Mordor Intelligence | |||
Tightening VOC and Hazardous-Chemicals Limits
South Africa now caps VOCs in sealants and coatings at 50 g/L under the National Environmental Management Act, forcing a pivot to water-borne chemistries. Multinationals amortize testing and certification globally, but regionals face unworkable unit costs, prompting product discontinuation. Egypt’s Industrial Emissions Directive bans select phthalates in flooring resins, temporarily cutting supply in the commercial segment. Nigeria drafts similar rules, yet enforcement gaps allow low-compliance imports to coexist with premium lines, eroding contractor confidence. As regulations converge toward EU standards, firms without reformulation capacity risk exclusion from donor-funded infrastructure that mandates third-party certification. This compliance squeeze subtracts growth points from the Africa construction chemicals market.
Import-Dependent Raw-Material Price Volatility
Polymer feedstocks, representing up to 60% of formulation costs, remain largely imported, subjecting local blenders to currency swings and freight shocks. The South African rand fell 12% versus the euro in 2025, compressing margins for contracts priced in rand but supplied with euro-denominated resins. Nigeria’s FX restrictions postponed resin shipments for 90 days, leading to project stalls or quality compromises. Red Sea shipping diversions lifted Rotterdam-to-Lagos freight by 35%, adding USD 200 per ton to landed costs. Dangote’s Lagos polymer plant, due in 2028, may relieve regional scarcity, yet near-term exposure persists. Such volatility induces risk premiums in pricing, checks investment appetite, and brakes the Africa construction chemicals market.
*Our forecasts treat driver/restraint impacts as directional, not additive. The impact forecasts reflect baseline growth, mix effects, and variable interactions.
Africa Construction Chemicals Market Segment Analysis
By Product Type:
Waterproofing Outpaces Legacy AdmixturesConcrete admixtures captured 24.78% of Africa construction chemicals market share in 2025 because they remain standard inputs for ready-mix producers across the continent. Yet waterproofing solutions are expanding at a 5.72% CAGR through 2031, reflecting a pivot toward climate resilience in flood-prone cities such as Lagos and Cape Town. Large infrastructure projects, including the Cairo Metro tunnels, now specify integrated membrane systems like SikaProof, which embed moisture barriers during casting and elevate chemical intensity per cubic meter of concrete. Growing preference for crystalline admixtures that self-seal micro-cracks also pushes substitution away from surface coatings toward internal waterproofing.
Repair and rehabilitation products gain momentum as bridges and water plants built during the 1970s-1990s reach renewal cycles. South Africa’s ZAR 20 billion bridge maintenance backlog accelerates uptake of polymer-modified mortars that extend asset life by 15 years. Data-center construction by hyperscalers fuels demand for electrostatic-dissipative flooring resins, a niche that neither global nor regional players dominate, creating whitespace within the Africa construction chemicals market. Meanwhile, VOC limits challenge solvent-borne protective coatings; contractors remain hesitant to transition fully to water-borne alternatives without equivalent durability data, slowing the replacement cycle.

By End-User Industry:
Residential Dominance Masks Infrastructure SurgeResidential projects commanded 41.98% of the 2025 volume because sub-Saharan governments subsidize housing to manage urban migration. Polymer-rich mortars, tile adhesives, and sealants help achieve rapid completion targets, anchoring steady demand within the Africa construction chemicals market. Yet infrastructure and public works are expanding at a 6.40% CAGR, driven by multilateral lenders that condition loans on green-building compliance. Egypt mandated 20% clinker replacement for public works in 2025, doubling slag-blended admixture sales in one budget cycle. Commercial high-rises in Sandton and Westlands trial self-healing concrete, positioning office developers as early adopters of premium systems.
Industrial facilities, from mining sites in the Copperbelt to refineries in Port Harcourt, require chemical resistance and abrasion tolerance, supporting specialty coating sales at higher margins. As urbanization matures and housing programs taper, infrastructure’s policy tailwind keeps it on track to overtake residential in value contribution by 2031. Consequently, suppliers recalibrate portfolios to align with transport corridors, power plants, and water projects rather than purely residential developers.
Geography Analysis
Egypt and Southern Africa Construction Chemicals Market
Rest of Africa, encompassing more than 40 smaller markets, absorbed 51.48% of 2025 demand, yet distribution remains fragmented, raising logistical costs and complicating certification. Egypt races ahead at a 6.34% CAGR because centralized procurement and a USD 58 billion pipeline provide predictable volume. Sika and BASF opened blending plants in the Suez Economic Zone, trimming delivery times and quarantining margins from currency shocks. South Africa achieves mid-single-digit growth, underpinned by strict South African Bureau of Standards protocols that elevate product quality and create export staging grounds into Botswana and Namibia.
North, West and East Africa Construction Chemicals Market
Nigeria shows dual characteristics: premium demand in Lagos and Abuja contrasts with low-spec purchases in secondary cities. Currency swings and counterfeit infiltration temper growth, yet upcoming petrochemical self-sufficiency could shift cost structures favorably by 2028. Morocco rides EU partnership programs, making it an early adopter of low-VOC sealants and recycled-content admixtures. Kenya, Tanzania, and Ghana benefit from Chinese-funded infrastructure that imports international specifications, forcing local vendors to raise quality or exit, gradually consolidating the regional arm of the Africa construction chemicals market.
Regulatory Landscape
Construction chemicals regulation across Africa is fragmented, with country-by-country requirements on product performance, emissions, and material conformity that can reshape qualification pathways for sealants, coatings, admixtures, and flooring systems. In South Africa, the National Regulator for Compulsory Specifications (NRCS) enforces compulsory specifications for construction materials (including cement VCs), while the South African Bureau of Standards (SABS) issues SANS standards that become mandatory when referenced in a VC, creating a structured compliance route for market access.
Environmental and chemicals controls are increasingly influencing formulation choices and supplier selection in larger, donor-funded projects and public procurement. The report context points to tighter VOC and hazardous-chemical limits in key markets (notably South Africa and Egypt) and the growth of embodied-carbon programs, including Egypt introducing voluntary embodied-carbon labeling in 2025, which together raise testing, documentation, and reformulation needs and favor suppliers with established certification processes and technical service capacity.
Value Chain Analysis
Africa's construction chemicals value chain starts with imported upstream inputs (polymers, dispersants, and specialty additives), followed by regional blending and packaging into liquid and powder formats for local distribution. Import dependence makes logistics and FX exposure material cost drivers, with common entry points including Durban (South Africa), Alexandria and Port Said (Egypt), and Mombasa (Kenya), after which products move through in-country warehouses, distributors, and contractor channels.
Downstream demand is driven by ready-mix and precast producers (admixtures), waterproofing and flooring applicators, and project contractors that increasingly ask for technical submittals, on-site trials, and certification documentation. Local manufacturing is typically focused on blending rather than full chemical synthesis, so suppliers differentiate through formulation know-how, application labs, and field support, while multinational and larger regional players use localized plants and technical centers to shorten lead times and reduce supply variability for infrastructure and public works projects.
Competitive Landscape
The Africa Construction Chemicals market is moderately consolidated. Sika’s mobile in-situ testing units embed engineers at job sites in Egypt and South Africa, creating switching costs where performance failures carry liquidated damages. Regional champions like Dangote Industries, AfriSam, and PPC Ltd leverage price competitiveness and raw-material proximity in commodity admixtures, though they lack deep R&D for advanced chemistries. Whitespace remains in specialized flooring for data centers, seismic retrofitting grouts, and ultra-high-performance concrete. Disruptors such as Dangote’s forthcoming polymer plant aim to backward-integrate feedstocks, potentially lowering cost bases for internal chemical lines and reshaping competitive intensity across West Africa.
Africa Construction Chemicals Industry Leaders
-
Saint-Gobain
-
BASF
-
Sika AG
-
Mapei S.p.A.
-
Dangote Industries Limited
- *Disclaimer: Major Players sorted in no particular order
Africa Construction Chemicals Market Companies Covered in this Report
- BASF
- AfriSam
- Arkema
- CMB
- Conmix
- Dangote Industries Limited
- Dow
- EAMIC
- Portland Cement Plc
- Hemts
- Lafarge
- Mapei
- PPC Ltd
- RowChem Industries Ltd
- Saint-Gobain
- Sika AG
- SOCHEM
Market Opportunities and Future Outlook
Localized manufacturing and technical service footprints are a key whitespace lever where import reliance and lead-time risk can slow project execution, especially for premium waterproofing systems, specialty grouts, and advanced flooring. In 2026, BASF inaugurated an expanded dispersions production setup in Durban with upgraded application capabilities, and Sika expanded manufacturing in Africa (including new capacity in Tanzania referenced in 2026 announcements), reinforcing an operating model in which supply security and local troubleshooting translate into stronger preferred-vendor status on complex infrastructure and industrial builds.
Sustainability-linked materials and circularity programs are also creating more concrete routes to market for differentiated suppliers, alongside the embodied-carbon and VOC compliance needs highlighted in the report context. Saint-Gobain Africa launched a gypsum recycling service in South Africa in 2026, supporting circular construction practices and creating pull-through opportunities for systems positioned around waste reduction and compliance-ready documentation. At the same time, large cement and clinker-substitution initiatives, including Egypt's 2025 public-works clinker replacement mandate noted in the report context, increase demand for admixture packages compatible with higher SCM usage, which opens room for formulators able to demonstrate performance across variable cement chemistries.
Recent Industry Developments in Africa Construction Chemicals Market
- July 2026: Saint-Gobain Africa launched South Africa's first free gypsum recycling service at Gyproc factory in Brakpan, Gauteng. The circular construction initiative strengthens sustainability credentials and reduces waste from gypsum products in regional supply chains. The move reinforces Saint-Gobain Africa's market position by aligning with regional demand for sustainable building solutions.
- July 2026: Saint-Gobain Africa - Launched South Africa's first free gypsum recycling service at its Gyproc factory in Brakpan, Gauteng, to support circular construction. The initiative deepens local circular economy practices and expands Saint-Gobain Africa's impact on sustainable building materials.
- March 2026: BASF inaugurated expanded dispersion production facility in Durban, South Africa. The regional hub expansion enhances coatings and construction materials supply across Southern, East, and West Africa. The facility strengthens BASF's footprint in the Africa construction chemicals market by improving supply security and service capability.
Africa Construction Chemicals Market Report Scope and Research Methodology
Market Definition and Coverage
For this study, the market means revenue earned in Africa from construction chemicals used to improve concrete and building performance, including admixtures, waterproofing systems, repair and protection products, flooring, grouts, sealants, and related solutions sold into construction activity.
Scope exclusions: We exclude bulk cement, aggregates, ready-mix concrete, standard paints, and general building materials that are not sold as construction chemical formulations.
Segments Covered in This Report
- By Product Type
- Adhesives
- Anchors and Grouts
- Concrete Admixtures
- Concrete Protective Coatings
- Flooring Resins
- Repair and Rehabilitation Chemicals
- Sealants
- Surface Treatment Chemicals
- Waterproofing Solutions
- By End-user Industry
- Infrastructure and Public Works
- Commercial
- Industrial
- Residential
- By Geography
- South Africa
- Egypt
- Nigeria
- Morocco
- Rest of Africa
Data Sources, Market Sizing, and Validation
Desk Research
Desk research was used to build the country-level construction activity view and the product demand signals that explain where chemical consumption typically concentrates. We referenced public sources such as national statistics offices and construction ministries, customs and tariff portals for import patterns, UN Comtrade for trade direction checks, the World Bank for infrastructure and housing indicators, and standards bodies that publish concrete and waterproofing-related guidance.
To translate these signals into a usable sizing model, we also reviewed annual reports, investor presentations, and project pipeline announcements from relevant industry participants and contractors, along with reputable press and association updates. Where a public data series was incomplete, we used approved paid subscriptions for company financials and for shipment-level import and export checks to reduce blind spots. This list is illustrative, and many other public and paid sources were also used to collect data, validate assumptions, and clarify questions during analysis.
Primary Interviews and Surveys
Primary work focused on confirming which product groups are actually specified in major African markets, and how pricing moves with raw material costs and logistics. We spoke with manufacturers, distributors, applicators, and large contractors across North Africa and Sub-Saharan Africa, then used follow-up questions to pressure test desk assumptions on mix designs, waterproofing system take-up, and refurbishment demand.
Distribution of primary research fieldwork respondents
| Company type | Respondent position |
|---|---|
| Top tier: 33% | CXOs: 16% |
| Mid tier: 49% | Functional/Unit leaders: 27% |
| Smaller Players: 18% | Managers: 57% |
Market-Sizing & Forecasting
Sizing started with a top-down build where construction spend and project mix by country were converted into a chemicals demand pool using observed usage intensity for major applications. Since the same spending can translate into very different consumption, inputs were adjusted using practical fingerprints such as ready-mix penetration versus site mix, the share of infrastructure work, waterproofing adoption in basements and roofs, refurbishment activity, and typical dosing rates for admixtures in concrete.
After that, selective bottom-up checks were added so totals stayed realistic, including sampled price per kilogram and volume ranges by product group, distributor channel checks, and supplier-level revenue splits where available. Gaps were handled by using proxy countries with similar building codes and construction practices, followed by calibration using trade flows and interview feedback.
For forecasting, scenario analysis was used around the construction pipeline and macro drivers, and then a simple multivariate regression view was applied to link demand with indicators like urban population growth, infrastructure awards, and cement consumption trends. Where expert feedback suggested delays, the ramp-up was shifted rather than forcing a smooth curve, which helps keep the outlook believable.
Data Validation & Update Cycle
Outputs were checked against independent signals such as import values for key chemical categories, cement and concrete activity indicators, and large project timelines in major countries. If a country estimate looked unusually high or low, we rechecked assumptions on dosing, product mix, or pricing, and recontacted respondents when the variance could not be explained with public data.
Before publication, the model and write-up go through a multi-step analyst review, including consistency checks across countries and product groups and a final sanity check against recent news events. Reports are refreshed annually, and interim updates are made when material events occur, such as major policy shifts, currency moves, or large project award cycles. Right before delivery, a fresh pass is completed so clients receive the latest updated view available at that time.
Mordor Intelligence's Africa Construction Chemicals Market Estimate Compared With Other Published Estimates
Published market values for Africa construction chemicals often differ because firms do not always agree on what counts as a construction chemical sale, and because the timing of currency conversion and the chosen base year can move the value noticeably.
The spread usually comes from a few practical choices, including whether tile adhesives and flooring systems are fully included, whether informal distribution is estimated or ignored, and whether price inputs are kept country-specific or blended across regions. Because the forecast window here starts at 2026 and is tied to Africa only (not bundled with the Middle East), the value can look smaller than estimates that combine geographies or pull in adjacent building materials. This is the same scope choice applied by Mordor Intelligence.
Benchmark comparison
| Source | Market Size | Gaps in Research Methodology |
|---|---|---|
| Mordor Intelligence | USD 0.82 B (2026) | |
| Industry Publisher A | USD 2.40 B (2026) | Often uses a wider product basket that can fold in broader building materials and full adhesives categories, and may apply a single regional pricing set that inflates high cost markets across Africa. |
| Regional Consultancy B | USD 4.45 B (2024) | Commonly reports a combined Middle East and Africa total and then references it as a regional figure, while base year and currency timing differ, which makes direct Africa only comparisons difficult. |
Taken together, the comparison shows that geography bundling and product scope are the two biggest levers behind the differences, followed by how prices are normalized across currencies and years. By keeping the estimate tied to clear construction activity drivers and country level checks, we can explain each step and repeat the sizing logic when new project and pricing inputs emerge.
Key Questions Answered in the Report
What is current market size of Africa Construction Chemicals Market?
The Africa Construction Chemicals Market size was valued at USD 0.78 billion in 2025 and is estimated to grow from USD 0.82 billion in 2026 to USD 1.05 billion by 2031, at a CAGR of 5.07% during the forecast period (2026-2031).
What end-user will drive future demand?
Infrastructure and public works are set to expand at a 6.40% CAGR, outpacing residential as lenders link funding to low-carbon criteria.
Why is Egypt the growth hotspot?
Egypt benefits from a USD 58 billion project pipeline, localization incentives for chemicals, and 6.34% forecast CAGR between 2026 and 2031.
How are regulations shaping supply?
Stricter VOC and carbon rules force reformulation, favoring multinationals with R&D resources and prompting consolidation across the region.